College of Computer Science 161CN ... Converting documents to knowledge bases requires that a computer ..... Robert Futrelle is Associate Professor of Computer Science and Head of the ... He received a BS degree in Physics from the.
An edited version of this will appear in IEEE Computer, July, 1992.
Understanding Diagrams in Technical Documents Robert P. Futrelle* , Ioannis A. Kakadiaris, Jeff Alexander, Joseph M. Futrelle, Catherine M. Carriero and Nikos Nikolakis Biological Knowledge Laboratory College of Computer Science 161CN Northeastern University 360 Huntington Ave., Boston, MA 02115 phone: 617-437-2076, FAX: 617-437-5121 Abstract – The ultimate goal of document analysis is to go from hardcopies to a computer-based knowledge bank representing the documents' contents. In technical documents, diagrams often play a critical role. An approach is described which can analyze diagrams to yield structural descriptions for them. The approach combines grammatical and constraint-based techniques in a single scheme called Graphics Constraint Grammars. The most important constraints are the Generalized Equivalence Relations which efficiently recognize conceptual groupings of objects. Keywords – computer vision, constraint satisfaction, diagrams, document analysis, knowledge representation, parsing
Converting documents to knowledge bases requires that a computer function as an intelligent "reader" or "viewer" of the documents. This is an artificial intelligence task involving computer vision and natural language understanding. The Biological Knowledge Laboratory at Northeastern University is developing such a system. Its goal is to develop a knowledge base of biological research papers that supports a Scientist's Assistant. The Assistant is an intelligent system that will provide a scientist with interactive access to the research results, methodology and reasoning in a collection of scientific papers.
* Corresponding author; additionally, home phone: 617-244-8261
Futrelle 6/92, Doc. Image Proc. issue
-1-
printed November 17, 1995 at 4:04 PM
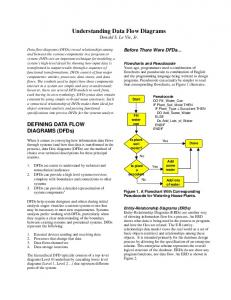
The document understanding system. The system, shown in Figure 1, consists of a series of modules, starting with the scanning of the documents and ending with the Scientist's Assistant. The Scientist's Assistant is based on the paradigm of conceptual retrieval which allows the user to find specific passages and data even if he or she does not know the exact form in which the material is stored. Ultimately, in the Scientist's Assistant a scientist should be able to point to a feature in a diagram from an older paper and ask, “Do people now understand the origin of this?” and have the Scientist's Assistant find the most recent discussion of the phenomenon. In order for this to happen, the diagrams in the documents first have to be analyzed and their contents added to the knowledge base. We know how to build some of the modules in Figure 1, but others require extensive research and experimentation1,2. This means that it is not possible to test the entire system or even get input for some of the later modules whenever they depend on modules still under development. To avoid this impasse, we utilize alternative paths through the system during development and testing (the dashed lines in the figure). The novel aspects of the system include the design and use of Graphics Constraint Grammars for describing and analyzing diagrams, the use of spatial indexing in diagram analysis and understanding, and extensions of natural language processing techniques to complex scientific text. This paper will emphasize the Diagram Understanding System. Work on text processing is discussed elsewhere1.
Futrelle 6/92, Doc. Image Proc. issue
-2-
printed November 17, 1995 at 4:04 PM
[use as sidebar for Figure 1 or insert as text at this location:]
The Document Understanding System In Figure 1, ovals represent databases or knowledge bases and rectangles represent processing stages and systems. Documents: There are 1,518 papers in our corpus covering essentially all of a subfield of biology (bacterial chemotaxis) from its beginning in 1965. Object form of diagrams: Using image processing or the alternative of tracing over scanned images, the diagrams are converted from scanned, pixel-based images into a collection of graphical objects such as lines, polygons and positioned text. Diagram understanding: Graphics Constraint Grammars are used for syntactic and semantic analysis of diagrams. Spatial indexing is used to rapidly discover spatial relations. The output is knowledge frames. Tagged text: This comprises an indexed database of the entire text of each paper, encoded using the Standard Generalized Markup Language (SGML). The encoding marks every logical element such as sections, paragraphs and sentences as well as notation such as superscripts, subscripts and Greek letters. Natural language understanding: This is a complex enterprise employing lexicons, grammars, parsers and semantic interpreters, resulting in linked knowledge frames representing text semantics. Scientist’s Assistant: The Scientist’s Assistant is the goal of the project, an intelligent system that allows a scientist to navigate through the knowledge bases.
Futrelle 6/92, Doc. Image Proc. issue
-3-
printed November 17, 1995 at 4:04 PM
The Diagram Understanding System – Graphics Constraint Grammars. Just as we have to learn the language we read and write, we have to learn the representational conventions of diagrams. Once learned, the process of reading or interpreting a diagram is relatively effortless. But for a machine, life is not so easy. A human has to first describe the representational conventions formally and concisely in a way that allows the computer to carry out an analysis. This description is similar to the grammars that are written to describe natural language. One of the major conventions in diagrams is the separation of the informational components from the substrate on which the information is presented. For example, in Figure 2, the primary informational items are the data points. The long vertical and horizontal scale lines are substrate items, serving as a "frame" in which to present the data. This division of labor can be subtle. For example, the positions of the circular data points are informational, whereas the diameters of the circles are not. We describe the possible organizations of diagrams with grammars. A grammar is a logical specification of a possibly infinite set of structures. It specifies a set of objects, their attributes and their relations. In the Graphics Constraint Grammars that we have developed, low-level elements are objects such as lines and polygons. High-level objects are more complex structures such as a Data_points or Scale_line. Graphics Constraint Grammars are similar to the approach developed independently by Helm, Marriott and Odersky3. The major differences in the approaches is that ours include[s] Generalized Equivalence Relations and spatial indexing, both described below. Another difference is that our grammars are incorporated in a complete system for document understanding. Each Graphics Constraint Grammar is a collection of rules (Figure 3). Each rule consists of a production, a set of constraints and a set of propagators: • A production names the rule object as its left-hand side , and the constituents of the object as its right-hand side
Futrelle 6/92, Doc. Image Proc. issue
-4-
printed November 17, 1995 at 4:04 PM
• The constraints consist of spatial relations such as Near, Horizontal, Aligned, etc. as well as type constraints which require that an object be of a certain type such as a line or text. • The propagators describe the relations between the attributes of the rule object and the attributes of the constituents. For example, the Center attribute of a set of lines might be computed as the centerof-mass of the set of constituent lines. The constituents of a rule may each be complex entities defined by still other rules. This allows us to build hierarchical descriptions of complex diagrams. An example diagram and grammar. The example diagram of Figure 2 is a typical data graph. The highest level object of its hierarchical description has the constituents Data_set, Vertical_scale and Horizontal_scale. The Horizontal_scale in turn has constituents Horizontal_scale_line and Axis_label ("Time, hours", in the example). A fragment of the graphics constraint grammar for a data graph is given in Figure 3. Rule 1 defines the rule object, Horizontal_scale_line , with constituents Horizontal_axis_line and Ticks. The Ticks object is of type Labeled_x_ticks which is defined by Rule 2 as a pair of sets whose elements are Tick and Label, respectively. The propagator for Rule 1 sets the value of the Head attribute of Horizontal_scale_line to the line object, Horizontal_axis_line. The "Head" attribute is the single item which best represents the rule object. The propagator for Rule 2 sets the value of Head to a bounding box, the smallest rectangle surrounding all the objects in the sets Tick_marks and Label_set. Generalized Equivalence Relations as constraints. One of the distinguishing characteristics of the substrate of the data graph in Figure 2 is its simple and regular organization. For example, the x-axis tick marks are horizontally aligned and equally spaced. This organization is reflected in the two corresponding constraints in Rule 2.
Futrelle 6/92, Doc. Image Proc. issue
-5-
printed November 17, 1995 at 4:04 PM
Sets of items that group together such as the tick marks in the example can be described by equivalence relations. A simple equivalence relation is Equal_length. When applied to a collection of lines, Equal_length divides the lines up into a collection of non-overlapping equivalence classes, each containing lines of the same length. An equivalence relation is reflexive, symmetric and transitive. We have extended the notion of the equivalence relation to that of the Generalized Equivalence Relation (GER). A GER generalizes an ordinary equivalence relation in two ways: it can be approximate in nature, so it does not produce strictly non-overlapping [it produces classes that may overlap] classes, and it has grouping relations which are not normally thought of as equivalence relations, such as Equal-spaced. An [One] example of a strict equivalence relation is Coincident, referring to the positions of two objects. A generalization of Coincident is Near, a relation of great importance in diagram analysis. If two objects are near one another, they often have a logical relation, as tick marks and their labels do. Near is a GER; it is not a true equivalence relation because it violates transitivity, e.g., if A is Near B and B is Near C, it is not necessarily true that A is Near C. Another useful GER is Strictly_near used in Rule 1. Strictly_near requires that all parts of one object be near some part of another; it is not a symmetric relation. Efficient parsing of Graphics Constraint Grammars. Solving a Graphics Constraint Grammars is potentially an expensive computation. In finding a solution to a given rule, a number of possible assignments of objects to variables may have to be tried. This is the classic constraint satisfaction problem4. The usual combinatorial explosion met in these problems is tamed a great deal by adopting the hierarchical view. The hierarchical view factors the problem into a set of small, independent problems that can be solved sequentially. Furthermore, the constraints that deal with the largest number of objects are typically Generalized Equivalence Relations. These are designed to only generate solutions that include the maximal number of objects satisfying the constraint. In this way, large number of elements such as the data points or tick marks in data graphs are turned into single entities before they have to be dealt with in higher level rules.
Futrelle 6/92, Doc. Image Proc. issue
-6-
printed November 17, 1995 at 4:04 PM
Another potentially expensive set of computations involves geometrical relations such as Near or Aligned. For example, given an object A, we might need to find all objects B within a distance L from A, i.e., satisfying (Near A B L). The normal method of doing this is to inspect every object in the diagram, compute its distance from A and compare that to L. Given the large amount of random-access memory in modern machines, it is more efficient to do such computations by precomputing large data structures that make such computations run quickly — by trading space for time. In the Diagram Understanding System this is done by building a pyramidal data structure2. Each level of the pyramid is a square array of cells representing the diagram at a different level of resolution. During the precomputation, each graphic object is examined and a reference to the object is placed in any cell that is touched by or contains the object. The pyramidal data structure then operates as a spatial index. Given a point in space, the objects at that point can be found immediately. Conversely, given any object, the cells it occupies are immediately available in a list stored in the object. The approach is general, because the same cell-based representation is used whether the objects are lines, polygons, curves or text. Therefore only one version of each geometrical constraint algorithm needs to be written, one that deals with cells. Spatial indexing can then be used to efficiently compute a constraint such as (Near A B L). A level of the pyramid is picked on the basis of the parameter L and only the cells adjacent to the cells including A are examined and all the objects found in those cells are returned. The resolution of the pyramid stops well short of pixel-level resolution, so the pyramidal data structure is not particularly large, typically no larger than 128 x 128. Some objects cover a lot of area, so it is inefficient to build the number of cell references required for them. For example, as the parsing proceeds, bounding boxes to [for] high level objects, such as the one propagated in Rule 2, may be quite large. They are stored in a different data structure, optimized for the efficient computation of constraints. There are many complex issues in diagram parsing which we will only touch on here. There may be many interpretations for a diagram, so information such as the figure caption is used to narrow the interpretation. Once the data is extracted from a data graph, further analysis is necessary
Futrelle 6/92, Doc. Image Proc. issue
-7-
printed November 17, 1995 at 4:04 PM
to find data maxima, regions of high slope, etc., for building the knowledge representation that is to be queried. Results. Currently, (3/92), 137 articles have had their text encoded using SGML. 174 diagrams have been converted to object form. The Diagram Understanding System is working — about a dozen diagrams have been analyzed with early versions of the system. For data graphs the analysis has been able to reconstruct the data point values themselves. The current prototype of the Scientist's Assistant incorporates object-based diagrams, not bitmaps, and contains automatically generated hypertext links between text references and figures, tables, bibliographic items and footnotes. Biologists have used the prototype system and given us valuable feedback. This feedback is helping to guide the ongoing task of incorporating more knowledge-based features in the Assistant. Conclusions. The technology we are developing has countless applications. The biomedical literature alone contains some 7 million items since 1966 (as indexed in Medline), increasing at over 300,000 items per year. Essentially every one of the 7 million items is available only as hardcopy, so the all the techniques described here are necessary if any of this knowledge is to be converted into electronic form. In the future, when documents are originated, stored and accessed purely electronically, it will still be necessary to analyze the text and diagrams in the papers in order to build useful knowledge bases. The research described here is helping to prepare us for the age of fully electronic documents. Acknowledgments. Thanks to Kent Wittenberg for discussions. This research was supported in part by NSF grant DIR-8814522.
References 1. R. P. Futrelle, C. C. Dunn, , D. S. Ellis, , & M. J. Pescitelli, Jr. (1991). Preprocessing and lexicon design for parsing technical text. In Proceedings of the 2nd International Workshop on Parsing Technologies, Assoc. Computational Linguistics, Morristown, NJ, 1991, pp. 31-40.
Futrelle 6/92, Doc. Image Proc. issue
-8-
printed November 17, 1995 at 4:04 PM
2. R.P. Futrelle, "Strategies for Diagram Understanding Object/Spatial Data Structures, Animate Vision, and Generalized Equivalence," Proc. 10th ICPR, IEEE , New York, 1990, pp. 403-408.
3. R. Helm, K. Marriott, and M. Odersky, "Building Visual Language Parsers," CHI '91 , ACM, New York, 1991, pp. 105-112.
4. J. A. Mulder, A. K. Mackworth, and W. S. Havens, "Knowledge Structuring and Constraint Satisfaction: The Mapsee Approach," IEEE Trans. Pattern Anal. Mach. Intelligence, Vol. 10, No. 6, Nov. 1988, pp. 866-879.
Futrelle 6/92, Doc. Image Proc. issue
-9-
printed November 17, 1995 at 4:04 PM
Futrelle 6/92, Doc. Image Proc. issue
Trace to objects Diagram Understanding System Image processing
Documents
Scan documents OCR
Object recognition
Parse
SGML tagging
Generate frames
Diagram KB
Scientist's Assistant
Tagged text
- 10 printed November 17, 1995 at 4:04 PM
Type and SGML tag
Parse
Generate logical forms
Generate frames
Natural Language Understanding System
Figure 1. System Overview. Components of the document understanding system. Databases and knowledge bases are shown as ovals. Processing systems and subsystems are shown as rectangles. The dashed arrows show the alternative strategies that are used during system development.
TextKB
Activity, %
100
50
0 0
2
4
Time, hours
Figure 2. A data graph, the most common type of diagram appearing in scientific and technical papers. The data points are the most important informational elements. The more regularly arranged elements, such as the tick marks, serve a supporting role.
Futrelle 6/92, Doc. Image Proc. issue
- 11 -
printed November 17, 1995 at 4:04 PM
Rule 1: Production: Horizontal_scale_line ⇒ Horizontal_axis_line, Ticks Type constraints: (Line Horizontal_axis_line) (Labeled_x_ticks Ticks ) Geometrical constraints: (Strictly_near Horizontal_axis_line
Ticks
L1)
Propagators: Head ⇐ Horizontal_axis_line Rule 2: Production: Labeled_x_ticks ⇒ Tick_marks, Label_set Type constraints: (Set_and_members Tick_marks Tick) (Set_and_members Label_set Label) (Line Tick) (Text Label) Geometrical constraints: (Vertical Tick) (Horizontally_aligned Tick_marks) (Equal_spaced Tick_marks) (Vertically_aligned :some Tick :every Label) (Near :some Tick :every Label L2) Propagators: [none] Head ⇐ (Bounding_box Tick_marks Label_set)
Figure 3. Two rules from a Graphics Constraint Grammar that describe the horizontal scale line in the data graph shown in Figure 2. Rule 1 refers to an object of type Labeled_x_ticks which is in turn defined by Rule 2.
Futrelle 6/92, Doc. Image Proc. issue
- 12 -
printed November 17, 1995 at 4:04 PM
Biographies
Robert Futrelle is Associate Professor of Computer Science and Head of the Biological Knowledge Laboratory at Northeastern University. Between 1975 and 1985 he served on the biology faculty of the University of Illinois at UrbanaChampaign. He was awarded a PhD in theoretical physics from MIT in 1966.
Ioannis Kakadiaris is a Ph.D. student in Computer Science at the University of Pennsylvania. His research interests include diagram understanding, foveal sensing and parallel processing. He received a BS degree in Physics from the University of Athens, Greece, and an MS degree in Computer Science from Northeastern University in 1991.
Jeff Alexander is a graduate student in Computer Science at Northeastern University where he received his MS in 1992. He also works at the Charles Stark Draper Laboratory in Cambridge, MA.
Joseph Futrelle has worked for the University of Illinois and Symbolics, Inc. He is currently an undergraduate at Hampshire College, Amherst, MA, concentrating in computer music.
Catherine Carriero is a graduate student in Computer Science at Northeastern University. Her research interests include diagram understanding and parallel algorithms. She received a BA degree in Mathematical Sciences from Johns Hopkins University.
Futrelle 6/92, Doc. Image Proc. issue
- 13 -
printed November 17, 1995 at 4:04 PM
Nikos Nikolakis is a Ph.D. student in Computer Science at Northeastern University. His interests include image processing and diagram understanding. He received his B.S. degree from University of Crete, Greece and his M.S. degree in Computer Science from Northeastern in 1991.
Futrelle 6/92, Doc. Image Proc. issue
- 14 -
printed November 17, 1995 at 4:04 PM