Understanding Internet Usage and Network Locality in a Rural Community Wireless Mesh Network Adisorn Lertsinsrubtavee, Liang Wang, Arjuna Sathiaseelan,Jon Crowcroft Computer Laboratory University of Cambridge, UK
[email protected] ABSTRACT Community networks owned and operated by local communities have recently gained popularity as a low cost solution for Internet access. In this paper, we seek to understand the characteristics of Internet usage in community networks and provide useful insights on designing and improving community networks in rural areas. We report the results of a socio-technical study carried out during a three month measurement of a community wireless mesh network (CWMN) which has been operating for two years in a rural area of northern Thailand. An on-site social interview was also conducted to supplement our analysis. The results reveal several interesting findings: rural users do use online social networks, instant messaging applications and online games similarly to urban users; they install unnecessary applications on their mobile phones and are completely obvious to their side effects – the traffic from these applications accounts for a major share of the traffic leading to numerous network anomalies. Finally our analysis uncovers the characteristic of locality in community networks where users in close geographical proximity interact with each other.
Categories and Subject Descriptors C.2.3 [Network Operations]: Network Monitoring
General Terms Experimentation, Measurement
Keywords Community Wireless Mesh Network
1.
INTRODUCTION
Community networks have played a key role in extending the Internet frontier all over the world, especially in the rural areas of both developing and developed countries [10, 17]. In such rural areas, which typically are isolated villages far from the cities, a conventional for-profit Internet Service Provider (ISP) has very little (or no) incentive to deploy expensive telecommunication infrastructures since it is difficult to achieve economy of scale due to the population sparsity. The lack of connectivity confines people’s access to Internet information which widens the digital divide and exacerbates global social and economic inequalities.
Nunthaphat Weshsuwannarugs, Apinun Tunpan, Kanchana Kanchanasut Internet Education and Research Laboratory Asian Institute of Technology, Thailand {nunthaphat,atunpan,kanchana}@ait.asia Community networks, on the other hand, allow each individual user to join the network and share the connectivity by setting up their own relay routers at a village or even city scale. They provide a scalable and economically affordable solution for Internet connection, especially when a conventional ISP fails to do so. Community networks have attracted significant research interests in recent years. In this paper, we seek to understand the characteristics of Internet usage in a community wireless mesh network (CWMN) and provide useful insights on designing and improving community networks in rural areas. We report the results of a sociotechnical study carried out during a three month measurement of a CWMN called TakNet deployed in Thai Samakhee, a rural village in northern Thailand. The technical analysis from the monitoring platform is complemented with a thorough on-site social interview that covers the majority of the active users in the village in order to provide both ground truth and deep understanding of the results. Specifically, our key findings in deploying and running TakNet are as follows: • We share our firsthand experience in successfully deploying and running a CWMN in a rural village in Thailand. Our data analysis and social interviews show that the villagers gain significant benefits from the Internet to improve education, agriculture, business and social activities by accessing online services. • We observe that the collective content popularity distribution is a mixture of both human and application behaviours, which makes it quite different from the previous measurement work [2, 8]. Certain applications and advertisements significantly distort the content popularity distribution caused by pure user behaviours. We apply some intuitive techniques to identify such misbehaviours, shedding light on how to filter the actual valuable content for end users. • Both the data analysis and social interview reveal that the rural communications in Thailand possess strong spatial locality, with approximately 10% to 20% of the messages exchanged between local users living in the same village. However, these percentages are much lower than those reported in previous measurements (e.g., Africa [14]).
2.
TAKNET CWMN
In general a CWMN is a form of self-configuring network wherein routers use dynamic routing protocols to form an ad-hoc network. CWMNs are popular intranet solutions in rural areas due to their robustness and low requirements on resources [10, 17]. TakNet1 is a live community network that extends Internet services to a rural Thai village as well as providing a platform for measurement and data analysis. This paper aims to report our hands-on experience in deploying TakNet and also reveals the Internet usage in this rural network through a joint collaboration between Asian Institute of Technology (AIT) and University of Cambridge.
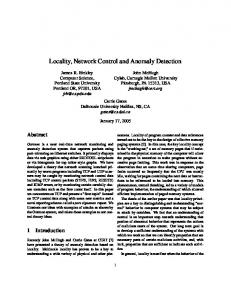
village to cover all target households. The furthest household may suffer from high latency since it requires several hops to deliver a packet to the gateway. To reduce such latency and improve the connectivity, a core router bridged to the gateway was strategically placed in the center of the village. Core Router
R4
Access Router ADSL gateway
R7
R3
R12 R14
R13
R5 Core Router
R11
ADSL Gateway
R2 R1
2.1
R8
Thai Samakhee: Economy and Culture
R10 R9
Internet subscription in Thailand is rather expensive even for urban residents with average wages higher than in rural areas. The digital divide is therefore a common and urgent social issue. TakNet aims to provide an affordable connectivity service to rural residents by amortising the subscription cost over a local user community in a village. Herein, we focus on one specific TakNet deployment-Thai Samakhee, a small village in northern Thailand. The village consists of 50 households with a population of approximately 300. The population is a mixture of Thai and Burmese people who only speak Thai with limited knowledge of English. Similarly to many other villages in developing countries, Thai Samakhee suffers from information scarcity due to the gap between income and Internet fees. Such severe digital divide motivated us to deploy TakNet to provide a low-cost Internet service in the village.
2.2
Budget and Deployment
One goal of TakNet deployment is to build a robust system which can continually provide reliable services for at least 3 to 5 years. We carefully balanced between the reliability and the price of each device. We chose Unifi UAP outdoor as the core router and TP-Link MR 3040 as the access router. In total, the deployment cost of TakNet is approximately 1,200 USD, including all the hardware and miscellaneous expenses. In addition, there is a monthly ADSL subscription fee of 28 USD which is shared among the villagers. The monthly cost of TakNet is amortised over the participants who agree to install the routers inside their houses (to have better connectivity), which mainly consists of the shared ADSL subscription fee (2 USD), electricity bill (1 USD) and regular maintenance (2 USD). The network topology of TakNet is illustrated in Figure 1. The ADSL connection has advertised rates of 4 Mbps download and 512 Kbps upload bandwidth. Each access router provides two SSIDs: one operates in the WiFi ad-hoc mode to allow OLSR [7], constructing a wireless mesh network; the other operates in the Access Point mode to allow user devices to connect with DHCP. Each router is equipped with a 16 GB flash memory for data collection. We deployed 14 such routers across the 1 http://www.interlab.ait.asia/TakNet
R6
Figure 1: Topology of TakNet
2.3
Measurement Setup
TakNet provides us with a platform to study the particular user behaviours in a rural setting. Especially, we are interested in understanding if rural users use the Internet differently from urban users. Due to limited budget, we were largely limited in our choice of devices for the measurements platform. To ensure that our measurements did not affect the overall performance of TakNet, we had to keep our measurements extremely light weight. Technically, we measured the traffic volume passing through each router using ifconfig with a 60-second interval. By monitoring outbound and inbound traffic, we were able to understand the utilisation of the network. As web traffic constitutes most of the traffic in community networks [13, 15], we use tcpdump to intercept the HTTP traffic and filter out the URLs contained in the headers to keep track of the domains requested by TakNet users. Specifically, the core router (Unifi UAP) does not have any additional port to extend the memory, and thus it operates with only 4MB internal flash memory. Therefore, we intentionally drop the pcap messages in tcpdump as it introduces intolerable burdens on the core router, which can drag down the throughput. We tried capturing more data but experienced many severe issues like system failures due to the limited capability of the measurement platform. Even worse, it took several days for our technician to recover the system due to travelling overhead between AIT Lab and the village. Due to all these reasons, we only collected the minimum data to avoid introducing instability into the system. The measurements were automatically synchronised with our main server in AIT Lab during the off-peak hours (1.00 am to 5.00 am).
3.
SOCIAL INTERVIEW
In addition to the measurement platform, we also performed a social interview to complement the technical analysis. The purposes of the social interview are two-fold: First, the interview is able to uncover some characteristics that the tech-
nical analysis fails to capture. Second, the interview is able to reflect the ground truth to some extent with which we can validate our technical analysis.
3.1
Questionnaire Design
The social interview is designed in the form of on-site in person conversions. Each interviewee is asked to answer a well-defined questionnaire, along with a free-style conversation revolving around various aspects of their daily Internet usage. Each interview lasts about 30 minutes and is recorded for future reference. The questionnaire covers three main perspectives: personal information, typical usage, and user feedback. The detailed information included in each perspective is summarised as follows: Personal information: gender, age, occupation, hobbies, and average income level; Typical usage: average time and typical period of Internet usage, favourite websites and services, estimated ratio between local and outside communications regarding online social networks and instant message services; User feedback: problems and difficulties in using TakNet, satisfaction of the service, expectations for future improvements (e.g., new features and functionality, quality of the service).
3.2
On-Site Interview
The on-site interviews were conducted in April 2015 in Thai Samakhee village. In total 52 people were interviewed: 34 females and 18 males. Their ages range from 8 to 50 which can be divided into the following groups: 14 children (8 to 16), 8 teenagers (16 to 21), 30 adults (over 22). The children and teenager groups are not on the job market yet because they have no income. The monthly wages of the adult group vary between 140 USD to 560 USD. The findings from our interviews are summarised as follows: Device used: In TakNet, the device used to access the network can be divided into two categories: mobile phones (60%) and personal computers (40%). Approximately 91% of the mobile phones are Android-based and 9% are iPhones and Windows phones. Similarly to other Thai villages, Microsoft Windows dominates all the PCs in Thai Samakhee [1]. Usage pattern: The most common and preferable period of accessing the Internet is between 17.00 and 22.00 which roughly covers 80% of the interviewees. The second peak period is between 6.00 and 12.00 which covers 30% of the users. Other periods like 12.00 to 17.00 and 22.00 to 6.00 contribute little to the overall usage (21% and 12.5% respectively). On average, the users spend about 4 hours every day on the Internet accessing various services. Social communications: Online Social Networks (OSNs) are popular in Thai Samakhee, 87.5% of the users are active on Facebook. The OSNs are commonly used for connecting with friends and families. Although everyone has remote contacts, it is worth noting that 42% have local contacts within the same village. However, Facebook is not the top choice for personal communication in the village. Also different from the prior measurements [16], we found out that email service is not pop-
ular (only 7.6% actually use email) in Thai Samakhee. The dominant instant messaging service is Line,2 used by 71% of the interviewees. Line is developed by a company, namely naver and is considered as a substitute for conventional SMS and voice service. The text message is preferred to voice calls by most users. The Line service reveals the fact that there is a significant amount of localised communications within the village. Our interview shows that 81% of the Line users have local contacts. Based on the users’ own estimation, about 10% – 20% of messages are exchanged with local contacts. We will verify this estimate and extend the discussion in Section 4.4. Popular content: Google is the most requested website in Thai Samakhee. Most users set Google as their default search engine. The users’ interest on different content highly correlates to their age, which draws a clear boundary between different age groups. For instance, the teenager group search for educational content, 28% of the users regularly visit www.dek-d.com which is the most popular education website in Thailand. Meanwhile, 80% of the adult group heavily uses the Internet for job hunting, agriculture and professional training. For all three groups, videos watched on Youtube are mostly related to entertainment. User feedback: We collect valuable feedback in the interview to help us identify the problems of building and maintaining TakNet. Most feedback revolves around the instability of accessing the TakNet service, and the long delay of response. Interestingly, our interviews also uncover an unanticipated reaction related to misinformed knowledge on using uncommon applications. In particular, 85% of interviewees refer to an android application called CM Battery3 which claims to be able to improve both connectivity and bandwidth. On the contrary, this application generates an enormous amount of requests which not only wastes the bandwidth but also causes numerous network anomalies such as advertisements. Another issue worth mentioning is the extra cost incurred by electricity bills. After three months of initial deployments, four participants decided to drop out. This incident shows that in a rural setting where average income is low, the benefits of Internet access still cannot outrun the concerns on the marginal cost (e.g., electricity bill, subscription fee) in many cases.
4.
DATA ANALYSIS
In this section, we present our data analysis on the collected dataset in TakNet. The technical analysis is complemented with the insights drawn from the social interview presented in Section 3. Moreover, we also discuss the implications for the system design.
4.1
Traffic Usage
One major concern of TakNet is whether it can provide enough bandwidth to meet users’ demands. Figures 2a and 2b 2 http://line.me/en/ 3 https://play.google.com/store/apps/details?id=com.cleanmaster. battery&hl=en
14000
Feb Mar Apr
Traffic load (MB/day)
Traffic load (MB/day)
1500
1000
500
mains over the three months observation. We classify them into a set of broad categories as follows: mobile applications (ksmobile, naver), social networks (facebook, instagram), entertainment (youtube), search engine (google, baidu), web portal (3g) and online games (umeng, animaljam). 14 Fraction of requests (%)
plot the aggregated upload and download traffic passing through the ADSL gateway on a daily basis from February to April 2015. The aggregated upload and download traffic are 45 GB and 574 GB respectively. We see a stable growth in bandwidth usage after TakNet has been deployed. February to March saw the traffic increasing 25% (upload) and 28.9% (download). From March to April, the traffic increased about 20% (upload) and 15.82% (download). Feb Mar Apr
12000 10000 8000
12 10 8 6 4 2 0
4000
(a) Upload traffic
(b) Download traffic
Figure 2: Traffic volume measured at Internet gateway
We analyse traffic usage over the week from the 6th to 12th of April, in which traffic volume is highest in our trace. Figure 3 shows the average bandwidth consumption in one hour units. We present only the pattern of download traffic which is more significant. The cycle presents two peak-hours periods including the morning from 8.00 to 12.00 and the evening from 17.00 to 21.00. This dual-peak pattern is quite common in rural Asian countries, as also addressed in [8]. The ADSL link has a committed download bandwidth of 4 Mbps and a committed upload bandwidth of 512 Kbps. The results in Figure 3 show that the traffic load during the peak hours almost reached the committed bandwidth. As usage continues to grow, ADSL providers may increase the number of connectivities to the village and thus increasing the capacity of our TakNet with more gateways and users. However, the usage pattern shows the light load from late night to dawn and also a short period during the afternoon. Time of day (Hours) 3.5
Mon
Tue
Wed
Thu
Fri
Sat
Sun
Traffic load (Mbps)
3 2.5 2 1.5 1 0.5
01 . 07 00 . 13 00 . 19 00 . 01 00 . 07 00 . 13 00 . 19 00 . 01 00 . 07 00 . 13 00 . 19 00 . 01 00 . 07 00 . 13 00 . 19 00 . 01 00 . 07 00 . 13 00 . 19 00 . 01 00 . 07 00 . 13 00 . 19 00 . 01 00 . 07 00 . 13 00 . 19 00 .0 0
0
Figure 3: Traffic usage pattern over a week
4.2
3g insta umeng Domain (url)
fb
you animal
14
20 40 60 80 Day (1 Febuary 2015 − 30 April 2015)
Fraction of requests (%)
0 0
20 40 60 80 Day (1 Febuary 2015 − 30 April 2015)
naver baidu google
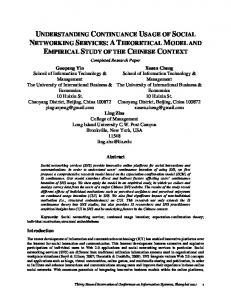
(a) Top ten content popularity follows a Zipf distribution with α=0.57 which is much smaller than those in prior work.
2000 0 0
ks
6000
Content Popularity
In this section, we aim to understand the behaviour of Internet usage in TakNet in terms of popular services and web traffic classification. We extract all HTTP requests at the core router and inspect the host field to explore the domains requested by users. Figure 4a presents the top ten visited do-
12 10 8 6 4 2 0
naver google inst
fb
you apple Domain (url)
msn ytimg thscoredek−d
(b) Top ten content popularity follows a Zipf distribution with α = 1.05 after removing misbehaviour domains.
Figure 4: Content popularity with and without misbehaviour domains. After removing misbehaviour domains, the α value increases from 0.57 to 1.05 which becomes more consistent with other α values in the prior measurements.
Unlike other studies on web traffic patterns [2, 8], the content popularity in TakNet does not generally follow a Zipf distribution with the commonly known parameter (i.e., α ∈ (0.9, 1.1)). This is due to the misbehaviours of some applications. More precisely, certain applications continually generate an enormous amount of requests which significantly distort the content popularity distribution. The analysis of these misbehaviours will be explained in Section 4.3. After removing all suspicious domains, the content popularity follows a Zipf distribution, with α = 1.05 as presented in Figure 4b. On the other hand, some valuable contents can suffer interference and be relegated to the tail of distribution. In our case, there are some valuable domains such as an education website (dek-d.com) and a local newspaper website (khaosod.co.th) presented in the tail of distribution. Besides, our interviews also reveal that there are villagers who regularly access these websites every day. However, traditional caching strategies mostly rely on popularity in terms of frequency of access or flow size [18]. Therefore, most of these websites located at the tail may not be considered by traditional caching algorithms. Our findings suggest that there is a need for more and better caching strategies to be developed that take context into consideration rather than frequency of access to serve crucial services in rural communities.
4.3
Analysis of Suspicious Domains
The goal of this section is to identify the misbehaviour
15000
interviews, all Thai Samakhee villagers can only communicate in Thai with limited English. However, baidu and 3g, presented as the 3rd and 5th rank in content popularity, provide only information written in Chinese. To explore this further, we analyse the timestamp of each request and compute the interarrival time of every subsequent request. The results in Figure 7 show that most requests are made with an interarrival time of less than 2 seconds. This is clearly due to the application behaviour where a stream of requests is scheduled in a specific time period with a short interarrival time [9]. In addition, we suspect that the requests for baidu are mainly generated from the baidu Internet browser that is unintentionally installed by users.
10000
200
ks
naver baidu google
3g inst umeng Domain (url)
fb
you
animal
Figure 5: The boxplot of the popular domains visited from all routers. The large outliers usually correspond to the low Jain’s Index values.
150
100
50
1000 800 600 400 200
0 0
5
10 15 Interval (s)
(a) domain:3g.cn
0.8 Jain Fairness Index
Number of requests
0
0.6
20
25
0 0
5
10
15
20
25
Interval (s)
(b) domain:baidu.com
Figure 7: The interarrival time of suspicious domains
0.4 0.2 0
1400 1200
5000
Number of requests
Number of requests
domains that distort the content distribution presented in the previous section. Figure 5 shows the boxplot of the top ten popular domains and the number of requests from all routers. Some popular domains, for instance baidu, have very high outlier. This suggests that a large number of requests is generated from some specific routers. To further investigate this characteristic, we apply Jain’s fairness index [11], which is normally used to evaluate the equality of resource allocation. In our case, resources refer to the domain and the number of requests from each router indicates the allocation.
ks
naver baidu google
3g inst umeng Domain (url)
fb
you animal
Figure 6: Jain’s index of the popular domains visited from all routers. Higher values indicate that the requests are more uniformly distributed over all routers.
The Jain’s index can determine whether the requests are equally generated from different sources of router. The lower the degree of fairness, the lower the number of users contributing to the domain request. Figure 6 shows the Jain’s fairness indices of the top ten popular domains. This is similar to the boxplot in Figure 5, for those domains having high number of outlier also achieve a low Jain’s index. The plot in Figure 6 clearly shows that baidu, 3g, umeng and animaljam achieve very low Jain’s indices compared to other domains. This means that there are some specific routers generating a large amount of requests. In other words, the demand of contents is interested by a small group of users. We suspect that this characteristic has relative correlation with the application behaviour. We will investigate these suspicious domains to identify the characteristics of misbehaviour. We first analyse the traffic of the online games (i.e., animaljam, umeng). Inspection of the log files reveals that most of the HTTP requests are predominantly generated from a single router. In the case of animaljam, all requests are monopolised by only one router. Specifically, not all these requests are indicative of user behaviour, since several requests are automatically generated from the application (i.e., game state synchronisation) [6]. Similarly to baidu and 3g, almost 75% of requests are generated by only two routers. In our
Another major issue we discovered is misinformed knowledge where several users misuse an application. To investigate this kind of characteristic, we consider the domain ksmobile which accounts for 13.72% of the total requests (see Figure 4a). The traffic of ksmobile is generated by an utility mobile application, namely CM Battery. In addition, our interviews reveal that almost 100% of interviewees who use android smart phones frequently use this application. The main feature of this application is to save battery power by providing a shortcut to close some items. According to the interview data, all villagers believe that this application can help to accelerate their WiFi speed. Besides, they usually share this misinformation with others, and thus this application has rapidly become popular in Thai Samakhee village. Technically, this application cannot improve the performance of WiFi connection, but in reality generates a large number of requests to a specific domain (i.e., ksmobile.com). Regarding our interviews, several advertisements are also automatically downloaded to the user’ s mobile phone when this application is used. The advertisement traffic commonly constitutes wasted bandwidth over a slow Internet link, as also reported in prior studies [8, 13].
4.4
Localised Communication
Both our measurement and interview reveal the fact that TakNet plays an important role in villagers’ daily communication. Besides the well-known Zipf distribution, users’ requests on static content exhibit strong spatial locality [4], i.e., nearby users are likely to request similar content. Herein, we seek to understand whether the rural communication also possesses similar characteristic. We focus on the Line application in our study due to its popularity in Thai Samakhee.
14 13 12 11 10 9 8 7 6 5 4 3 2 1 0
Rotuer ID
Rotuer ID
2 4 6 Time of day (second)
8 4
x 10
(a) Requests on every router over a day
14 13 12 11 10 9 8 7 6 5 4 3 2 1 3.2
Sliding window
3.21 3.22 Time of day (second)
3.23 4
x 10
(b) Capturing a pair of connection
Figure 8: Analysis of localised communication
Determining the size of the sliding window is not trivial. In order to obtain a representative estimate, we use two mobile phones to exchange messages at different vantage points, and measure the delay between the message departure and arrival. The experiments were repeated 50 times and the measured delay varies between 1s to 5s. By varying the window size from 1s to 5s, the identified pairs constitute 10% to 15% of the total number of Line messages. Although our method only provides an estimate on localised communications, the figures match surprisingly well with users’ own estimates. In our social interview, the interviewees reported that on average, 10% to 20% of the messages were sent to local contacts. Considering the small size of Thai Samakhee, our results obviously indicate the existence of spatial locality in the rural communication patterns.
4.5
Daily Variation of Content Popularity
In this section, we extend our analysis by considering domain the access pattern over time. We choose the date of 28 March 2015 as a representative day to analyse the usage pattern, since it has the highest traffic volume in our trace. Specifically, we drop all misbehaviour domains addressed in the previous section while including other two beneficial do-
mains: khaosod (a local newspaper website) and dek-d (an education website). In Figure 9, we break down the total requests of each domain over hour intervals. 200 Number of requests
Line runs a straightforward HTTP-based protocol to deliver messages among its users. Given that both the sender and receiver are located in the same village, Line protocol will create a pair of HTTP requests in our trace log which corresponds to one localised communication. To quantify the localised communications, we identify the aforementioned HTTP pairs. We first extract the HTTP requests to the domain naver from the trace logs of all routers, and sort these requests according to their timestamps. Figure 8a plots the occurrences of these HTTP requests on every router on a specific day. x-axis is the timestamps in seconds, and y-axis is the router indices. We then slide a window of a fixed interval (e.g., 5 seconds) along the time axis. Whenever two requests fall into the sliding window, they are marked as a pair, as presented in Figure 8b. It is worth noting that if two messages are sent out independently at the same time, they are still counted by our method. This will apparently overestimate local communication pairs. However, given that the absolute number of users is small in the village, the chance of such misclassification is also slim. Our experience has shown that the adopted method works quite well in practice.
dek−d
google
khaosod
fb
instagram
naver
youtube
150
100
50
0
01 02 03 04 05 06 07 08 09 10 11 12 13 14 15 16 17 18 19 20 21 22 23 24 Time of day
Figure 9: Distribution of URLs over a day
Instant messaging application and online social networks (i.e., naver, facebook and instagram) have similar patterns where the usage is spread out over a day and it is significantly used in the evening from 19.00 to 22.00. However, the usage of instant messaging is substantially higher than the usage of online social networks. The villagers also access the educational information through dek-d in the evening. Regarding our interview data, 28% of the population in Thai Samakhee village are teenagers who often access this website. The access to the local newspaper website khaosod becomes significant during the nighttime (i.e., 20.00 to 23.00) and the interviewees also confirm that they usually follow local news during this period. Google is regularly accessed at almost all times of day, since the villagers usually use Google as their first webpage. As for Youtube, the number of requests increase significantly from 20.00 to 22.00.
5.
RELATED WORK
There have been many deployments of community networks aiming at extending Internet connectivity in both urban and rural areas. Some examples of successful urban community networks include Athens Wireless Metropolitan Network4 , Freifunk5 and Funkfeur.6 These initiative projects have flourished to create wireless ad-hoc networks that cover wide areas in the city. Public Access Wifi Service (PAWS) is a UK academic project that deployed a crowdshared community network where users share a small part of their unused home broadband capacity for free to fellow citizens who are unable to afford the cost of broadband [20]; Ishmael et al. [10] deployed a community wireless mesh network in Wray, a rural village near Lancaster, UK. The Wray community is connected with the network backhaul through a long distance wireless link. Matthee et al. [17] deployed a wireless mesh network called Linknet in Macha, a rural province of Zambia, to provide Internet access with a satellite link. In our case, TakNet connects to the ADSL link which can provide more bandwidth with a cheaper subscription fee. Guifi.net7 is a large community wireless network 4 http://www.awmn.net 5 http://freifunk.net 6 http://www.funkfeuer.at 7 https://guifi.net
in a rural area of Catalonia, Spain. However, there are sufficient ADSL lines provided in that area such that the users can decide to choose the service from either a commercial ISP or free Internet with Guifi. Unlike these examples, in our case, the number of ADSL lines is very limited in Thai Samakhee. Our deployment exploits only one ADSL link and shares Internet access for the whole village. Nevertheless, rural networks typically have unique challenges and characteristics regarding their design, deployments and user behaviours comparing to developed areas [3]. Bowei et al. [8] examine the web traffic usage in Cambodia and Ghana. Their study serves as a good starting point of our work, but the investigated network was not in a wireless environment. On the other hand, the Internet usage of wireless mesh networks in rural Africa has been thoroughly investigated by [13, 15]. The analysis in [13] emphasises that traffic is mostly web based and P2P usage is relatively low compared to other urban networks. Traffic measurements and social interviews were conducted in [15] to identify specific user behaviours and network requirements. The major problem in this network is the constant stream of malware traffic leading to poor network performance, e.g., large round trip time delay. These studies provide a thorough understanding of user behaviours and Internet usage in rural community networks wherein most user terminals are PC-based machines. In our setting, 60% of the terminals in TakNet are mobile phones, and the users exhibit rather different behaviours in our network from those in prior studies. Therefore, we focussed on the analysis of the web-based services and identifying the characteristics of mobile phone users. To cope with the limited bandwidth at Internet gateways, web proxies (e.g., squid) are widely deployed in rural networks to reduce outbound traffic [8, 16, 22]. The popularity distribution of users’ requests at proxies usually follows a Zipf-like distribution [2]. However, a Zipf-like popularity distribution does not indicate that it is trivial to identify the actually valuable content for end users. Because nowadays the Internet is overwhelmed by various malicious traffic from botnets, advertisements, and malware [9, 12] that dramatically distorts the content popularity originating from pure human behaviours. Another characteristic of community networks relates to network locality (or spatial locality), where users who are geographically close are more likely to interact with each other. Wittie et al. [23] investigate the spatial locality of online social networks and highlight that most interactions happen among users residing within a relatively small geographical region. Their work examines the network locality in a large geographical area (e.g., country level). The micro level network-locality is examined in [16] where a time-delayed proxy is deployed to investigate Facebook photo sharing in rural Africa village. Their findings show that 24% of photo views originate from local users. Johnson et al. [14] also analyse the locality of Facebook messaging in the same network and reveal that more than half of the messages are delivered among local users.
6.
DISCUSSION
TakNet is arguably the first rural CWMN deployed in Thailand. The pioneer works presented in Section 5 have provided useful inputs to our work, especially in the early stage when we were planning and designing TakNet. From our invaluable firsthand experience in deploying and maintaining TakNet, we highlight the following rules of thumb as suggestions for future network designers in rural areas. TakNet is a successful project in terms of its impacts and improvements to people’s lives in Thai Samakhee. After deploying TakNet for two years, it was successful creating a demand within the community for broadband Internet access. This motivated the service provider to expand more backhaul infrastructure to cover the area of Thai Samakhee and nearby villages. The key factor of TakNet is attributed to its sustainable model: (1) the system and technology must be simple enough for local technicians to handle; (2) the cost must be low enough so that the amortised expenditure is acceptable even with a low average wage; (3) for longer term sustainability, involvement of local business and local communities should be sought whenever possible. Technically, TakNet is a stable system and provides rather reliable service to the users in its two-year running time. Any severe system failures are due to the power cuts in the village (once every 3 or 4 months). Most glitches are actually caused by our users who intentionally turn off the routers due to their concerns about their electricity bill. This indicates that in a rural setting, instability is often manually introduced into the system. This further requires the network to be self-adaptive to accommodate itself to such dynamics, i.e., topology changes, route updates. As of this writing, TakNet can still provide enough bandwidth to its users. However, the stable growth in bandwidth consumption does not seem to cease. The available 4Mbps bandwidth may be saturated soon in the near future. Our interview shows that purchasing a better (but more expensive) subscription to get around the bandwidth issue may force many users to withdraw from the TakNet community due to the extra cost. Users in rural areas are very sensitive to many variables (e.g., technical barriers, cost), which re-emphasises the importance of a sustainable model. The measurements on TakNet reveal that there may not be a universal user model for all rural settings. The selection of the equipment is determined by the local market, the users’ behaviours are influenced by the local socioeconomic conditions. For example, the dual-peak traffic pattern is common in Asia [8] while the single-peak pattern dominates Africa [8, 15] and Europe [20]. The localised communication is more significant in African villages [14], i.e., 50% in contrast to 10% to 20% in our study. OSNs and email are popular in the African rural areas, whereas the instant messaging service seems always the first choice for the users in Asian villages, which may be partially explained by our study showing most terminals are mobile phones. All these differences remind our system designers of the diversity of various rural settings, the characteristics of local communities need to be
carefully taken into account in the design and exploited to improve the system. TakNet is IP-based and uses off-the-shelf devices. However, this does not mean that we cannot introduce new technologies into the system. User behaviours should be well exploited to improve the system performance. For example, with the strong regularity in both the request and traffic patterns, prefetching remote content during the off-peak hours can significantly reduce latency and competition for bandwidth. Service caching [21] can benefit localised communications by ameliorating connectivity and latency issues. Furthermore, different user groups exhibit distinct behaviours in TakNet. To achieve even better performance, the caching component in the system can be tailored to incorporate more contextual variables such as time, group type, user location and activities. Nonetheless, as the other side of the coin, we need to bear in mind that new technologies may potentially pose the deployment and maintenance challenges for local technicians. All in all, there is still a lot of room to improve TakNet, but the pros and cons of new technologies should be well balanced before introducing them into the system.
7.
CONCLUSION
In this paper, we share our experiences in deploying TakNet, a rural community network in Thailand. Both technical and social constraints are revealed through data analysis of the traffic measurements as well as the qualitative social interviews. Our study discovers several particular characteristics of Internet usage in a rural community. Example of our more interesting findings include: the dual-peak traffic pattern that presents an opportunity to optimise the bandwidth usage; instant messaging is the dominant service over OSNs and email services; a strong spatial locality with approximately 10% – 20% of messages exchanged between local users. Furthermore, our analysis of suspicious domains can classify and filter out the application behaviours from the collective content popularity. As a result, the distribution follows a Zipf model with a more realistic α value (1.05). The strong diurnal pattern as well as the spatial locality offer us an opportunity to improve the network performance by incorporating both proactive and passive caching in the system. User behaviours should be well exploited to identify the contextual variables. Besides, the novel service caching is also useful to support the localised communication. These directions of research will be investigated in our future work.
8.
ACKNOWLEDGMENTS
TakNet was achieved thanks to sponsorship from THNIC Foundation. Part of this work was also supported by EU H2020 UMobile Project (Grant agreement no: 645124).
9.
REFERENCES
[1] Thailand Internet User Profile, Ministry of ICT, Thailand. Technical report, 2014. [2] L. Breslau, et al. Web caching and zipf-like distributions: evidence and implications. In INFOCOM, Mar 1999. [3] E. Brewer, et al. The challenges of technology research for developing regions. Pervasive Computing, IEEE, 2006.
[4] A. Dabirmoghaddam, et al. Understanding Optimal Caching and Opportunistic Caching at “The Edge” of Information-Centric Networks In ACM ICN, 2014 [5] M. Cha, et al. I tube, you tube, everybody tubes: Analyzing the world’s largest user generated content video system. In ACM IMC, 2007. [6] T. T. Chen. Online games: Research perspective and framework. In Comput. Entertain., Feb. 2015. [7] T. Clausen, et al. Optimized link state routing protocol (OLSR). RFC 3626, Oct. 2003. [8] B. Du, et al. Analysis of www traffic in cambodia and ghana. In WWW ’06. ACM, 2006. [9] G. Gu, et al. Botminer: Clustering analysis of network traffic for protocol- and structure-independent botnet detection. In USENIX Security Symposium, 2008. [10] J. Ishmael, et al. Deploying rural community wireless mesh networks. Internet Computing, IEEE, 2008. [11] R. K. Jain, et al. A quantitative measure of fairness and discrimination for resource allocation in shared computer system. Technical Report, Eastern Research Lab, 1984. [12] C. W. Jan Goebel, et al. Measurement and analysis of autonomous spreading malware in a university environment. In Detection of Intrusions and Malware, and Vulnerability Assessment. Springer, 2007. [13] D. L. Johnson, et al. Internet usage and performance analysis of a rural wireless network in macha, zambia. In ACM NSDR, 2010. [14] D. L. Johnson, et al. Network traffic locality in a rural african village. In ICTD. ACM, 2012. [15] D. L. Johnson, et al. Traffic characterization and internet usage in rural africa. In WWW. ACM, 2011. [16] D. L. Johnson, et al. Villageshare: Facilitating content generation and sharing in rural networks. In ACM DEV, 2012. [17] K. Matthee, et al. Bringing internet connectivity to rural zambia using a collaborative approach. In ICTD, 2007. [18] M. Rabinovich, et al. Web Caching and Replication Addison-Wesley Longman Publishing Co., Inc., USA, 2002. [19] D. Rossi, et al. Caching performance of content centric networks under multi-path routing (and more) Technical report, Telecom ParisTech, 2011. [20] A. Sathiaseelan, et al. A feasibility study of an in-the-wild experimental public access wifi network. In ACMDEV, 2014. [21] A. Sathiaseelan, et al. Scandex: Service centric networking for challenged decentralised networks. In DIY, 2015. [22] W. W. Vithanage, et al. Bassa: A time shifted web caching system for developing regions. In ACM NSDR, 2011. [23] M. P. Wittie, et al. Exploiting locality of interest in online social networks. In CoNEXT, 2010.