Understanding Online Social Network Usage from a Network Perspective Fabian Schneider
Anja Feldmann
Balachander Krishnamurthy
Walter Willinger
TU Berlin / T-Labs
[email protected]
TU Berlin / T-Labs
[email protected]
AT&T Labs - Research
[email protected]
AT&T Labs - Research
[email protected]
ABSTRACT Online Social Networks (OSNs) have already attracted more than half a billion users. However, our understanding of which OSN features attract and keep the attention of these users is poor. Studies thus far have relied on surveys or interviews of OSN users or focused on static properties, e. g., the friendship graph, gathered via sampled crawls. In this paper, we study how users actually interact with OSNs by extracting clickstreams from passively monitored network traffic. Our characterization of user interactions within the OSN for four different OSNs (Facebook, LinkedIn, Hi5, and StudiVZ) focuses on feature popularity, session characteristics, and the dynamics within OSN sessions. We find, for example, that users commonly spend more than half an hour interacting with the OSNs while the byte contributions per OSN session are relatively small.
Categories and Subject Descriptors C.2.2 [Computer-communication networks]: Network protocols—Applications; C.2.3 [Computer-communication networks]: Network operations—Network monitoring
General Terms Measurement, Performance
Keywords Clickstream analysis, HTTP, Online social networks, Feature popularity, Network measurement, Session characteristics, User interactions
1.
INTRODUCTION
Online Social Networks (OSNs) such as Facebook, MySpace, LinkedIn, Hi5, and StudiVZ, have become popular within the last few years. OSNs form online communities among people with common interests, activities, backgrounds, and/or friendships. Most OSNs are Web-based and allow users to upload profiles (text, images, and video) and interact with others in numerous ways. The contemporaneous rise of Web 2.0 technology and user-generated
Permission to make digital or hard copies of all or part of this work for personal or classroom use is granted without fee provided that copies are not made or distributed for profit or commercial advantage and that copies bear this notice and the full citation on the first page. To copy otherwise, to republish, to post on servers or to redistribute to lists, requires prior specific permission and/or a fee. IMC’09, November 4–6, 2009, Chicago, Illinois, USA. Copyright 2009 ACM 978-1-60558-770-7/09/11 ...$10.00.
content has resulted in over half a billion users being present on the OSN ecosystem. Facebook alone adds over 377,000 users every twenty-four hours and is expected to overtake MySpace in the total number of users in 2009 [2]. This sheer number of users makes OSN usage interesting for different entities: (i) ISPs have to transport the data back and forth and provide the connectivity, (ii) OSN service providers need to develop and operate scalable systems, and (iii) researchers and developers have to identify trends and suggest improvements or new designs. The questions this paper aims at answering therefore include Which features of OSNs are popular and capture the users attention?, What is the impact of OSNs on the network?, What needs to be considered when designing future OSNs?, Is the user’s behavior homogeneous? A recent study exploring the properties of OSNs worth examining and present methodologies available, discusses various challenges associated with measuring them [19]. Earlier work studied the graph properties of the online communities, high level properties of snapshots of individual OSNs, and issues related to anonymization and privacy. However, they can only capture the state of an OSN as inferred by some specific measurement technique, e. g., crawling. Furthermore, there are no known studies which document how users interact with various OSNs beyond those that rely on surveys [1, 10, 35] and interviews [17]. Moreover, such techniques are limited in scope and cannot capture OSN macro-level properties such as overall volume of traffic, its dynamics, etc. or micro-level properties such as what happens within an OSN when users interact with it. To analyze such properties one has to capture the interactions of the user with the OSN over time which is impossible via crawling. This paper focuses exclusively on these understudied properties by examining actual user clickstreams. We extract clickstreams from several anonymized HTTP header traces1 from large user populations collected at different vantage points within large ISPs across two continents. We focus on OSNs whose primary content are user maintained profiles. We chose Facebook, LinkedIn, Hi5, and StudiVZ [12, 24, 16, 34] because they are popular, well known, and well represented in our traces. We present a methodology that allows us to reverse engineer user interactions with OSNs from network traces. Unfortunately, currently available clickstream data sets are very limited. In principle, there are three ways of gathering such data, either on the server, on the client side, or at a proxy/aggregator. As server-side data is considered proprietary, datasets are limited. For search engines there are some examples [31, 32, 33]. How1 All IP addresses are anonymized and HTTP content is excluded. Furthermore, we apply anonymization to any other field that has the potential to contain user related data before processing the data.
ever, none of the server-side data sets can include the full clickstream as the full clickstream consists of all user accesses to all Web pages related to the OSN or the search query. Previous work based on client-side data gathering has focused on Web search clickstreams [18] or on asking volunteers to interact with the OSN [17]. Other approaches include surfing the Web using additional browser plug-ins, e. g., [41], or enhancing HTTP proxies with extended logging functionality, e. g., [3]. However, ISPs servicing residential customers do not necessarily use proxies nor do volunteer interactions with an OSN necessarily correspond to their natural behavior. Recently, Benevenuto et al. [5] have analyzed clickstream data from a Brazilian social network aggregator. Using our methodology we are able to track the beginning and ending of a user’s interaction with an OSN as well as various intraOSN actions performed by the user. We apply this methodology to each of the four selected OSNs and validate the results using traces of manual interactions with these OSNs. We present results on feature popularity within OSNs, OSN session characteristics, and on dynamics within sessions. For example: • We find that users commonly spend more than half an hour interacting with the OSNs. For Facebook users, we verified that while users interact with the OSN, only a minority of them accesses any non-Facebook sites. • While we selected OSNs based on the criterion that they feature profiles, profiles are only the most popular feature within LinkedIn and StudiVZ. Within Facebook and Hi5 profiles are among the popular features besides downloading photos and exchanging messages. In addition, the most popular features in terms of clicks usually do not contribute the most to the traffic volume. With regards to volume, photos play a major role, especially with regards to uplink bandwidth. • We find that the number of accesses to profiles within the session is highly skewed. While there are some sessions with many accesses (> 100) most users only access a handful. Indeed, in terms of unique profiles the number is even lower. This indicates that the richness of the friendship graph is not a good indicator on how many profiles will actually be accessed during a session. This results in an in-depth understanding of what happens within an OSN and also allows us to look for similarity across OSNs. Our work complements the efforts of the OSN community towards a better understanding of how OSNs are used. Service providers benefit by knowing OSN features that are of significant interest to own users and by understanding what else on the Web is important to their users. This allows them to influence and improve their own service offerings. Researchers can propose improvements or simplifications for existing OSNs or design OSNs with novel features. From an ISP viewpoint OSNs currently contribute a lot less than peer-to-peer applications in terms of bytes. However, OSNs might add features that increase the per-user bandwidth demand. Given this potential for traffic explosion (e. g., when video becomes popular within OSNs), it is imperative to understand the network-level dynamics of OSNs. The remainder of this paper is structured as follows: In Section 2 we give an overview of OSN features and introduce our terminology. After giving a description of the data sets we use in Section 3, we discuss our analysis methodology, Section 4. We then present the results of our macro analysis with regards to feature popularity analysis in Section 5, and session characteristics in Section 6, followed by our micro-level analysis regarding the dynamics within
OSN sessions in Section 7. Finally, after reviewing related work in Section 8, we summarize our experience and suggest future research directions in Section 9.
2. OSN FEATURES AND TERMINOLOGY Before delving into the user session and clickstream analysis we introduce the terminology we use in the rest of the paper by discussing which features OSNs offer and how a sample OSN session is seen from a network perspective.
2.1 OSN features Most OSNs include features for creating user accounts and authenticating users. A user’s basic profile includes entries for age or home town. OSNs offer a variety of different features that are commonly accessible only to those users that are logged in. Users can update their profiles (contact information, photographs, information about hobbies, books, movies, music, etc.), browse other users’ profiles by searching and subsequently obtaining lists of their friends and narrowing them via categories like schools or work sites. They can add friends, invite new friends, join groups or networks, communicate with other users via OSN-internal email services, writing on other users’ “walls” or on discussion forums, and adjust their privacy settings. Several OSNs offer a platform to build third-party applications; these are hosted on external servers by the individual application writers and allow OSN users to exploit the social graph and download and interact with each other through the application. Popular applications are of the social utility variety (e. g., dating) or games. There are also several applications that are internal to the OSN. We do not explore specific application features in this paper.
2.2 A “sample” Facebook session Next, we show how a sample OSN session is seen from a network perspective. Users must login before accessing any Facebook feature and this starts the OSN session; after logging in the user is authenticated. At the end of the session a logout results in the user becoming offline. The time between login and logout is an authenticated OSN session, while the time before logging in and after logging out is an offline OSN session. A subsequent logging in ends the current offline OSN session and starts another authenticated OSN session. The overall time from a first contact of the OSN site or a logout to another logout is an OSN subsession. Once authenticated, a user starts using the Facebook features— we label these as actions or clicks. Our sample OSN session (shown in Table 1) has six actions (a)–(f); each of which corresponds to a user click. We group actions into categories—e. g., the category “photos” includes managing, uploading, displaying, commenting on, etc. of photos. Such interactions result in multiple HTTP request response pairs (rr-pairs) seen on the network. Table 1 lists all rr-pairs to www.facebook.com. OSNs sometimes use HTTPS, HTTP over SSL, rather than HTTP for rr-pairs carrying account credentials or CAPTCHAs. For example Facebook uses HTTPS for the login action—rr-pair 2 in Table 1. These are not easily observable and thus a HTTP rr-pair only log does not include this request due to the SSL encryption. But, we do observe traffic over a HTTPS connection at time 29.121. Not all actions correspond to a single rr-pair. For example, the “open friend list” action generates rr-pairs 4–6. Rr-pair 4 is directly triggered by the user’s mouse click while rr-pairs 5 and 6 are generated by Facebook’s AJAX-based user interface. We call the first kind of rr-pairs active and the others indirect. The indirect requests also include requests for loading embedded images, JavaScript snippets, etc. (not shown in Table 1). An action refers
Table 1: Facebook interaction example: action and rr-pairs of the requests to the hostname www.facebook.com Time [sec] 0.000 9.944 27.696 29.121 31.012 45.513 47.631 48.672 48.675 56.441 59.199 95.921 97.947 102.841 105.029 105.341
Action/Click No. Proto Method URI a) open www.facebook.com 1 HTTP GET / b) login, enter password 2 HTTPS POST /login.php? 3 HTTP GET /home.php? c) open friend list 4 HTTP GET /friends/?ref=tn&quickling[version]=141637;0&_ecdc=check 5 HTTP GET /friends/ajax/friends.php?membership=1&_ecdc=check 6 HTTP GET /friends/ajax/filters.php?id=XXX&_ecdc=check d) select profile of a friend 7 HTTP GET /profile.php?id=XXX&quickling[version]=141637;0&_ecdc=check e) write “posted something on the wall” on friends wall 8 HTTP POST /ajax/profile/composer.php?_ecdc=false f) logout 8 HTTP GET /logout.php?h=c909dd2db7b0a83b238ea70321d2041b&ref=mb 9 HTTP GET /index.php?lh=c909dd2db7b0a83b238ea70321d2041b&
Table 2: Overview of anonymized HTTP header traces. ID A1 A2 A3 B1 B2 B3
start date 22 Aug’08 noon 18 Sep’08 4am 01 Apr’09 2am 21 Feb’08 7pm 14 Jun’08 8pm 23 Jun’08 10am
dur 24h 48h 24h 25h 38h >7d
sites all all all OSNs OSNs OSNs
size >5 TB >10 TB >6 TB >15 GB >50 GB >110 GB
rr-pairs >80 M >200 M >170 M >2 M >3 M >7 M
to the active and its associated indirect requests. Therefore, the number of bytes in an action is the sum of bytes of all its requests. Indirect requests are not limited to the main domain www. facebook.com. They can also be directed to other locations, e. g., Facebook utilizes a CDN; most Facebook images are retrieved from static.ak.fbcdn.net. In addition, Facebook pushes information to their users via the servers channel.[a-Z0-9]*. facebook.com. Table 1 shows that we can in principle identify OSN sessions and the associated clickstream from a network perspective by passively monitoring the rr-pairs.
3.
DATA
In this section we describe the anonymized data sets gathered at different vantage points representing actions of tens of thousands of OSN users within two large international ISPs. We focus on OSNs that allow users to maintain profiles and have different communication mechanisms with Facebook as an obvious candidate. Hi5 and LinkedIn are also popular in the U. S. StudiVZ is the most popular OSN in Germany after YouTube (which focuses primarily on video and has limited internal communication mechanisms) and Facebook. We thus chose these four OSNs to study. Accordingly, the sites monitored for the OSNs were: facebook.com, thefacebook.com, fbcdn.net, fbcdn.com (Facebook), hi5. com, hi5modules.com, hi5networks.com (Hi5), linkedin.com, lmodules.com, linkedinlabs.com, linkedin.custhelp.com (LinkedIn), and studivz.net, studivz.de, studivz.ivwbox. de, imagevz.net (StudiVZ). We had access to multiple sets of anonymized HTTP header traces (see Table 2) from two commercial ISPs, ISP-A (traces A1, A2, and A3) and ISP-B (traces B1, B2, B3). Each site connects
more than 20, 000 DSL users to the Internet via at least a 1 Gbps uplink. The monitoring infrastructure uses Endace DAG network monitoring cards [36] for traffic capture. The data anonymization and HTTP header extraction is performed immediately on the secured measurement infrastructure via the HTTP analyzer of the Bro IDS [30]. While some traces include all rr-pairs some only include rr-pairs to the OSN sites (see Table 2). To resolve the sites to appropriate IP addresses we did DNS resolutions at multiple vantage points to exclude biases due to DNS load balancing or traffic flow optimizations. Unfortunately, this restriction to OSN sites means that we do not have HTTPS flow data available for some of these traces. To compute the HTTPS flow records we use custom software with a 15 second inactivity timeout. Table 2 gives an overview of the data traces including when they were gathered (local time zone, all in 2008/09) and approximate numbers on their overall size before HTTP header extraction and the number of rr-pairs that they contain. In general, we observe that only a subset of the 20, 000 DSL users actually use any OSN during the trace collection period. Overall we identified roughly 2500 (6000) users at ISP-A (ISP-B) who use any of the OSNs under study. We observed significant activity for Facebook and StudiVZ in ISP-A and Facebook, Hi5, and LinkedIn in ISP-B—well beyond 1000 users and 100, 000 rr-pairs. As we cannot show all plots for all traces we pick representative plots for presentation—usually either from trace A2 or B3 as these are the ones with the largest number of rr-pairs. Unless stated differently, similarities and differences between OSNs for one trace are also observable in other traces from that ISP.
4. APPROACH To understand how users interact with OSNs, we extract OSN clickstreams from various anonymized HTTP header traces (see Section 3). From this main data source we identify: OSN session clickstreams for the subset of users who interact with an OSN under study (Both ISPs). All HTTP request/response pairs for all users who interact with any Web server (ISP-A only). Standard browsers, proxies, or social network providers cannot provide us with this kind of data. After a short summary we present our general analysis methodology and its validation in more detail.
In summary, our methodology relies on identifying those HTTP request response pairs (rr-pairs) that are part of an OSN session and then grouping them into sessions utilizing the OSN session cookies. Within a session, we separate the time that a user is actually authenticated (online) from the period he is offline. Next, we separate direct user actions, called active rr-pairs, from follow-up requests, called indirect rr-pairs. Finally, we associate a category, e. g., photo, profile, or home, with each rr-pair. To cross check our methodology we rely on a set of manual traces. The manual traces include both, the action that the user performed on the OSN site and the resulting rr-pairs. Therefore, the manual traces serve as ground truth for the validation of our methodology.
4.1 Methodology After using the typical tricks to extract clickstreams [18], e. g., the HTTP analyzer of the Bro IDS [30], we need to group the clicks into OSN sessions and identify which of the OSN features are actually used. In principle, the approach outlined below can be used for any web-based service that requires login and offers multiple different features. However, understanding how users interact with the OSN is of particular interest due to their popularity, their diversity, their complexity, and their continual evolution. Indeed, as an OSN becomes more popular it get closer to certain scalability limits of different parts of the Web service infrastructure. As such, some OSNs delegate static content not only to separate servers but to separate domains while others rely on CDNs to increase scalability. Moreover, due to changes in feature sets they may restructure their software interface, e. g., as Facebook did in early September 2008 [11]. Therefore, the analysis software needs to be easily customizable and highly flexible.
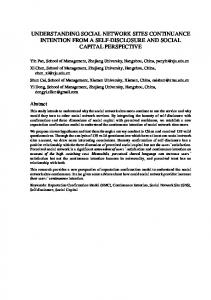
OSN session handling Web-based service sessions are much more complex than the simple one outlined in Table 1: Sessions from different users overlap, users may utilize multiple OSN sessions in parallel with different user names, users may not logout at the end of a session, or the trace may start in the middle of an OSN session, etc. We next address how we identify an OSN session. Since OSNs require login they must track their users via the appropriate HTTP mechanism: Cookies. They can be set via standard SET-COOKIE HTTP response headers and then the client returns the cookie in subsequent HTTP requests via the COOKIE request header. OSNs typically rely on a session cookie which is assigned at the start of the first OSN session. Even if it is changed during the session we can track such changes. In some OSNs, these cookies even persist if the user logs back in after a logout. We can thus group rr-pairs by the anonymized IP address and the anonymized session cookie. However, OSNs are not standardized. Hence, each of them uses different kinds of cookies. Most OSNs use separate cookies in addition to the session cookie to refer to the OSN user and their login, typically an email address. We refer to these as user cookie and login cookie. Within such a group of rr-pairs we have to identify logins and logouts to distinguish authenticated and offline periods in a session. We refer to this process as state handling. Most OSNs appear to use separate scripts for handling login and logout; these update the user and the login cookies. For sessions that start and end in the middle of our traces we can identify a login/logout process by looking for the specific URI (e. g., Facebook logout URI is /logout.php?). Some OSNs, including Facebook, LinkedIn, and StudiVZ, use HTTPS (see Table 3) instead of HTTP for these scripts. The remainder of the OSN session is typically not encrypted. Thus, we augment our
new session cookie || new IP
user/login cookie present State: undef
logout detected
State: authenticated login detected
State: offline
relogin detected
Figure 1: State handling diagram for OSN sessions. anonymized HTTP header traces with flow traces2 of HTTPS activity on port 443. Note, after login and logout, users are usually redirected to a welcome/goodbye page. By checking for the specific URIs of these pages in combination with prior HTTPS activity we can identify such logins/logouts. For sessions that start before the beginning of the network-based observation we can check if they are authenticated or offline by looking for the presence of the user/login cookie in the HTTP headers. If they are present the session is authenticated, else offline. For sessions where no logout was detected within the network-based observation we have no way to infer their ultimate duration; thus we assume that they ended with the last observed request. For these sessions we underestimate their durations and volume. Given the fact that we do not have HTTPS data for ISP-B and the smaller user count for LinkedIn and Hi5, we only have reportable login/logout data on ISP-A for Facebook and StudiVZ: For StudiVZ, we hardly observe any sessions that are missing the login, due to automated logout after an idle timeout. However, we observe sessions that do miss their logout. The numbers for StudiVZ and Facebook are in the same order of magnitude, and around 13–19 %. For Facebook, we find that 7–8 % of the authenticated sessions are missing both, login and logout, while 10–15 % are missing only their login. The principle state handling is shown in Figure 1.
Rr-pairs classification Table 1 underscores our experience that it is possible to infer the OSN feature (action) associated with each rr-pair by inspecting the URI. This is true for all active rr-pairs and we built suitable patterns. Classification of rr-pairs is complex due to embedded objects and rather than finding patterns for all, we use the HTTP REFERER header if set. These requests all include an active rr-pair in their referrer chain. However, not all rr-pairs include the OSN session cookie or a referrer; especially in requests to sites that are hosting static helper objects and scripts. We associate these with the last active rr-pair. This approach can lead to misclassification if the same IP address is involved in multiple parallel OSN sessions. However, if there are multiple concurrent ongoing sessions the likelihood that another user issues a request while the first user is still retrieving all embedded objects is low. If we are unable to find an action for an rr-pair, it is classified as UNKNOWN.
OSN specifics The OSN-specific parts include a combination of relatively simple pieces (e. g., identifying the OSN sites and cookies) and some more complex classifications of the rr-pairs (e. g., profile analysis, specific login and logout determination). Section 3 lists the OSNspecific sites while Table 3 lists the specific cookie names that we use for each of the four OSNs. 2 A flow summarizes a stream of packets that are selected by some criteria such that the time between packets of a flow never exceeds a specific timeout value. Our criterion is the five-tuple consisting of anonymized IP addresses, transport protocol, and port numbers. We use a timeout value of 15 seconds.
Table 3: OSN specific information: cookies and login/logout procedure. OSN Facebook Hi5 LinkedIn StudiVZ
session cookie datr= JSESSIONID= bcookie= PHPSESSID=
user cookie cuser= Userid= leo_authi_token=LIM: UserID1=
login cookie login_x= Email= n/a n/a
login HTTPS ✔ ✘ ✔ ✔
logout HTTPS ✘ ✘ ✔ ✘
Table 4: Examples of OSN specific patterns for the classification of home and sending a message. OSN Facebook Hi5 LinkedIn StudiVZ Facebook Hi5 LinkedIn StudiVZ
category home home home home messaging messaging messaging messaging
action index home home start send message send message send message send message
method GET GET GET GET POST POST POST POST
The first step in the rr-pair classification is to determine if it is hosted on the main site. The next step is to determine if a rr-pair is active or indirect. Most requests not on the main site are indirect. However, not all other requests are active. For example, requests triggered automatically by AJAX should not be classified as active. To identify those, we use the manual traces (see Sec. 4.2) to develop specific patterns. For Facebook we initially consider all URIs with the following patterns as active: .*\.php.*, .*/\$, .*/\?.*. We then use specific patterns to exclude some URIs, e. g., ^/js_strings.php, which enables word completion for input fields. We again rely on pattern matching to identify the action/click that caused the active rr-pair via a configuration file which lists the OSN-specific patterns. Table 4 gives example patterns for all OSNs. At this point we have identified an action for each rr-pair. However, given that the number of actions is of the order of 200– 300, we group actions into categories. We distinguish between the following categories: profile, photos, friends, home, offline, apps, messaging, search, video, groups, advertisement, osnspecific, other, and UNKNOWN. While most of these are obvious, note that home includes the login and logout rr-pairs, and osnspecific actions are, e. g., notes for Facebook and account migration for StudiVZ. Whenever the category of an active rr-pair is profile, we extract further details on profile accesses. Specifically, we count how often a user accesses his own profile, the profile of another user, and of how many other users. To account for changes in the OSN architecture we distinguish between actions that have been verified via a manual trace and rr-pairs for which the category is guessed given the knowledge about the structure of the OSN site and the URI.
4.2 Customization and validation approach We need to be able to customize our approach to a set of specific OSNs and validate it. Therefore, we create manual traces for which we know the ground truth—by recording the actions while passively monitoring our interactions with the specific OSN. When collecting the manual traces we make a good faith effort to explore the feature set of the OSN that users might execute. Manual traces enable us to identify the site names that belong to an OSN such that we can narrow our trace collection process to the relevant subset of traffic. We can also identify the various cookies that are used to track user sessions by the OSN, check if
pattern ^\/index\.php(\?(.*))*$ ^\/friend\/displayHomePage\.do$ ^\/home(\?*(.*))$ ^\/Start(.*)$ ^\/inbox\/(\?*(.*))$ ^\/friend\/mail\/sendMail\.do$ ^\/msgToConns(\?*(.*))$ ^\/Messages\/WriteMessage(.*)$ Table 5: Overview of manual traces. OSN Facebook Hi5 LinkedIn StudiVZ
traces 11 6 8 11
size 32 MB 50 MB 106 MB 27 MB
actions 344 368 411 354
rr-pairs 5036 4413 6363 3990
the OSN uses HTTPS for login/logout and identify corresponding handshakes for the state management, and construct the signatures and patterns to identify active rr-pairs that correspond to the user actions within the OSN. Manual traces also help in validating our approach. We claim to successfully characterize a new OSN only when the analysis script can correctly identify the authenticated/offline OSN sessions and classify the active rr-pairs according to the user actions in manual traces. OSNs may reorganize their script architecture during our analysis. This may require readjusting the rr-pair classification patterns and new manual traces. The different manual traces were collected via tcpdump on our local machine for each OSN. These included a trace that covered login, some basic actions, and logout (Section 2.2 discusses an example trace), one that covered all the actions offered via the initial menu, including profile, search, messaging, photos, . . . ., one that covers changing a user’s global and privacy settings, one that registers a new user, and a trace that has a long break of over half an hour between basic actions. Finally, we included a trace that tests the state handling by including multiple login/logout steps; we used multiple browser windows and/or multiple browser instances in parallel to simulate activity of two different users from the same IP address. Table 5 summarizes these manual traces. Typically, our manual traces cover roughly 95 % of the actions recorded in the traces, see Section 5.2.
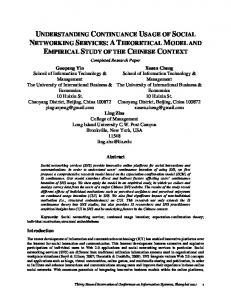
4.3 Validation For our manual traces, we know exactly what and how many actions were performed in a session. Knowing this ground truth we applied our methodology to the manual traces; Figure 2 shows the inferred OSN usage for Facebook as a stacked barplot. For each category, we distinguish between verified and guessed requests and within each class of requests between active and indirect.
30.4 %
0.6 % other
UNKNOWN 0 %
2.3 %
1.4 %
advertisement
videos
2.3 % groups
3.6 %
3.4 %
search
osnspecific
3.6 % photos
6.6 % offline
3.6 %
13.4 % friends
messaging
home
profile
apps
19.1 %
9.6 %
30 25 20 15 10 5 0
Percentage of RR−Pairs [%]
indirect − guessed active − guessed indirect − verified active − verified
Figure 2: Histogram of categories for manual Facebook traces.
We observe a perfect agreement between the ground truth and our reverse-engineered user actions and their groupings into categories. In particular, Figure 2 shows that we have no rr-pairs in the category UNKNOWN. Also, there are no rr-pairs in either of the two subclasses “active–guessed” or “indirect–guessed”. As such, although these classes are shown in the legend they do not show up in the stacked barplot. The plot shows a large number of indirect requests. This is not surprising given the large number of embedded rr-pairs. When monitoring actual user behavior, we can expect to see less of these indirect requests because they can be cached and users, contrary to us, usually do not flush their browser cache before visiting an OSN. Manual inspection of the traces confirmed that all rr-pairs are correctly assigned to the appropriate category. The same findings (not shown) hold for the manual traces from Hi5, LinkedIn, and StudiVZ. However, some Web pages, e. g., updatestatus.php are used as both: active and indirect. That is why, some requests that are active are classified as indirect and the other way around. Since there are only a handful of these we are able to correctly identify 98 % of the requests as active or indirect.
• The number of patterns (see Table 4) needed for each OSN is relatively large. All in all, we have 253, 218, 206, and 299 patterns for Facebook, Hi5, LinkedIn, and StudiVZ, respectively. However, even if an OSN restructures its Web site they usually do so in small steps. For example, the reorganization of Facebook in 2008 only added around 50 patterns. • If an OSN restructures its service the patterns have to be updated. Detection is via the drastic increase in the number of UNKNOWNs. This can be reduced by capturing new manual traces and then updating the patterns. For the Facebook update this only took about 1 hour as there were no major changes to the session handling which would have required collecting more complicated manual traces. • Analyzing data from multiple ISPs, each with their own security mechanisms in place, requires careful synchronization of the analysis software to ensure comparability of the results. • Given our experiences with OSNs it should in principle be possible to adjust the methodology to other WEB 2.0 sites. However, it is not possible to do the same kind of analysis for online shopping sites as these most likely use HTTPS rather than HTTP. • The Tamper Data plug-in for Firefox turned out to be very useful to understand how an OSN is handling its sessions as it is able to display all requests while browsing even those sent via HTTPS.
5. FEATURE POPULARITY A typical question that is of interest to both, OSN providers as well as ISPs, is which OSN features are so fascinating to the users that they spend so much time on the site. Does it differ across OSNs? In addition, both are interested in popularity shifts among features, e. g., from photos to videos, or the impact of novel features, e. g., live streaming. The ISP needs to care as it might impact bandwidth demand and the OSN needs to care as it might impact server resources. Therefore, we now explore the popularity of different features provided and supported by the different OSNs.
4.4 Lessons learned
5.1 Clicks/active requests
Starting from passive measurements it is possible to extract user clickstreams. However, we learned several lessons along the way:
Figures 3(a) and 3(b) show the histograms of the distribution of active rr-pairs (clicks) according to categories for Facebook for A2 and B3. We observe that the popularity of features differs by location. Within ISP-B, custom applications (apps) are more popular than within ISP-A, but the opposite is true for the profile category. This is consistent across the traces for the two ISPs. At the same time, we also note strong similarities: Messaging, home, profile, and photos are crucial categories at both locations. Comparing this with the relative popularity of features within Hi5 for trace B3 (see Figure 3(c)), we see that for Hi5 users photos are more important. Similar observations hold for all traces at both ISPs. In addition, the profiles together with friends play a role in Hi5. Surprisingly, even though we selected OSNs whose primary content are user maintained profiles, the Facebook and Hi5 users’ main interests are not on profiles as highlighted by their clickstream, which are spread among messaging, apps, photos, and eventually profiles. While StudiVZ tried to clone Facebook, its users do use different features (plot not shown). Here, profile is the most common category in all ISP-A traces with more than 25 % of the active rrpairs within A2. This is followed by home with 18 % and then by friends with 15 %. Within LinkedIn the focus on profiles and
• Reverse-engineering user interactions with OSNs from HTTP traces is non-trivial: OSNs differ in their software architectures, and the use of Web 2.0 features complicates matters significantly due to short and multiple interactions that differ qualitatively and quantitatively from “normal” Web traffic. • We started the adaptation of our methodology with Facebook and then added LinkedIn and StudiVZ. Finally, we extended the capabilities to Hi5. With each step the required customization time decreased since we were able to better isolate the OSN-specific elements. By now the major bottleneck is gathering the manual traces for validation (3–6 hours), the adjustment of the cookie and session handling including validation (2–4 hours), and the classification of the rr-pairs according to their features (2–6 hours depending on the feature richness and how intuitive the Web site is organized). Note, that this is a one-time cost per OSN.
5.4 Differences between users So far, we have only considered how the overall user population of an OSN behaves. Next, we ask if users of a given OSN behave in a similar manner or if some users only use one or two of the
advertisement0.1 %
0.4 %
0.4 % other
videos
1.2 % osnspecific
UNKNOWN 0.9 %
1.5 % groups
4.7 %
2.7 % search
friends
8.5 %
5.8 %
photos
offline
8.9 % apps
home
messaging
profile
22.7 %
19.4 %
22.9 %
40 30 20 10
Percentage of RR−Pairs [%]
0
advertisement 0 %
0.4 % videos
UNKNOWN 0.9 %
1.4 %
1.3 %
other
groups
1.9 %
offline
search
4%
3.2 %
osnspecific
11.9 % 4.9 % home
messaging
apps
friends
12.1 % profile
20.6 %
13.3 % photos
24.1 %
40 30 20 10
Percentage of RR−Pairs [%]
0
41.7 %
(b) Facebook categories: B3
advertisement 0 %
0% other
0.5 % groups
osnspecific 0.2 %
1.1 % search
2.8 % offline
4.6 %
3.1 %
messaging
apps
5.1 %
home
friends
UNKNOWN
11.3 %
10.9 %
20
18.7 %
30
40
active − guessed active − verified
profile
To assess if OSN user activity differs from other HTTP activity we plot histograms of the relative frequency of rr-pairs and clicks in Figure 5. We see the expected time of day behavior for residential customers. We observe a similar trend for Facebook users. However, there are some notable differences. For example, messaging increases during lunch time and in the early evenings. Also, photos and apps are much more popular in the afternoon to early evening.
active − guessed active − verified
photos
5.3 Difference across time
(a) Facebook categories: A2
10
Figure 4 shows the histograms of the distribution of all rr-pairs rather than active requests for Facebook and A2. Again, we see that the number of UNKNOWN rr-pairs is small—well under 5 %. Next, we note that the number of guessed rr-pairs, which are rrpairs classified with a pattern that could not be verified using the manual traces, is also well below 3 %, except for LinkedIn where there are multiple guessed patterns in the friends category. Over all traces and both ISPs we find that the number of UNKNOWNs and guessed rr-pairs is each less than 7.5 %. Note the drastical difference in the distribution of the observed requests per category from the manual traces (recall Figure 2). This highlights how difficult it can be to approximate actual usage patterns of OSNs via active crawling, even though we acknowledge that our manual traces were collected for the purpose of exploring all OSN features. Note how including the indirect requests drastically changes the relative importance of the categories. For Facebook, messaging and apps decrease by 50 % while home increases. Also, photos rather than profiles is now the top category in StudiVZ. Such shifts are important to keep in mind when partitioning OSN sites among different servers, e. g., one for handling the active requests (typically PHP scripts) and others for handling the embedded objects. LinkedIn differs from the other OSNs in that it has maintained its strict focus on profiles. In LinkedIn (plots not shown) profiles and friends account for more than 50 % of the rr-pairs. Crosschecks for the other traces (not shown) show that this effect is not due to the different locations but rather the different focus of LinkedIn users. To understand the impact of popularity shifts on traffic we have to compare the histogram of the request distributions to those of the byte contributions (see Figures 4(b) for Facebook and A2). Across all traces and all OSNs we see that the relevance of photos increases, as one might expect. Moreover, they contribute the most to the upload activity. The only other categories with some upload activity are apps for Facebook, profile for StudiVZ, and friends for Hi5. In addition, the relative importance of the guessed and UNKNOWN categories decreases even further for all OSNs. Extrapolating this, enabling the use of higher quality photos or even videos which contribute a tiny number of requests may change the bandwidth demand of OSNs quite drastically. Currently, they still contribute no more than 0.3 % of the requests within ISP-A but more than 1 % of the bytes. Recall, how the popularity of YouTube has increased the bandwidth demand.
Percentage of RR−Pairs [%]
5.2 All OSN requests
active − guessed active − verified
0
friends across all traces is even stronger. Within B3 we have 31 % of requests related to profiles and 22 % related to friends. It is intriguing to see that the relationship between requests in the profile and the friends categories are roughly the same for StudiVZ, Facebook, and LinkedIn. Note, that the percentage of UNKNOWNs is small.
(c) Hi5 categories: B3 Figure 3: Category popularity for active requests for Facebook (A2 and B3) and Hi5 (B3) trace: Histogram.
4
OSN actions
2 0
9
11
13
15
17
19
21
23
1
3
3
5
7
9
11
13
15
17
19
21
23
1
3
4
All HTTP
0.1 % other advertisement 0 %
0.1 % other
osnspecific 0.4 %
UNKNOWN 0.5 %
1.2 %
0.6 %
videos
groups
3.5 %
1.3 % search
friends
messaging
6.2 %
7.5 % apps
offline
7
Figure 5: Distribution of Facebook clicks (top) and total HTTP rr-pairs (bottom) for A2 across time.
15.2 %
17.4 % photos
home
profile
5
0
0.2 % videos
UNKNOWN 0.2 %
osnspecific 0.6 %
1.1 % groups
advertisement 1 %
2%
offline
friends
photos
messaging
search
3.5 %
9%
11.2 %
10.1 %
11.6 % apps
home
profile
25.6 % 20.5 %
30 25 20 15 5 0
3
Time [hours]
download − guessed upload − guessed download − verified upload − verified
10
6
8
28.7 % 20.7 %
30 25 20 15 10 5 0
Percentage of RR−Pairs [%]
indirect − guessed active − guessed indirect − verified active − verified
(a) Facebook categories: A2
Percentage of HTTP Payload Bytes [%]
remaining profile apps messaging photos
(b) Facebook categories by bytes: A2 Figure 4: Category popularity for Facebook and A2: Histogram of rr-pairs/bytes. different features offered by the OSN. To this end, we rely on boxplots3 for plotting the percentage of user requests for each category within an authenticated session. This means, a user that has 10 % and 90 % of his requests within home and profiles, respectively, will contribute one data point at 10 % for the boxplot for home and 90 % for the boxplot for profile. Figures 6(a) and 6(b) show the resulting plots for authenticated subsessions with at least 20 active requests for Facebook for traces B3 and A2. We can see that among all the considered subsessions, the features profile, home, messaging, and friends matter. As captured by the whiskers and outliers, for some of the sessions, customer applications play a major role. More than 50 % of the users do not use any custom apps. But there is a substantial fraction which is almost exclusively focused on apps. We find that messaging is more crucial within ISP-B. The same observations hold for the other traces. In general, we note that some of the differences, 3 Boxplots are used to display the location, the spread, and the skewness of several data sets in one plot: The box shows the limits of the middle half of the data; the dot inside the box represents the median; whiskers are drawn to the nearest value not beyond a standard span from the quartiles; points beyond (outliers) are drawn individually.
e. g., with respect to apps usage, can be traced to the behavior of a few users while other differences, e. g., with respect to messaging, are caused by the overall user population. Our previous observation that users use different features when interacting with different OSNs (Figure 3) also holds on a per session basis, e. g., see Figure 6(b) and 6(c) for StudiVZ and Facebook for A2. User actions of StudiVZ and Hi5 users (not shown) appear to be more homogeneous then those of Facebook users as indicated by many outliers in Figures 6(a) and 6(b) when compared to those in Figure 6(c). Over all traces and both ISPs we see that OSN users consistently use the popular features of the OSN such as profiles, photos, messaging, etc. One implication of this analysis is that there are some typical OSN users that use the popular features of that OSN. However, OSN usage is also heavily influenced by some users who like a specific feature a lot, e. g., the application feature of Facebook or the groups feature of StudiVZ.
5.5 Profile usage Lastly, we are interested in a further breakdown of a popular category such as profile. Whenever a user issues an active request for a profile we record if it is for his own, for another profile that is publicly accessible, or for an OSN internal profile. Figure 7(a) shows a stacked barplot of the relative number of accesses to the different profile categories. We note strong differences between the OSNs that we observed across the different traces. In Facebook, LinkedIn, and StudiVZ the majority of the requests are to profiles of friends. Only about 25–35 % are to the users’ own profile. Within Facebook, about 10–15 % of the accesses are to public profiles and 20–25 % in LinkedIn. This feature is not available in StudiVZ and Hi5. One reason why LinkedIn might have a larger number of requests to public profiles is that some people use the public LinkedIn profile as their professional home page. Hi5 differs from the other OSNs in that most profile requests involve the users own profile. In part this is due to the way how Hi5 organizes its site. The profile page is a major component of the navigation. The distribution across the different profile categories holds not just for the overall traces across the ISPs but also roughly within each user’s OSN subsessions. This is shown in Figure 7(b) for Facebook and A2, where for a subset of the authenticated sessions4 , 4 We selected those with the largest number of profile requests per subsession.
100
100
60
60
40
40
0
0
20
20
Percentage
80
80
own other public
profile messaging offline groups other home friends advertisement videos UNKNOWN photos apps search osnspecific
Facebook
LinkedIn
StudiVZ
(a) All OSNs: Distribution of profiles
100 120 140 80 60 40
Number of requested Profiles
own other public
0
20
60 40 0
20
Percentage
80
100
(a) Facebook: B3
Hi5
other groups offline messaging profile UNKNOWN videos advertisement friends home osnspecific search apps photos
(b) Facebook: Profiles per subsessions
20
30
40
own other public
0
10
Number of unique requested Profiles
60 40 0
20
Percentage
80
(b) Facebook: A2
other groups offline messaging profile UNKNOWN videos advertisement friends home osnspecific search apps photos
(c) StudiVZ: A2
(c) Facebook: Unique profiles
Figure 6: Boxplot of # of active requests per authenticated session by OSN features for Facebook and StudiVZ.
Figure 7: Profile usage for trace A2: All OSNs (a), profiles (b) and unique profiles (c) per session for Facebook.
0 −1 −2
log10(P[ bytes > u])
−4
−3
Facebook − authenticated Facebook − total StudiVZ − authenticated StudiVZ − total 10B
100B
1KB
10KB
100KB
1MB
10MB 100MB
u
Figure 8: CCDF of Bytes per OSN subsession for Facebook and StudiVZ for A2. a stacked barplot is used to depict the number of accesses to a user’s own profile, to public profiles, or to another user’s internal profile. We see the skewed nature of the resulting profiles per session distribution. A few users access a lot of profiles (> 100) while others access only a few. The plot also shows that the distribution of profile accesses across the three categories roughly translates to the sessions themselves. This is also confirmed by the boxplot of the same data (not shown). We find that the variation across sessions with respect to the percentages of own, public, or internal profiles does not vary by much. We next compare the number of profile accesses to the number of accesses to unique profiles. We find that while the average number of profile access is 6 for Facebook and A2 the average number of unique profile accesses is only 3. The median reduces from 3 to 2. Moreover, the distribution across the different profile classes changes to predominantly Facebook internal profile. This is highlighted by Figure 7(c) which again plots a stacked barplot for the subsessions with the largest number of unique profile requests. One contributor is that the user’s own profile only counts once. Overall, these numbers are drastically lower than the size of the friendship graphs may indicate. Golder et al. [15] report that the mean/median number of friends is 144/180 while Joinson et al. [17] report 85/124.
6.
OSN SESSION CHARACTERISTICS
While OSNs are not yet universal they are rapidly adding users and change the way that users interact with each other. We now ask if their general traffic characteristics differ from other Web services in terms of top-level characteristics such as session sizes and durations. For example, this is useful for developing test cases for evaluating the performance of new P2P-based OSNs, such as PeerSoN [6].
6.1 Bytes per OSN session We start by examining how much OSNs are contributing to the total traffic in terms of volume. We find that the contribution is still relatively small. Figure 8 plots the Cumulative Complementary Distribution (CCDF) of the number of bytes per OSN subsession for Facebook and StudiVZ for A2 on a log-log scale. All plots for all OSNs and both ISPs show that bytes per session are consistent with a heavy-tailed distribution and not with an exponential one. This implies that a small fraction of all OSN sessions is responsible for most of the bytes imposed on the network by this OSN.
However, the tail of the distributions is by far not as heavy as those of all HTTP services. Indeed, we find that a Weibull distribution with a shape parameter of 0.5 yields a visually reasonable fit for Facebook. The tail of the sessions from all Web services are not well matched by a Weibull distribution. Here, a Pareto distribution with an α between 1.1 and 1.3 visually fits better. The plots indicate and inspection of the other traces confirms that “heavy hitters” in Facebook impose the most load, followed by StudiVZ, and then LinkedIn users. We point out that a typical Facebook session size is between 200 KB and 10 MB, a typical StudiVZ session size between 50 KB and 5 MB, and a typical LinkedIn session size between 10 KB and 1 MB. Figure 8 highlights that there are some differences between the load imposed by authenticated vs. overall OSN sessions especially for StudiVZ. Typically, we see a shift in the probability distribution to a smaller number of bytes and sometimes a mode at OSN specific values, e. g., for StudiVZ at 10KB, occur. Note, that such volume demands are well within the capabilities of mobile data-service offerings.
6.2 OSN session durations Figure 9(a) plots the CCDF of the duration of OSN subsessions and authenticated sessions for Facebook and StudiVZ for A2, respectively, on a log-log scale. The plot shows that OSN sessions exhibit high variability, with many lasting a very short period of time and a few lasting for hours, with a mean of about 40 minutes for both, authenticated and total OSN subsessions. The mean durations for other OSNs and traces is roughly of the same order. Only the mean duration of Facebook usage at ISP-B is significantly longer. Note, the total OSN subsessions last just slightly longer than the authenticated OSN subsessions which is the case for both ISPs and all OSNs. This agrees with our expectation that users do not spend much time on the OSN site without logging in. Over all traces and both ISPs we find that the session duration distributions are not consistent with an exponential distribution, but have significantly heavier tails. Figure 9(b) plots the Probability Density Function (PDF) of the logarithm5 of the same durations as shown in Figure 9(a). We again see that the total duration is only slightly longer than the authenticated duration. Indeed, more than 10 % of the authenticated sessions and 12.5 % of the total sessions last longer than one hour. We also observe a peak between 5 sec and 2 min which appears to come from sessions where users only briefly check in with the OSN. Indeed, we find that most of them consist of only one or two actions. Comparing the durations of Facebook sessions to those of StudiVZ within the traces at ISP-A, we see there are more longer as well as shorter lasting sessions in Facebook than in StudiVZ. In Facebook we have a clear mode between 10 sec to 1 min while the mode is at 1–5 minutes for StudiVZ. Figure 9(c) shows the PDF for Facebook and Hi5 for the 7-day trace B3. We again see that the usage of different OSNs by users of the same ISP differs. For Facebook we notice more shorter connections as well as many longer lasting ones than for Hi5 across all ISP-B traces. The session durations for LinkedIn (not shown) for all traces fall between those of Facebook and Hi5. Some Facebook sessions last as long as 24 hours and thus increase the mean duration for Facebook at ISP-B. But there is also a significant fraction between one to ten minutes. When comparing the durations of Facebook across ISPs, i. e., by comparing Figure 9(b) with Figure 9(c), we see that within ISP-B 5 Coupled with a logarithmic scale on the x-axis, plotting the density of the logarithm of the data facilitates direct comparisons between different parts of the graphs based on the area under the curve.
20 5
20
1s
10s
1m
5m
1h
1d
(a) Facebook/StudiVZ: A2 (CCDF) Facebook − total Facebook − authenticated StudiVZ − total StudiVZ − authenticated
0.15
>20
8−10
10−20
5
6−7
4
3
2
1
>20
8−10
10−20
5
6−7
4
3
2
1
0.1s
(b) Subsessions per IP: B3
Figure 10: Histogram of authenticated Facebook subsessions per IP address for A2 and B3.
u
Facebook has more shorter connections as well as many longer lasting ones. It appears, that users at this ISP stay active on Facebook for significantly longer time periods. We observe this difference across all traces. We also note the spike at 1 day—likely due to automatic renewal of IP addresses which ends the session. Maier et al [25] show that within ISP-A there is a large fraction of users that use idle disconnects6 . This explains the shorter durations. On the other hand, the shape of the distributions for Hi5 and StudiVZ are similar even though these are different OSNs at different ISPs.
0.05
0.10
6.3 Number of subsessions within a session
0.0
probability density
0
10 0
10ms
1ms
10ms
0.1s
1s
10s
1m
5m
1h
1d
5d
Session duration
(b) Facebook/StudiVZ: A2 (PDF)
0.05
0.10
0.15
Facebook − total Facebook − authenticated Hi5 − total Hi5 − authenticated
0.0
probability density
10
30
40
15
50
0 −1 −2 −3
Facebook − total Facebook − authenticated StudiVZ − total StudiVZ − authenticated
−4
log10(P[ duration > u])
(a) Subsessions per IP: A2
1ms 10ms
1s
10s 1m
5m
1h
1d
5d
Session duration
(c) Facebook/Hi5: B3 (PDF) Figure 9: CCDF and PDF of durations of total and authenticated OSN subsessions: Facebook and StudiVZ (CCDF and PDF for A2) and Facebook and Hi5 (PDF for B3.)
Lastly, we explore how often a single user has multiple subsessions with an OSN. Figures 10(a) and 10(b) show histograms of the number of subsessions per anonymized IP address for Facebook within A2 and B3. We observe that it is common to have multiple sessions per IP. This can have multiple reasons, e. g., multiple computers using a single DSL line via NAT box; multiple users using the same computer; and reuse of IP addresses to different DSL subscribers. Within ISP-A we see a smaller number of subsessions per anonymized IP address than in ISP-B. Given that IP addresses are assigned dynamically one can expect the number of sessions per IP address to increase with the length of the trace. We, for example see this across OSNs within ISP-B when we compare results from B2 to those of B3. Nevertheless, this effect does not fully explain the difference between Figures 10(a) and 10(b). There are also differences between OSNs. For example, at ISP-A there are more sessions per IP address for Facebook than for StudiVZ in both traces. Moreover, at ISP-B Hi5 has a higher likelihood of two sessions than Facebook across all traces at ISP-B. To differentiate between multiple subscribers and multiple users, we also checked how many subsessions a single session (using the same session cookie) has. While there are many sessions that have only a single subsession, there are a number of users (as identified by the session cookie within Facebook) that repeatedly login/logout from Facebook. Indeed, 15 % of all Facebook sessions recorded at ISP-A include more than 3 subsessions. In addition, we have observed a session with more than 387 subsessions. Within B2 and B3 a single IP address which has many authenticated sessions skews the results. For other OSNs we see a smaller number of subsessions per session, i. e., for Hi5 and LinkedIn we see less than 5 % of the sessions with more than 3 subsessions. Unfortunately, this kind of analysis cannot be extended to StudiVZ as StudiVZ assigns a new session cookie for each authenticated subsession. 6 An idle disconnect is a feature of home routers (NAT boxes) that disconnects its DSL connection when the user is idle for some time. Usually, such routers automatically reconnect the DSL connection whenever there is new activity. This usually implies a change in the IP address for the line.
40 30
arrows without labels are 1%
5%
messaging home offline profile photos friends search remain
3% profile
friends
2%
3%
2% photos
3% 20%
8%
2%
messaging
4%
20
2% home offline
5%
2%
9%
2%
10
search
0
Figure 12: Typical click sequences for Facebook and A2 (only transitions > 1 % are shown). 10min
20min 0.30
5min
home messaging profile photos offline
In principle, we notice that the durations of Facebook sessions are longer than those of other OSNs. We next examine if the users are actually continuously interacting with the OSN or if this duration is an artifact of the session handling. Therefore, we compute OSN action sequences by grouping all actions from the same OSN session as long as the time between actions never exceeds a timeout value of 5 minutes. Then, we use this information to calculate the percentage of time users are active on the OSN and the percentage of time they are inactive. An inactive user is authenticated with the OSN but is currently not interacting with it. When we consider all sessions users are typically active during the whole session. If we only consider those sessions that last more than 1 minute, only 50 % of the users remain active the whole time. Once we consider only those sessions that last for at least 40 minutes we find that hardly any users continuously interact with Facebook. We notice that during active periods, Facebook users usually do not visit any other sites. Only 7 % of all sessions for A2 visit other sites. Among the most popular domains are msn.com and photo community sites. While the users are inactive on Facebook, sites such as Google, YouTube, and Apple are popular. Other users additionally visit other OSNs, news sites, the ISP home page, etc. Next, we explore the features with which users resume their usage of Facebook after a period of inactivity. Figure 11 shows the relative histograms for inactivity breaks of length 5, 10, and 20 minutes. The distribution changes drastically. After a short break, messaging is dominant. However, after a 10 minute break, home and offline take over in importance. This trend continues if we consider 20 minute breaks. However, for longer breaks the plots stay the same as for 20 minutes. In addition, we note that relevance of photos, profile, search, friends also increase slightly.
7.2 Feature sequences Given the above observation regarding which features are popular after a break, we now explore the relative popularity of feature sequences within the user clickstreams for Facebook sessions with
0.20 0.15 0.10
7.1 Active vs. inactive time
0.05
DYNAMICS WITHIN OSN SESSIONS
Next, we delve into the OSN sessions and ask how users behave within a session. This is crucial for deriving detailed models for OSN evaluations.
0.0
7.
probability density
0.25
Figure 11: Actions after inactivity period for Facebook and A2.
1ms
10ms
0.1s
1s
10s
1m
5m
1h
1d
inter arrival times of actions
Figure 13: PDF of inter-action times within Facebook categories (A2). at least ten active requests. The corresponding transition diagram is shown in Figure 12 for trace A2. We find that the prominent feature categories, seen in Figure 3(a), are also dominant here. A few categories account for 50 % of the transitions and they indicate that users tend to stay within their feature category, i. e., from messaging to messaging (20 %), from home to home (9 %) from photo to photo (8 %), and from profile to profile (5 %). However, it is also interesting to see that from home, messaging is the most likely category followed by profile. From profile, the users switch to home, photos, or messaging. For StudiVZ we see a similar trend—users tend to stay within their feature categories. But for Facebook the dominant features are profiles (9 %), friends (7 %) and photos (7 %). The transitions between features are from friends to profiles (6 %) and from profiles to home, photos, and friends (4–6 %). Then, we explore how much time a user needs for such transitions. Figure 13 shows a density of the inter-arrival time for selected feature groups. We focus on home, messaging, profile, photos, and offline as they are among the most popular features and their inter-arrival time distributions differ. The distributions for offline differs the most from the others. This is not that surprising given the previous discussions about periods of inactivity. Messaging also has some larger inter-arrival times. One possible explanation is that users need some time to compose their texts. Profiles typically have shorter inter-arrival times and photos are still shorter. A user is likely to stay within the same category while exploring
different profiles/photos. For photos this is usually simplified by photo album features. Home has a bimodal distribution. The very short inter-arrival times are likely due to triggered actions. The other mode is likely due to its use as navigation site.
8.
RELATED WORK
In the past, social network analysis was the domain of sociologists and anthropologists [40]. Their typical tools are surveys and interviews which have the drawback that they can usually only capture a small user base. Nowadays, with the advent of online social networks, the networking community is capable of gathering largescale data sets from OSNs, e. g., by crawling the OSN, by passively monitoring user interactions, or by collaborating with an OSN operator. In this paper, we examined actual traffic across multiple OSNs, both at a macro as well as at a micro-level, to understand user behavior. Therefore, our work is related to the efforts that rely on surveys [10, 35, 1] and interviews [17]. Our findings regarding the feature popularity match well with the findings of Joinson [17]: OSN users focus on messaging, browsing profiles, and sharing of photos. Hence, one can conclude that the users impression about how they use OSNs agrees with how they actually use them. In addition, we have a significantly larger user base, explore multiple OSNs, and explore within session characteristics. Other efforts use network traces to characterize individual OSNs or individual features of OSNs. For example, Gill et al. [13] study patterns of access to YouTube from a campus perspective. Zink et al. [42] also study YouTube using passive traces from a campus network. They explore the popularity of video clips and show that local and global popularity of video clips differ which supports the case of local caching. Nazir et al. [28] focus on a specific feature of Facebook: Third party applications. By offering different kinds of applications on their own servers they are able to monitor and characterize their usage. By further studying the interactions between Facebook, external applications, and the OSN users Nazir et al. [29] identify some potential performance bottlenecks within the Facebook server infrastructure. Using network data of an extended time period from Facebook messages and pokes sent by college students Golder et al. [15] are able to characterize another piece of Facebook: The messaging activity. We in contrast focus on the larger picture and can examine transaction sequences. By collaborating with specific OSN operators Chun et al. [9] are able to compare the structural characteristics of the activity network with the friends network relying on guestbook logs from Cyworld. Kumar et al. [21] explore how path properties, including diameter and density, of the social network change over time for Flickr and Yahoo 360! based on timegraphs from these networks. As such, both of these studies focus on the graph properties rather than on how users use the OSN. A few studies have tried to explore the differences and commonalities between OSNs. For example, Backstrom et al. [4] study how groups form in social networks across LiveJournal and DBLP; Kumar et al. [21] explore how path properties, including diameter and density, of the social network change over time for Flickr and Yahoo 360!; and Mislove et al. [27] explore the degree and cluster coefficient of the embedded networks and confirm the power-law, small-world, and scale-free properties of online social networks for Flickr, LiveJournal, YouTube, and Orkut. While the previously mentioned studies focus on the graph properties of the online communities Krishnamurthy and Wills [20] characterize privacy settings and their usage across Facebook, MySpace, Bebo, and Twitter while Cha et al. [7] study how the popularity of video content changes with the age of the content for YouTube and Daum UCC.
However, all of these studies can only study the static relationships in the OSN rather than how the users actually interact with the OSN. By crawling specific OSNs other studies have focused on the topology of the OSN. For example, the study by Mislove et al. [26] focuses on the growth of the Flickr’s network and if it adheres to the preferential attachment property. This is complemented by Cha’s work on social cascades in Flickr [8] and Liben-Nowell’s work on the relationship between geography and online friendships in LiveJournal [23]. Gjoka et al. [14] crawl Facebook user profiles to study high-level characteristics of application users and the growth patterns of applications. Lampe et al. [22] crawl Facebook to determine the popularity of specific profile elements. We in contrast examine how many profiles in general and how many unique profiles are actually accesses by users within an OSN session. Recent work has focused on understanding how users interact with the OSN or with other users using crawls of the OSN sites. For example Viswanath et al. [39] repeatedly crawled the walls of specific Facebook users and used the differences to determine communication patterns. Valafar et al. [38] examine interactions within Flickr between the photo owners and their fans. Torkjazi et al. [37] find that a large fraction of the MySpace user IDs are inactive or deleted by inspecting the last login time. In concurrent work, Benevenuto et al. [5], also analyzed clickstream data to develop models of OSN user behavior. Their data source is a Brazilian social network aggregator. Their analysis focuses on Orkut as it is the most popular OSN within their data set. Overall, their study identifies similar trends to ours.
9. SUMMARY We successfully reconstructed OSN clickstreams from anonymized HTTP header traces obtained from passively monitored network traffic with tens of thousands of users at different ISPs. We present a customizable methodology for identifying OSN sessions and user actions within the OSN. We apply our methodology to four OSNs: Facebook, Hi5, LinkedIn, and StudiVZ. Our methodology enables us to extract OSN usage information across a wide range of features, from coarse information like session duration to minute details about the kinds of profiles the user accesses. For example, we find: • Users tend to stay within the same activities (feature category). Moreover, we find that users are “trapped” in some categories, e. g., photos and messaging. • While user sessions can be quite long (typically > 30 minutes), we find, e. g., for Facebook, that for long sessions (> 10 minutes) users do not continuously interact with the OSN. • While we selected the specific set of OSNs based on the criterion that they feature profiles, they are the most popular feature only within LinkedIn and StudiVZ. With regards to transfer volume, photos are currently the most important category, although the volume is significantly lower than that of typical Web sessions. We are able to identify the features that are important to the users and point out differences from other Web services. In addition, we gathered some insights on how to generate workloads for evaluating novel OSNs. The next steps involve customizing our methodology for a larger set of OSNs. Moreover, we are planning to dig even deeper into the intra-session characteristics. In addition, we are starting a collaboration with researchers in the social sciences to better understand the implications of our observations.
10. REFERENCES [1] ACQUISTI , A., AND G ROSS , R. Imagined communities: Awareness, information sharing, and privacy on the Facebook. In Privacy Enhancing Technologies (2006). [2] A RRINGTON , M., 2009. http://www.techcrunch.com/ 2009/01/22/facebook-now-nearly-twice\ -the-size-of-myspace-worldwide/. [3] ATTERER , R., W NUK , M., AND S CHMIDT, A. Knowing the user’s every move—user activity tracking for website usability evaluation and implicit interaction. In Proc. World Wide Web Conf. (2006). [4] BACKSTROM , L., H UTTENLOCHER , D., K LEINBERG , J., AND L AN , X. Group formation in large social networks: Membership, growth, and evolution. In Proc. ACM SIGKDD (2006). [5] B ENEVENUTO , F., RODRIGUES , T., C HA , M., AND A LMEIDA , V. Characterizing user behavior in online social networks. In Proc. ACM IMC (2009). [6] B UCHEGGER , S., S CHIÖBERG , D., V U , L. H., AND DATTA , A. PeerSoN: P2P social networking – early experiences and insights. In Proc. ACM Workshop on Social Network Systems (2009). [7] C HA , M., K WAK , H., RODRIGUEZ , P., A HN , Y.-Y., AND M OON , S. I tube, you tube, everybody tubes. In Proc. ACM IMC (2007). [8] C HA , M., M ISLOVE , A., A DAMS , B., AND G UMMADI , K. P. Characterizing social cascades in Flickr. In Proc. ACM SIGCOMM WOSN (2008). [9] C HUN , H., K WAK , H., E OM , Y.-H., A HN , Y.-Y., M OON , S., AND J EONG , H. Comparison of online social relations in volume vs. interaction: A case study of Cyworld. In Proc. ACM IMC (2008). [10] E LLISON , N., S TEINFELD , C., AND L AMPE , C. Spatially bounded online social networks and social capital: The role of Facebook. In Proc. Int. Communication Assoc. (2006). [11] FACEBOOK, 2008. http://blog.new.facebook.com/ blog.php?post=30074837130. [12] FACEBOOK, 2009. http://www.facebook.com. [13] G ILL , P., A RLITT, M., L I , Z., AND M AHANTI , A. YouTube traffic characterization: A view from the edge. In Proc. ACM IMC (2007). [14] G JOKA , M., S IRIVIANOS , M., M ARKOPOULOU , A., AND YANG , X. Poking Facebook: Characterization of OSN applications. In Proc. ACM SIGCOMM WOSN (2008). [15] G OLDER , S., W ILKINSON , D., AND H UBERMAN , B. A. Rhythms of social interaction: Messaging within a massive online network. In Int. Conf. on Communities and Technologies (2007). [16] H I 5, 2009. http://www.hi5.com. [17] J OINSON , A. N. Looking at, looking up or keeping up with people? Motives and uses of Facebook. In Proc. ACM CHI (2008). [18] K AMMENHUBER , N., L UXENBURGER , J., F ELDMANN , A., AND W EIKUM , G. Web search clickstreams. In Proc. ACM IMC (2006). [19] K RISHNAMURTHY, B. A measure of online social networks. In Proc. COMSNETS (2009). [20] K RISHNAMURTHY, B., AND W ILLS , C. E. Characterizing privacy in online social networks. In Proc. ACM SIGCOMM WOSN (2008).
[21] K UMAR , R., N OVAK , J., AND T OMKINS , A. Structure and evolution of online social networks. In Proc. ACM SIGKDD (2006). [22] L AMPE , C. A., E LLISON , N., AND S TEINFIELD , C. A familiar face(book): Profile elements as signals in an online social network. In Proc. ACM CHI (2007). [23] L IBEN -N OWELL , D., N OVAK , J., K UMAR , R., R AGHAVAN , P., AND T OMKINS , A. Geographic routing in social networks. In Proc. National Academy of Sciences (2007). [24] L INKED I N, 2009. http://www.linkedin.com. [25] M AIER , G., F ELDMANN , A., PAXSON , V., AND A LLMAN , M. On dominant characteristics of residential broadband internet traffic. In Proc. ACM IMC (2009). [26] M ISLOVE , A., KOPPULA , H. S., G UMMADI , K. P., D RUSCHEL , P., AND B HATTACHARJEE , B. Growth of the Flickr social network. In Proc. ACM SIGCOMM WOSN (2008). [27] M ISLOVE , A., M ARCON , M., G UMMADI , K. P., D RUSCHEL , P., AND B HATTACHARJEE , B. Measurement and analysis of online social networks. In Proc. ACM IMC (2007). [28] NAZIR , A., R AZA , S., AND C HUAH , C.-N. Unveiling Facebook: A measurement study of social network based applications. In Proc. ACM IMC (2008). [29] NAZIR , A., R AZA , S., G UPTA , D., C HUAH , C.-N., AND K RISHNAMURTY, B. Network-level footprints of Facebook applications. In Proc. ACM IMC (2009). [30] PAXSON , V. Bro: A system for detecting network intruders in real-time. Computer Networks 31, 23–24 (1999). [31] S ILVERSTEIN , C., H ENZINGER , M., M ARAIS , H., AND M ORICZ , M. Analysis of a very large AltaVista query log. Tech. rep., SRC Technical Note 014, 1998. [32] S PINK , A., KOSHMAN , S., PARK , M., F IELD , C., AND JANSEN , B. J. Multitasking web search on vivisimo.com. [33] S PINK , A., W OLFRAM , D., JANSEN , B., AND S ARACEVIC , T. Searching the web: The public and their queries. In American Society for Information Science and Techn. (2001). [34] S TUDI VZ, 2009. http://www.studivz.net. [35] S TUTZMAN , F. An evaluation of identity-sharing behavior in social network communities. iDMAa Journal (2006). [36] S YSTEMS , E. M. http://www.endace.com/, 2009. [37] T ORKJAZI , M., R EJAIE , R., AND W ILLINGER , W. Hot today, gone tomorrow: On the migration of MySpace users. In Proc. ACM SIGCOMM WOSN (2009). [38] VALAFAR , M., R EJAIE , R., AND W ILLINGER , W. Beyond friendship graphs: A study of user interactions in Flickr. In Proc. ACM SIGCOMM WOSN (2009). [39] V ISWANATH , B., M ISLOVE , A., C HA , M., AND G UMMADI , K. On the evolution of user interaction in facebook. In Proc. ACM SIGCOMM WOSN (2009). [40] WASSERMAN , S., AND FAUST, K. Social network analysis. Cambridge University Press, 1994. [41] W EINREICH , H., O BENDORF, H., H ERDER , E., AND M AYER , M. Off the beaten tracks: Exploring three aspects of web navigation. In Proc. World Wide Web Conf. (2006). [42] Z INK , M., S UH , K., G U , Y., AND K UROSE , J. Watch global, cache local: YouTube network traces at a campus network – measurements and implications. In IEEE MMCN (2008).