Jan 20, 2006 - SAVE (Software Architecture Visualization and Evaluation, see) is ..... tions for the participants at FC-MD, but we offered remote support via tele-.
Understanding Software Architectures by Visualization – An Experiment with Graphical Elements
Authors: Jens Knodel Dirk Muthig Matthias Naab Accepted for Publication at WCRE 2006 in Beneneto
IESE-Report No. 021.06/E Version 1.0 January 20, 2006 A publication by Fraunhofer IESE
Fraunhofer IESE is an institute of the Fraunhofer Gesellschaft. The institute transfers innovative software development techniques, methods and tools into industrial practice, assists companies in building software competencies customized to their needs, and helps them to establish a competitive market position.
Fraunhofer IESE is directed by Prof. Dr. Dieter Rombach (Executive Director) Prof. Dr. Peter Liggesmeyer (Director) Fraunhofer-Platz 1 67663 Kaiserslautern
Abstract
The evolution and maintenance of large-scale software systems requires first an understanding of its architecture before delving into lower level details. Tools facilitating the architecture comprehension tasks by visualization provide different sets of graphical elements. We conducted a controlled experiment that exemplifies the critical role of such graphical elements when aiming at understanding the architecture. The results show that a different configuration of graphical elements influences program comprehension tasks significantly. In particular, a gain of effectiveness by 63% in basic architectural analysis tasks was achieved simply by choosing a different set of graphical elements. Based on the results we claim that significant effort should be spent on the configuration of architecture visualization tools. Keywords:
architecture, experiment, graphical elements, program comprehension, visualization, SAVE, ArQuE
Copyright © Fraunhofer IESE 2006
v
Table of Contents
Copyright © Fraunhofer IESE 2006
1
Introduction
1
2 2.1 2.2
Context Apache Tomcat SAVE
3 3 3
3 3.1 3.1.1 3.1.2 3.1.3 3.1.4 3.1.5 3.1.6 3.1.7 3.1.8 3.1.9 3.2 3.2.1 3.2.2 3.2.3 3.2.4 3.2.5 3.2.6 3.3 3.3.1 3.3.2 3.3.3
Experiment Setup Hypotheses Pilot Study Subjects Experimental Materials Experimental Design Experimental Tasks Experimental Procedures Data Collection Procedures Data Analysis Procedure Results Architecture Analysis Task Results Anomalies in the Data Set Hypotheses H1 and H2 H3 – Visualization Questionnaire Results Debriefing questionnaires Influence of Graphical Elements on the Results Threats to validity Construct Validity Internal Validity External Validity
4 4 4 4 5 5 7 8 8 9 10 10 10 11 12 13 15 16 17 17 18 18
4
Related Work
20
5
Conclusion
21
References
22
Appendix A – Experimental Tasks
25
vii
Introduction
1
Introduction
The architecture of a software system plays a crucial role in the lifecycle since it guides its evolution [8] and during maintenance, the software architecture is the means to cope with the inherent complexity of the system. The architecture is the means to coordinate the maintenance tasks (i.e., assigning the right people to the right problems, to plan and monitor the activities). Thus, to successfully evolve large-scale systems it is essential to understand their architecture before delving into details of the implementation, which is a non-trivial, time and effort-consuming activity due to the following reasons: • High amount of data: Large-scale systems consist of up to several millions lines of code that, potentially, have to be analyzed and abstracted to an architectural level. Important information is often hidden among irrelevant data; retrieval and navigation within the data is more difficult. • High complexity: Large systems are especially complex and therefore not easy to understand; it is impossible to handle the system as a whole in all details, so one can only cope with certain parts at a point in time. • High number of dependencies: Large systems obviously have a lot of dependencies among the architectural and code elements they are composed of, which poses significant threats of introducing unwanted side effects. The most important part in the maintenance and evolution of software systems is dedicated to understand the system being maintained [5]. Due to the abovementioned reasons the understanding should be supported by tools. Most available tools can be roughly categorized in two main groups: they are either query languages-based (e.g., [4; 7; 13]) or visualization-based tools, both supporting architecture comprehension but working in different ways. Especially the graphical elements used in architecture visualization tools range from simple lines and boxes (e.g. [20; 22]) to very complex notations (e.g. [2; 14; 15]). At Fraunhofer IESE we use the SAVE tool (Software Architecture Visualization and Evaluation) to evaluate software architectures [10], which has a powerful configurability that allows to enable and disable almost all its built-in graphical elements (we thereby define graphical elements as the concepts and figures that determine how views on software architectures are visualized). While evaluating software architectures with SAVE in our group we made three observations: • Almost every person configured the SAVE tool differently. • Working with a configuration created by someone else can decrease the analysis efficiency.
Copyright © Fraunhofer IESE 2006
1
Introduction
• Some graphical elements of SAVE seemed to have more impact on the efficiency than others. Based on these observations, we derived the following open questions: what is the influence of graphical elements in architecture analysis tasks of large-scale software systems? Which impact has a configuration on the effectiveness and efficiency of achieving results? What is a good default configuration for SAVE? In this paper, we report on a controlled experiment we conducted with 29 participants (12 software engineering researchers and 17 computer science students) analyzing the criticality of graphical elements in architectural analysis tasks. We set up two configurations of SAVE and split the participants into two groups (each group working with a different configuration of the SAVE tool) and asked them to perform the same, realistic architecture analysis tasks (see Appendix A). The object being analyzed in the experiment was the Apache Tomcat web server which is briefly introduced in Section 2. Then Section 3 reports on the experiment’s setting, the results and discusses potential threats to validity. Section 4 presents related work and Section 5 concludes this paper.
2
Copyright © Fraunhofer IESE 2006
Context
2
Context
2.1
Apache Tomcat Apache Tomcat is a servlet container that is an implementation of the Java Servlet and JavaServer Pages technologies. It is developed in an open and participatory environment and released under the Apache Software License. Apache Tomcat powers numerous large-scale web applications across a diverse range of industries and organizations [1]. We used Apache Tomcat version 5.0.28 as the system to be analyzed in the experiment. It is a system with about 4.5 MB of source code in 411 Java files in 42 packages.
2.2
SAVE SAVE (Software Architecture Visualization and Evaluation, see) is an Eclipse plug-in for conducting static architecture evaluations [10] based on Reflexion models as described in [16] and [12]. The SAVE tool has a powerful engine for the visualization of software architectures offering a large number of state-ofthe-art graphical elements. A main feature is the configurability of the visualization (i.e., enabling and/or disabling certain graphical elements) allowing users to adapt the visualization of results to their needs and wishes. The two configurations we used are described in section 3.1.4.
Copyright © Fraunhofer IESE 2006
3
Experiment
3
Experiment
3.1
Setup
3.1.1
Hypotheses As graphical elements seem to be important for the understanding of a visualized software system, the idea was to explore how critical the impact of graphical elements is. We captured the participants’ architecture analysis task execution results for investigating what effects graphical elements can have. The hypotheses were: • H1 – Visualization enables “novices” to solve architecture exploration tasks with nearly the same effort as experts do. (Novice in this context means that the person exploring the architecture has no or limited knowledge in the domain to which the systems belongs, in this experiment the web server domain) • H2 – Visualization does not have an effect when solving complex transfer tasks. Since visualizations of software architectures are often used by people that are new to a particular system, we studied two additional aspects captured in H3: • H3 – Well-designed graphical elements support the comprehensibility and the reduction of complexity in software architecture visualization.
3.1.2
Pilot Study For the preparation of the experiment we asked two experts in the field of web servers and especially of Apache Tomcat to solve the tasks of the experiment. We were lacking a larger number of experts; nevertheless, we think the results are sufficient to serve as basis for exploring the difficulty of the tasks and the time needed for the solution. Both experts have been working with web servers for a longer time, also have experience in related fields, and stated that they would consider themselves as experts. Expert 1 was asked to conduct the experiment using the SAVE visualization in roughly one hour. In fact, he finished in 45 minutes with correct results.
4
Copyright © Fraunhofer IESE 2006
Experiment
The procedure for the expert 2 was different. In order to be able to estimate what the visualization adds as a help to the task solution expert 2 was asked to solve the tasks without the visualization. Therefore, the task description was slightly adapted. The source code was provided in an Eclipse installation and with all default development tools. Additionally we provided the dependencies as they are extracted from the source code by the SAVE tool as an Excel spreadsheet. Expert 2 achieved about half of the results as expert 1 did. One comment of him was that the amount of data provided was very large and therefore the solution of the tasks was very difficult. 3.1.3
Subjects The subjects participating in the experiment were software engineering researchers and computer science students of the Fraunhofer Institute for Experimental Software Engineering (IESE), Kaiserslautern, Germany and its sister institute, the Fraunhofer Center in Maryland (FC-MD), USA. 10 researchers and 16 students from IESE, 2 researchers and 1 student from FC-MD resulted in a total of 29 subjects. All researchers involved were expected to have deep knowledge in the field of software architecture, since they did numerous architecture-related projects. All the students were at least graduate students. All information necessary was given in the context of the experiment execution and there was no special training.
3.1.4
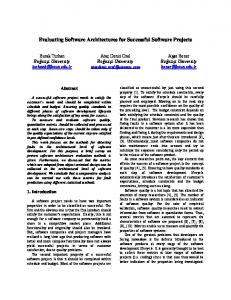
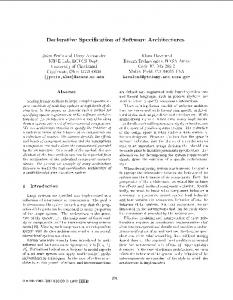
Experimental Materials As the goal of the experiment was to explore whether the usage of different combinations of graphical elements leads to different results in the experiment, two different setups of graphical elements in SAVE were designed. In the following, a number of graphical elements available in SAVE will be explained: • Different visual figures for different types of components: We can freely assign figures to the types of components (system, subsystem, …) from a set of UML-like figures. Some of these figures can be seen in Figure 2. A similar approach with different line styles, colors, and widths is applied for relations. • Nested components for containment hierarchies vs. explicit containment relations in flat representations: A model of a software system mostly contains some kind of hierarchy (e.g., the system contains subsystems). We offer to display this either by nesting the components or by drawing explicit containment relations. Since artifacts in SAVE can only be contained in one container per definition this leads to a tree structure. Figure 1 presents the same excerpt of Tomcat using the different configurations.
Copyright © Fraunhofer IESE 2006
5
Experiment
• Relation highlighting: If a component is selected in the visualization all its incoming and outgoing relations can be highlighted by changing their color. For example, in Figure 2 the incoming and outgoing relations of “org.apache.catalina” are highlighted. • Component highlighting with information panel: If a component is selected we can highlight it by a transparent overlay figure with a different color. Furthermore, this figure contained additional textual information: the component name, its type, and the name of the figure used.
Figure 1:
Configuration B (left) and A (right) showing the same excerpt of a system
• Legend: In case that different types of components are displayed using different figures a legend was provided to help users in understanding the figures and their meaning. The legend explains different colors denoting the relations types, too. However, it is not clear whether many different graphical elements ease or hamper working with the visualization. Therefore, one distinction of the configurations was the number of graphical elements offered to the user. Besides this, we also varied the appearance of single graphical elements between the configurations.
6
Copyright © Fraunhofer IESE 2006
Experiment
Configuration Group A A key difference between the configurations is that configuration A uses the tree structure whereas configuration B uses nested components for displaying containment of components (as displayed in Figure 1). Configuration A is lean with respect to the number of graphical elements used. It leaves out highlighter for incoming and outgoing relations and selected components. Since the number of colors and figures used is restricted the legend is left out as well. Configuration Group B Configuration B provides a larger number of graphical elements, for example highlighting of selected elements. We used different figures and colors for different kinds of components in configuration B as a contrast to configuration A and explained them in a legend. Figure 2 presents the different figures for a system, subsystems and components in the UML style.
Figure 2:
3.1.5
Different figures and relation highlighting
Experimental Design The participants were randomly distributed in two groups working with either configuration A or configuration B. Every group did only one pass of the experiment with one configuration in order to avoid learning effects. Since researchers and students are assumed to have different skill levels, we separated them resulting in four person groups as shown in Table 1. The participants executed the experiment sequentially as only one computer was available for the experiment. Additionally the participants were allowed to ask clarification questions. The experiment was conducted as a “blind” experiment: participants were neither told to which groups they belonged nor that there were different configurations.
Copyright © Fraunhofer IESE 2006
7
Experiment
Configuration Group Person Groups Table 1:
3.1.6
A A Researcher (7)
B B Student (8)
Researcher (5)
Student (9)
Number of participants per person group
Experimental Tasks Both the groups A and B were asked to solve the same 10 architecture analysis tasks (see Appendix A for the complete list). The experimental tasks represented realistic architecture analysis scenarios and analyzed static views on the architecture of the Apache Tomcat. The tasks were divided into 3 groups: Filter tasks: These tasks are so easy that everyone should be able to solve them. If there are persons that do not solve the tasks they are taken out of the experiment results as there are probably problems in understanding the tasks, using SAVE, or the experiment as such for some reason. The tasks 1 and 9 are of this category. There were 2 students of group A that failed for both the tasks and were therefore removed from the evaluation. Basic tasks: These are tasks that can be solved by extracting facts from the visualization and writing them down as an answer. The tasks 2 – 7 belong to this category. Transfer tasks: Finally, tasks 8 and 10 were more difficult and asked for more sophisticated results. For instance, task 10 dealt with the differences of the processing of the TCP and HTTP network protocols. For the solution of this task participants had to reason about the expressiveness of component names, the relations to other components and to navigate to the source code to learn about details of the classes involved. The results of the tasks are twofold: written answers given to questions on the task sheet and artifacts like views and screenshots created with the SAVE tool. We had an example solution for each task and defined the number of points to be obtained for an answer based on the difficulty of the task (0 points for filter task, basic tasks with 1 or 2 points, and two transfer tasks with 3 and 4 points). A total number of 15 points (8 points for basic tasks, 7 points for transfer tasks) could be obtained.
3.1.7
Experimental Procedures One computer was prepared for the experiment: Eclipse and the SAVE plug-in were installed, two Eclipse workspaces were prepared containing all the data required: the only difference was the configuration of the graphical elements
8
Copyright © Fraunhofer IESE 2006
Experiment
for the groups A and B. The workspaces were completely restored for each participant. The participants were given a handout including the material for the experiment: • Step-by-step experiment processing: A short introduction to the experimental context guiding the participants through the experiment. Participants were asked to write down the time after every step. • Pre-briefing questionnaire: This questionnaire asked for the participants’ experience in fields related to the experiment and their motivation. • SAVE visualization introduction: A short introduction explaining the major functionality of the SAVE tool and the graphical elements available. • Experimental tasks: Architecture analysis tasks for the Tomcat system to be solved by the participants (see section 3.1.6). • Visualization questionnaire: This questionnaire was concerned with questions about the comprehensibility and complexity reduction of the graphical elements. • Debriefing questionnaire: Covers questions concerning the auto-perception of the performance of the participant (i.e., how good the quality of the results is estimated to be). Furthermore there are some questions about the experiment itself (e.g., sufficiency of time, realism of tasks). • Eclipse workspaces: The Eclipse workspace contained the Apache Tomcat visualized in SAVE. The screenshots produced by each participant were stored within the workspace. The processing time until finishing the tasks was limited to 45 minutes, and then 15 minutes were given to fill in the remaining questionnaires. Finally, from each participant the resulting material was collected. 3.1.8
Data Collection Procedures The task results including screenshots and the Eclipse workspaces with visual results and questionnaires filled in were collected. The time was noted for every task step. Independent variables of the experiment were the software architecture being explored and the tool to explore it. Evaluating the tasks the percentage rate of points obtained for architecture analysis tasks was measured. The distinction between the goals comprehensibility and reduction of complexity was made in the visualization questionnaire.
Copyright © Fraunhofer IESE 2006
9
Experiment
3.1.9
Data Analysis Procedure The experiment data of 27 participants was available for the evaluation and the evaluation was carried out according to the expected results with exactly defined instructions how many points an answer counts for. In order to guarantee the correctness of task evaluation a second person evaluated the tasks of four randomly chosen participants (2 of group A and 2 of group B). The divergence between the evaluation results of the two evaluating persons was 0.5 points at the most, which is about 3% of the 15 points. The data was not yet evaluated statistically, but qualitative results and outliers were identified.
3.2 3.2.1
Results Architecture Analysis Task Results The answers to the tasks of each participant are evaluated against the expected results. The maximum of points to score was 15. Figure 3 presents the results for the four person groups. For each group the score for every participant and the average value (the horizontal bar) are shown (the median is always similar to the average). The following observations can be made: • On average, researchers achieved higher scores than students, independent from the configuration used. • Members of group B achieved on average higher scores than members of group A, independent from being researchers or students. • In group A, there are larger deviations from the average value than in group B. • The best participants of each of the four person groups (researchers and students with configuration A and B) achieved similar results.
10
Copyright © Fraunhofer IESE 2006
Experiment
Researchers Group B
100
100
90
90 % of Task Points Scored
% of Task Points Scored
Researchers Group A
80 70 60 50 40 30 20 10 0
70 60 50 40 30 20 10 0
1
2
3
4
5
6
7
1
3
4
Participants
Students Group A
Students Group B
100
100
90
90
80 70 60 50 40 30 20 10 0
5
80 70 60 50 40 30 20 10 0
1
2
3
4
5
6
1
Participants
Figure 3:
2
Participants
% of Task Points Scored
% of Task Points Scored
80
2
3
4
5
6
7
8
9
Participants
Task results – individual results and average
A summary of average values of the tasks points is presented in Table 2. There we can compare the overall performance of participants using configuration A and B. While the former scored on average 42% of the points, the latter scored on average 68%. This means that the effectiveness of the group with configuration B is 63% (Avg. B / Avg. A) higher. This important result supports the claim that significant effort should be spent on the configuration of architecture visualization tools to achieve effectiveness gains in the analysis. Researchers Students Researchers & Students Table 2:
3.2.2
Group A 40.47 32.93 42.05
Group B 76.00 64.47 68.57
Groups A & B 58.24 48.70
Average points for person groups in %
Anomalies in the Data Set It can be considered an anomaly that two participants of group A were not able to accomplish any task. Maybe they did not understand the task description or
Copyright © Fraunhofer IESE 2006
11
Experiment
they are very inexperienced in the areas related to the experiment. However, they did not state this in the pre-briefing or debriefing questionnaire. Our filter tasks were designed exactly for such cases. The filter tasks seem to be well chosen since only participants scoring overall zero points were filtered out. In the visualization questionnaire for the graphical elements students of group A voted averagely higher for some metrics than students of group B. An example is the metric for the question “Do the graphical elements support the distinction among elements of the SAVE model with different meanings?”. Students of group A voted with 3.29, students of group B with 3.11. This is surprising as group A had no visual distinction among systems, subsystems and components while group B had this visual distinction with different figures of the UML notation. 3.2.3
Hypotheses H1 and H2 As there is no statistical evaluation only arguments for the hypotheses H1 and H2 can be given. H1 evaluated the results for basic architecture analyses tasks. As the participants in average stated in the visualization questionnaire that our visualization makes an architecture more comprehensible and reduces the complexity, this is a hint that it also enables these “novices” of that particular architecture to solve the tasks of the architecture exploration. As the time for the participants was aligned to the time of the pilot we can compare the effort needed. The overall results of the tasks are used to measure how effective the participants are. The variation of the task results is quite large, however, we can see that some of the participants achieve results almost as good as the expert working with SAVE and nearly all participants of group B perform better than the expert working without SAVE. Therefore, H1 is supported by the results of the tasks. Different configurations in the different groups led to different results. Thus we assume that the configuration of a visualization strongly affects the results. We assume that it would pay off to invest effort in optimizing the configuration. However, one difficulty is that “the optimal configuration” does not exist. On the one hand this depends on the purpose for which the visualization is to be applied. On the other hand it depends on the preferences and habits of the user. In our group nearly everyone uses his own configuration of the visualization.
Researchers Students Researchers & Students Table 3:
12
Group A 26.57 14.29 23.08
Group B 71.43 43.71 53.57
Groups A & B 49.00 29.00
Average points in task 8 and 10 in %
Copyright © Fraunhofer IESE 2006
Experiment
H2 is evaluated with the results of the transfer tasks number 8 and 10. In Table 3 the results for the two transfer tasks are depicted for the single person groups. It can be seen that in all the groups results were achieved. However, the configuration that was used seems to have a strong impact on the results. Furthermore, the knowledge of the researchers seems to help as well as they achieved by far better results than the students. This means for H2 that it cannot be accepted. Rather we observed that the participants achieved often good results. With respect to the influence of the configuration on the results, the same holds as for H1: A good configuration strongly pushes the quality of the results. 3.2.4
H3 – Visualization Questionnaire Results The personal assessment of the graphical elements by the experiment participants was the basis for verifying H3. We applied the Goal-Question-Metric (GQM [2]) approach to derive the visualization questionnaire to assess the usefulness of the graphical elements (see Table 4 for the GQM goal). One example question for the goal comprehensibility was “Are the graphical elements for components and relations well explained?”. In total, we derived 16 metrics for the comprehensibility goal and 13 for the complexity goal. An ordinal scale with five values was applied ranging from 1 (Not at all) to 5 (Highly). For one goal, we aggregated the average values of all metrics. The results are presented in Table 5 and Table 6. Several observations were made during the analysis of the visualization questionnaire: • The average values for comprehensibility and complexity reduction are very similar for nearly every group investigated. • The results of researchers in groups A and B differ more than the results of students. • On average participants of group B vote higher than participants of group A. • Students mostly vote slightly higher than researchers.
Copyright © Fraunhofer IESE 2006
13
Experiment
Object Purpose Quality Aspect Viewpoint Context
Table 4:
- Single graphical element - Overall visualization Evaluation of the adequacy of graphical elements - Comprehensibility - Complexity reduction User of the visualization Visualization of Software Architecture for: - Architecture understanding - Program comprehension
GQM Goal
Researchers Students Researchers & Students Table 5:
Group B 3.74 3.62 3.66
Groups A & B 3.45 3.56
Group A 3.06 3.50 3.29
Group B 3.67 3.70 3.68
Groups A & B 3.34 3.60
Average values for Comprehensibility
Researchers Students Researchers & Students Table 6:
Group A 3.15 3.48 3.34
Average values for Complexity Reduction
The most significant difference in the voting of group A and group B for a single metric is the measure “How many components are initially shown? Is this number suitable for a first overview?”. Group A voted with 2.69 while group B voted with 4.07. Thus it can be assumed that showing only an excerpt of the architecture at the beginning is appealing to the users. As the results of researchers of group A and group B differ more than for the entire groups A and B they are explored in more detail. The researchers of group B voted with a difference higher than 1.0 compared to the votes of researchers of group A for the following measures: • Additional information on the interactions with the selected component in a tooltip • How many components are initially shown? Is this number suitable for a first overview? • How evident are the points where a reduction of complexity was conducted? • Is it obvious how to interact with the mechanisms for complexity reduction? • Can the additional information offer the details needed?
14
Copyright © Fraunhofer IESE 2006
Experiment
• Is it possible to reach all the parts of the SAVE model with the offered navigation from the starting point? The fact that there are larger divergences in the votes of researchers of groups A and B could be explained with their higher experience in using other architecture visualization tools. The overall results of the visualization questionnaire as shown in Table 5 and Table 6 is a hint to accept H3. Additionally, the results of the analysis tasks as explored above also support H3 as we believe that a better comprehensibility and an appropriate complexity assist in achieving better task results. 3.2.5
Debriefing questionnaires The time given for the tasks (in total 1 hour, no overtime possible) was dimensioned by the pilot study to constitute a realistic situation (i.e., projects usually have tight time constraints). However, a number of participants were not able to accomplish all the tasks and many stated in the debriefing questions that the time was too short. Another question was how realistic the tasks of the experiment were. There were nearly no differences in the answers among groups A and B, and among researchers and students. The average value of all persons is 3.69 which means between ‘fairly’ and ‘well’. Thus it can be assumed that the tasks of the experiment are appropriate as many of the researchers were highly experienced in architecture analyses projects having good knowledge of software architecture and related topics. The difficulty of the tasks seemed to be well-dimensioned given the experimental constraints as there were persons in each group that solved nearly all the tasks (see Figure 3). Another aspect dealt with the ease of use: how pleasant was it to work with the SAVE tool? Here it is interesting to distinguish between the person groups. Table 7 shows that the entire group B finds the visualization more pleasant than group A. This tendency is even stronger comparing only the researchers of group A and group B. Thus, again we find the configuration of the graphical elements as a crucial role. A substantial number of participants mentioned that the introduction to the SAVE visualization was insufficient. Due to the limited time available for each participant it was not possible to provide a detailed user manual explaining all functionality, graphical elements and the Eclipse context. Unfortunately some graphical elements did not seem to be as intuitive as assumed. On the other hand, some participants remarked that graphical elements are missing although they are explicitly explained in the introduction. As a conclusion of this criticism, we decided to provide an integrated online-help for the normal use of the SAVE tool.
Copyright © Fraunhofer IESE 2006
15
Experiment
Researchers Students Researchers & Students Table 7:
Group A 2.43 3.57 3.00
Group B 3.80 3.63 3.69
Groups A & B 3.12 3.60
Average values for 'Pleasant to use'
The participants were also asked for the graphical elements providing high benefits. Many participants emphasized that diverse representations of components and relations offer high benefit. The graphical elements for abstraction purposes like aggregation, collapsing components, and filtering were also mentioned. The bird view was recognized as an important element, too. 3.2.6
Influence of Graphical Elements on the Results We analyzed the influence of single graphical elements that distinguished the groups A and B (see section 3.1.4 for a list of the differences). The identification of hot spots in the example system seemed to benefit from two graphical elements: • Nested containment of components enables the easy identification of different levels of hierarchies. Using containment trees it can become difficult to find the root of the tree due to the number of visible components and the automatic layout (not displaying a visual tree). • Different visual figures for different types of components enable their identification. For instance, subsystems can be easily recognized even in a large amount of components. Some participants even emphasized the visualization of different kinds of components and relations as the highest benefit of the visualization. Relations among components are a particularly important concept in software architectures (also known as simple connectors) so their visualization is crucial. The tasks related to relations support that the graphical element for highlighting the incoming and outgoing relations of the currently selected component facilitated these tasks as it was easier to see the relations’ origin, target and direction. The graphical element Overlay Information Panel was not of major importance in the experiment. The reason might be that the information displayed was related to internals of the SAVE tool, which are not meaningful to the experiment subjects. However, the element could be adapted to offer more appropriate information (e.g., metrics like fan-in and fan-out of a component), which several of the participants would see as an improvement.
16
Copyright © Fraunhofer IESE 2006
Experiment
3.3 3.3.1
Threats to validity Construct Validity The construct validity is the degree to which the settings of the experiment in terms of the dependent and independent variables reflect the goal of the experiment. The following possible threats were identified: • The aspects comprehensibility and reduction of complexity are difficult to measure. The measures we chose are intuitively quite reasonable, but certainly there are other measures. We applied the GQM approach to break down the two aspects into 29 distinct measures. • The configurations we defined are somehow arbitrary. We do not know about the absolute quality of the configurations and we observed that “the optimal configuration” does not exist as it strongly depends on the task at hand and the user itself. We tried to define one configuration providing more graphical elements and one with less graphical elements as we did not know about the influence of single elements and their influence on the results. • The partial conduction of the experiment at FC-MD (3 subjects from there) required a substantial effort for the setup of the Eclipse environment, the preparation of the Eclipse workspaces including the configuration of the SAVE tool. Despite sending over a complete installation package to achieve an easy execution of the experiment over there, technical problems occurred due to an old version of the Java environment. However, these problems affected only the person installing the environment but not the participants. Furthermore there was no direct (face-to-face) support for clarification questions for the participants at FC-MD, but we offered remote support via telephone (which was almost not used). In total (including the IESE site), there were not many questions asked; about half of the participants did not ask any question at all. • How people gain knowledge from visualized information and how they interpret it is strongly based on the person’s background and experience. By randomly assigning the participants to the groups, this effect seems to be controlled as similar average values of participants of groups A and B in the pre-briefing questions on their knowledge resulted. • The time given for the experiment was insufficient for several participants. As all the participants had the same time for solving the tasks this should not affect the results of the evaluation. The purpose of the pilot participant was to find a threshold that can be sufficient for solving the tasks. • We conducted a pilot with two experts in order to find feasible time constraints and to check the appropriateness of the tasks. We are not sure
Copyright © Fraunhofer IESE 2006
17
Experiment
about the absolute expertise of our experts. However, as they performed well in the pilot we are confident that they were suitable as pilots for our experiment. 3.3.2
Internal Validity Internal validity is the degree to which independent variables have impact on dependent variables. The following threats to internal validity are identified: • A selection effect occurs if an inappropriate selection of the groups according to the abilities of the members is done. As the number of participants is quite low such effects are more likely to occur than in environments where there are many participants. In order to avoid this effect the researchers and students were treated separately and randomly assigned to the person groups. In the pre-briefing questionnaire the participants were asked about their skills in the fields related to the experiment, (e.g., architecture, Java, and Eclipse) and, according to their answers, there was not a significant difference of skills between the members of group A and group B. As expected, researchers had higher skills than students justifying their separation. • Participants that are not familiar with Eclipse could have slight problems solving the tasks. However, all the windows and views needed for the experiment were explained and Eclipse is geared to common graphical user interface conventions. The results showed no correlation between the selfestimated Eclipse experience and the task results. • Participants not used to architecture visualization might have a disadvantage. We created the filter tasks to identify participants having problems with the visualization in general. In fact, two participants were filtered out failing the filter task and having no scores at all; all other participants passed the filter tasks and scored at least for some of the tasks.
3.3.3
External Validity External validity is the degree to which the results of the experiment can be transferred to other people and to changed environmental settings. • The participants may be not representative. Most of them were students and they may be not representative for industrial practitioners. To overcome this, a separation between researchers and students was made. If only the performance of professionals is of interest the analysis can be restricted to the researchers as they are experienced in the field of software architecture. • The architecture analysis tasks in the experiment may be not representative. They are constructed for the evaluation of the graphical elements with the
18
Copyright © Fraunhofer IESE 2006
Experiment
idea to explore a real software system for the purpose of architecture comprehension. It is possible that they are too much directed to the graphical elements available in the SAVE. However, the participants assessed the tasks as realistic in the context of architecture analysis as discussed in section 3.2.5.
Copyright © Fraunhofer IESE 2006
19
Related Work
4
Related Work
Rugaber [21] describes the general nature of program comprehension. Panas et al. describe a unified process for program comprehension involving visualization [19]. Visualization tools use different graphical elements (we define graphical elements for software architectures as the concepts and figures used to visualize it. Koschke states visualizations goes hand in hand with functionality [11]. The results of our experiment suggest that the already configuration of graphical elements within the visualization has an impact on the results. Architecture visualization tools incorporate different sets of graphical elements. For instance, SHriMP (Simple Hierarchical Multi-Perspective) applies for visualizing and understanding software the graphical elements “nested graphs”, “aggregation of components and relations”, “filters”, multiple windows including “birdview”, “zooming”, “navigation to the source code”, and “focus highlighting” [22; 23; 25; 26]. Rigi offers “nested graphs” and “filtering” to facilitate easy program comprehension [20]. Further tools supporting reverse engineering and program comprehension are for instance Imagix4D [9] and Bauhaus [3]. All support “coloring” and “focus highlighting” in their respective graphical representation, “layouting” can be done manually or automatically. The configuration of SAVE allows enabling and disabling its graphical elements (which are the above-mentioned and other, see [17] for a complete list). Components and connectors are the elements of architectural views in SAVE and are represented in an UML-based notation. Different colors, styles, and decorations can be assigned to the elements. Fisheye views [6] are a means to focus parts of interest. In the context of the development of the SHriMP tool an experiment was conducted in order to compare different tools for program comprehension. In [23; 24] this experiment with 30 subjects is described. The tools compared are SHriMP, Rigi, and SNiFF+. Different strategies for program comprehension are used in the experiment. As a result of their experiment they propose properties of a tool for program comprehension that alleviate the usage of such a tool. Another experiment comparing the differences of program understanding in visual and textual program representations is given in [18]. Their findings include that visual and textual representations lead to different mental maps of a program and different information is extracted by participants. None of these experiments (and to our knowledge no other published experiment in the field of software architecture) analyzed the impact of configuration of graphical elements on analysis tasks. Furthermore, to our knowledge there are no architecture analysis case studies having the Apache Tomcat as subject system.
20
Copyright © Fraunhofer IESE 2006
Conclusion
5
Conclusion
The architecture is one of the most crucial artifacts in the life cycle of software systems. Once designed, the architecture evolves and is adapted to changed functional or quality requirements and to business or organizational goals. Mostly such changes are not documented, so the understanding of existing architectures becomes an effort-intensive activity of high importance in the evolution and maintenance of large-scale software systems. Tools visualizing software architectures tackle these problems. The experiment we conducted showed the important role the graphical elements of a tool play in supporting architecture analysis tasks. By simply using a configuration that turned out to be more appropriate, participants achieved in average a gain of 63% in the effectiveness. All participants considered the architecture analysis tasks at least as fairly realistic, and we were able to partially capture the role of single graphical elements for the task results. We will continue analyzing the impact of different combinations and additional graphical elements for solving architecture analysis tasks. Another interesting experiment related to the one presented in this paper would be to compare the architecture analyses performance of two other groups: one having graphical support and one having a text-based query language connected to a repository, which contains the same data as it is visualized.
Copyright © Fraunhofer IESE 2006
21
References
References
22
[1]
Apache. (2005). The Jakarta Site - Apache Tomcat. http://tomcat.apache.org/index.html
[2]
Balzer, M., Noack, A., Deussen, O., & Lewerentz, C. (2004). Software Land-scapes: Visualizing the Structure of Large Software Systems. Joint EUROGRAPHICS - IEEE TCVG Symposium on Visualization.
[3]
Bauhaus - Software Reengineering, Programmverstehen und Software Architekturen. (2005). http://www.bauhaus-tech.de
[4]
Beyer, D., Noack, A., & Lewerentz, C. (2003 ). Simple and Efficient Relational Querying of Software Structures In Proceedings of the 10th Working Conference on Reverse Engineering (pp. 216 ): IEEE Computer Society.
[5]
Fjeldstad, R. K., & Hamlen, W. T. (1983). Application Program Maintenance Study: Report to Our Respondents. Philadelphia: Proceedings GUIDE 48.
[6]
Furnas, G. W. (1986). Generalized fisheye views. In Proceedings of the SIGCHI conference on Human factors in computing systems (pp. 16-23). Boston, Massachusetts, United States: ACM Press.
[7]
Holt, R. C. (2002). Introduction to the Grok Programming Language. http://plg.uwaterloo.ca/~holt/papers/grok-intro.doc
[8]
IEEE. (2000). ANSI/IEEE Std. 1471-2000 Recommended Practice for Architectural Description of Software-Intensive Systems.
[9]
Imagix4D. (2005). http://www.imagix.com/products/imagix4d.html
[10]
Knodel, J., Lindvall, M., Muthig, D., & Naab, M. (2006). Static Evaluation of Software Architectures. 10th European Conference on Software Maintenance and Reengineering, Bari, Italy.
[11]
Koschke, R. (2003). Software visualization in software maintenance, reverse enngineering, and re-engineering: a research suvey. Journal of Software Maintenance and Evolution, 15(2), 87-109.
[12]
Koschke, R., & Simon, D. (2003). Hierarchical Reflexion Models. Proc. of the Working Conference on Reverse Engineering, IEEE.
Copyright © Fraunhofer IESE 2006
References
[13]
Krikhaar, R., Postma, A., Sellink, A., Stroucken, M., & Verhoef, C. (1999). A two-phase process for software architecture improvement. International Conference on Software Maintenance (ICSM), Oxford, England.
[14]
Lanza, M. (2003). Object-Oriented Reverse Engineering. University of Bern.
[15]
Maletic, J. I., Leigh, J., Marcus, A., & Dunlap, G. (2001, May 12-13, 2001). Visualizing Object-Oriented Software. Virtual Reality Proceedings of the 9th IEEE International Workshop on Program Comprehension (IWPC'01), Toronto, Canada.
[16]
Murphy, G. C., Notkin, D., & Sullivan, K. J. (2001). Software Reflexion Models: Bridging the Gap between Design and Implementation. IEEE Trans. Softw. Eng., 27(4), 364-380.
[17]
Naab, M., Forster, T., Knodel, J., & Muthig, D. (2005). Evaluation of Graphical Elements and their Adequacy for the Visualization of Software Architectures (IESE Report 078.05/E). Kaiserslautern.
[18]
Navarro-Prieto, R., & Canas, J. J. (2001). Are visual programming languages better? The role of imagery in program comprehension. Int. J. Hum.-Comput. Stud., 54(6), 799-829.
[19]
Panas, T., Löwe, W., & Assmann, U. (2003). Towards the unified recovery architecture for reverse engineering. Int. Conf. on Software Engineering Research and Practice, Las Vegas, USA.
[20]
Rigi. (2005). Rigi - a visual tool for understanding legacy systems. http://www.rigi.csc.uvic.ca/
[21]
Rugaber, S. (1995). Program Comprehension. Encyclopedia of Computer Science and Technology, 35(20), 341-368.
[22]
Storey, M.-A., & Muller, H. A. (1995). Manipulating and documenting software structures using SHriMP views. In Proceedings of the International Conference on Software Maintenance (pp. 275): IEEE Computer Society.
[23]
Storey, M.-A. D., Wong, K., Fracchia, F. D., & Mueller, H. A. (1997). On Integrating Visualization Techniques for Effective Software Exploration. In Proceedings of the 1997 IEEE Symposium on Information Visualization (InfoVis '97) (pp. 38): IEEE Computer Society.
Copyright © Fraunhofer IESE 2006
23
References
24
[24]
Storey, M.-A. D., Wong, K., & Muller, H. A. (1997). How Do Program Understanding Tools Affect How Programmers Understand Programs. In Proceedings of the Fourth Working Conference on Reverse Engineering (WCRE '97) (pp. 12): IEEE Computer Society.
[25]
Systä, T. (1999). On the Relationships between Static and Dynamic Models in Reverse Engineering Java Software. In Proceedings of the Sixth Working Conference on Reverse Engineering (pp. 304): IEEE Computer Society.
[26]
Wu, J., & Storey, M.-A. (2000). A multi-perspective software visualization environment. In Proceedings of the 2000 conference of the Centre for Advanced Studies on Collaborative research (pp. 15). Mississauga, Ontario, Canada: IBM Press.
Copyright © Fraunhofer IESE 2006
Appendix A – Experimental Tasks
Appendix A – Experimental Tasks
1. Open the view “Initial System”. What are the main subsystems in the example? Write down the package names. Filter task, 0 points 2. Which of these subsystems seems to be the biggest one (hot spot)? Why do you assume this? 2 points 3. Which pairs of main subsystems have reciprocal calls and thus a cyclic dependency on this level? 1 point 4. Navigate to the children of the top-level systems and try to get a high-level understanding of the system. There is the component org.apache.catalina.mbeans: Has this component mainly incoming or outgoing relations? 1 point 5. How many source files (.java) do belong to the component org.apache.catalina.connector?
1 point
6. To which components does org.apache.catalina.util have call relations? 2 points 7. Open the view “Catalina Task System” and switch to manual layout. Please create a new view that contains all components of the subsystem org.apache.catalina, but without the subsystem itself. Name this new view “catalina_#”. (Selection of components uses regular expressions (arbitrary sequence of characters: “.*”) 1 point 8. Reorder the layout of org.apache.catalina in your new view in manual layout mode according to the following ideas. The objective is to reorder the architecture of this package into a 3-layer architecture. The grouping is done according to the ratio of incoming to outgoing relations of a component. • Service Layer: #in / #out → 0 • Processing Layer: #in / #out ≈ 1 4 points • Library Layer: #in / #out → ∞ 9. Please create a JPEG image of the diagram showing all the top-level systems and their relations. Save this image with the name “layers_#.jpg” in the actual workspace (location can be seen in the title bar of Eclipse). Filter task, 0 points
Copyright © Fraunhofer IESE 2006
25
Appendix A – Experimental Tasks
10. Open the view “Tomcat Task System”. Looking at the static architectural view only: How does the processing of the network protocol TCP (org.apache.tomcat.util.net) differ from the processing of the web protocol HTTP (org.apache.tomcat.util.http)? 3 points
26
Copyright © Fraunhofer IESE 2006
Document Information
Title:
Understanding Software Architectures by Visualization – An Experiment with Graphical Elements
Date: Report: Status: Distribution:
January 20, 2006 IESE-021.06/E Final Public
Copyright 2006, Fraunhofer IESE. All rights reserved. No part of this publication may be reproduced, stored in a retrieval system, or transmitted, in any form or by any means including, without limitation, photocopying, recording, or otherwise, without the prior written permission of the publisher. Written permission is not needed if this publication is distributed for non-commercial purposes.