Ekbal Rashid et.al / International Journal of Engineering and Technology (IJET)
Understanding the State of Quality of Software on the basis of Time Gap, Quality Gap and Difference with Standard Model Ekbal Rashid #1, Srikanta Patnaik#2, Vandana Bhattacherjee#3 #Dept of CS&E, Cambridge Institute of Technology, Ranchi,India # Dept of CS&E, SOA University, Bhubaneshwar, India #Dept of CS&E, B.I.T. Lalpur, Ranchi, India 1
[email protected] 2
[email protected] 3
[email protected] Abstract—This paper tries to introduce a new mathematical model to understand the state of quality of software by calculating parameters such as the time gap and quality gap with relation to some predefined standard software quality or in relation to some chalked out software quality plan. The paper also suggests methods to calculate the difference in quality of the software being developed and the model software which has been decided upon as the criteria for comparison. These methods can be employed to better understand the state of quality as compared to other standards. In order to obtain the graphical representation of data we have used Microsoft office 2007 graphical chart. Which facilitate easy simulation of time and quality gap. Keywords: Software quality, time gap, quality gap, quality difference I. INTRODUCTION Quality is not an absolute term. Rather, just like other scientific parameters, it should be viewed as something relative, precise and concrete. Even measurement of quality has to be contemplated with the correct approach, which is on the basis of comparison with some specific standard. For instance, what do we mean when we say that something is five meter long. Obviously, we have some standard length, which we call one meter, and when compared to that, our object in discussion in five times that standard length. Similar is the case of measuring other scientific parameters. The comparisons are made with some specific standards which are globally recognized. However in the case of software engineering, quality measures do not have globally recognized concrete values. There are set of standards defined by the IEEE as to how a software quality should be estimated. Only when some concrete software has been identified as the measuring standard, can we precisely calculate the quality of any software by comparing it to that given standard. This paper outlines the possible comparison parameters to understand the state of quality of software on the basis of such a comparison. The parameters that have been used are novel ideas and have not been previously used in the realm of software engineering. Moreover, an attempt has been made to chalk out a mathematical model, and a concrete strategy so as to precisely determine the quality of the software being developed. As elucidated earlier, the basis of quality determination is chiefly by drawing out an analogy between what is being developed and what is already developed. Although the author considers that an international standard has to be established, regarding this quality, unless that is achieved, we can define our own standards in our own institutes and organizations and use the methods given herewith to determine concretely the state of quality of the software being developed. The mathematical methods employed are very basic and can be used by any ordinary person. The parameters and terms may be enriched and advanced to form newer concepts and ideas. On the whole after the required comparisons have been made and the particular understanding of the quality has been achieved, decisions can be taken suitably to augment the proper and rapid quality software development. II. RELATED WORKS Whenever we talk about quality, we talk about the defects in the software. So the method of determining the quality of software is inexorably linked to the ideal of software testing. There are many methods employed in software testing such as – on the basis of thousand lines of code, on the basis of per hundred hours of development time, on the basis of per hundred tests conducted[1] There are works regarding the technique and framework to measure the quality of software. This technique leverages technology that automatically analyzes 100% of the paths through a given code base, thus allowing a consistent examination of every possible outcome when running the resulting software. Using this new approach to measuring quality, there has been a target to
ISSN : 0975-4024
Vol 5 No 3 Jun-Jul 2013
2821
Ekbal Rashid et.al / International Journal of Engineering and Technology (IJET)
give visibility into how various open source projects compare to each other and suggest a new way to make software better [2]. There have been study where the research objective is to build a parametric model which utilizes a persistent record of the validation and verification (V&V) practices used with a program to estimate the defect density of that program. The persistent record of the V&V practices are recorded as certificates which are automatically recorded and maintained with the code[3]. There has been the attempt to make analogy-based software quality estimation with project feature weights. The objective of such research is to predict the quality of project accurately and use the results in future predictions [4]. In-process quality metrics are less formally defined than end-product metrics, and their practices vary greatly among software developers. On the one hand, in-process quality metrics simply means tracking defect arrival during formal machine testing for some organizations. On the other hand, some software organizations with well-established software metrics programs cover various parameters in each phase of the development cycle [5]. It is especially in context of the last idea that this paper has been designed. The target is to achieve the quality during the development process and that has been explained in the section of objectives as below. Rashid et. al emphasized on the importance of software quality estimation [6].The rest of the paper is organized as follows: section 2 gives brief overview of the various related work, section 3 describes the objective, section 4 describes the methodology. In section 5 we describe the analysis in detail, Section 6 presents the conclusion. III. OBJECTIVE The objective of the paper is to calculate precisely the status of the software during the course of its development. This objective is further linked to the focus of trying to analyze whether the development process is on the right track. If the development process is not proceeding as per the expected lines, corrective or remedial measures may be undertaken to bring it back on the desired track. The concrete quality measurement is not the quality of the end product. Rather it is the quality of the software at various stages. Normally, the final quality is talked about more in the domain of Software Engineering. However, we have to understand that the final quality can only be achieved if the intermediate quality levels are assured. Especially if we follow a model of Software development such as the Bohem’s Spiral Model, where there are consistent checks at regular stages to see if the software is developing on the required lines or not, the method given in the present paper will prove to be very useful. This method will also prove to be effective in all forms of iterative models of software development. The paper also fulfils the objective of defining the necessary metrics to make the above measurements. A new idea is certainly accompanied by newer metrics. If one has to use these ideas, that is bring them into proper application, he has to make use of the newer metrics. However, they have to be understood in connection to other metrics. So all the metrics that have been used in this paper have been defined and their significance explained therein. This paper also has the objective to present an alternative mathematical model and a very simple one so as to enable the organizations take decisions in the right direction. IV. METHODOLOGY The measurement of software quality has been done on an analogy basis. The following gives the steps in the process: 1. First there should be a quality function related to the type of software being developed. This quality function should be a function of time. This quality function can be decided either by any international body (only then can the measurement be universalized) or by any organization interested in determining the quality of the software at various phases of software development. To put it more elaborately, we can have a separate quality function for a particular type of software. To decide what this quality function should be, one has to go back and trace the history of development of similar types of software developed in accordance to the principles and methods laid out in the IEEE standards. The quality function can be linear or polynomial depending upon the complexity of the software and upon the known history of its development. How do we arrive at this function? We have shown the method to arrive at such a standard function by using some imaginary data. Let us assume for the sake of simplicity that it takes twelve months to develop some typical software and the quality of the software develops as shown below. See Table 1.
ISSN : 0975-4024
Vol 5 No 3 Jun-Jul 2013
2822
Ekbal Rashid et.al / International Journal of Engineering and Technology (IJET)
Table 1
Time (in months)
Quality
0 1 2 3 4 5 6 7 8 9 10 11 12
0 5 8 11 14 17 20 23 26 29 32 35 38
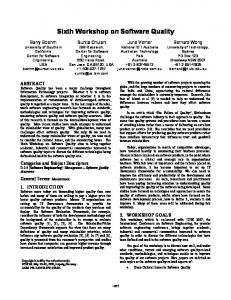
We can plot the graph of quality versus time with the help of the above data as shown below in Figure 1. 40
quality of software
35 30 25 20 15 10 5 0 1
2
3
4
5
6
7
8
9 10 11 12
months
graph of quality versus time Figure 1
The quality function then can be easily determined which will be as under for the given data. 3 2 2. Next we should collect the data for the software being developed. On the basis of the data for the software being developed we can plot the points on the same graph. There is less possibility that this graph will be linear or of any regular form. Let us assume that the quality of software being developed is improving as per the following data. See Table 2.
ISSN : 0975-4024
Vol 5 No 3 Jun-Jul 2013
2823
Ekbal Rashid et.al / International Journal of Engineering and Technology (IJET)
Table 2
Time months) 1 2 3 4 5 6 7 8 9 10
(in
Quality 3 6 8 9 10 13 14 17 20 22
On the basis of the above data we can plot a graph shown in Figure 2. 40 quality of software
35 30 25 20 15 10 5 0 1 Legend: Standard software: Software being developed:
2
3
4
5
6
7
8
9 10 11 12
months graph of quality versus time Figure 2.
3. Next we calculate the quality gap. For this, at a particular point of time we identify the quality of the standard software (q1) and then from the graph of the standard software we draw a line vertically from that point to reach the graph of the software being developed. We then identify the quality of the software being developed (q2) corresponding to this point. Then the relation q1 – q2 gives the quality gap. As an example, we have taken the above data to calculate the quality gap between the software being developed and the standard software available with us for comparison. We are calculating the quality gap just after six months of software development work has been completed. We can also do the same from the data given. We see that the quality of the standard software at six month time point is 20 while the software being developed has reached quality of 13 after six months. Then we can say that the quality gap at six months is 7. This fact is being illustrated in Figure 3
ISSN : 0975-4024
Vol 5 No 3 Jun-Jul 2013
2824
Ekbal Rashid et.al / International Journal of Engineering and Technology (IJET)
Figure 3
4. Next we calculate the time gap. In order to calculate the time gap, we first pick a particular quality value of the standard software for which we want to calculate the time gap. Next, we identify the time (t1) at which the standard software had acquired that quality and also the point on the graph of the standard software corresponding to that particular quality. We then draw a horizontal line to meet the graph of the software being developed. Where the line meets the graph of the software being developed, we identify the corresponding time (t2). Then t1 – t2 gives the time gap between the two for the particular stage of quality. As for example, we have identified the time when the standard software acquires the quality 20 as 6 months. For the same quality we see that the software being developed is taking 9 months. So for the quality level 20, we say that the time gap is 3 months. This fact has been illustrated in Figure 4. The time gap between the standard software and the software being developed has been shown illustratively. In the same manner we can tabulate a series of data showing the quality gap at a particular time of software development and the time gap at a particular level of quality as parameters of comparison. 5.
Figure 4
6. The difference between the standard software and the software being developed can be found out on the concept of the Euclidian distance or the Manhattan distance. For this we first identify two points in the two graphs. We simply use the x and y coordinates of the two points and the understanding of distance between two points in a Cartesian plane to find the difference between the two points. The expressions for calculating the distance between the two points are as given below: dist (p1,p2)=[(x2-x1)2 + (y2-y1)2]1/2 A small distance indicates a high degree of similarity [4]. Similarly a bigger distance indicates a larger difference between the two. The difference between the two points in the example being used here is shown in the following illustration. See Figure 5.
ISSN : 0975-4024
Vol 5 No 3 Jun-Jul 2013
2825
Ekbal Rashid et.al / International Journal of Engineering and Technology (IJET)
Figure 5
V. HYPOTHESIS On the basis of the above parameters we can estimate the direction which the software being developed is taking. This will help us estimate the state of quality of the software being developed. The quality gap between the standard software and the software being developed helps us to understand how much more effort needs to be put in terms of removing defects and improving code quality. More the quality gap, more is the amount of effort needed to be put in this regard. The time gap between the standard software and the software being developed shows us how much the software being developed is lagging behind the standard software in terms of time. More the time gap, more is the effort needed in terms of quickening the process of software development. If necessary the number of software development personnel has to be increased in order to match the standard quality. In this way we can say that the quality gap speaks qualitatively about the software. The quality of the software developers have to be improved to bridge that gap. On the other hand, the time gap speaks quantitatively about the software. The number of software developers need to be increased in order to bridge the gap with respect to the standard software. The difference between the standard software and the software being developed gives the overall view about the status of the quality of the software being developed. It helps us in understanding the overall effort needed in terms of achieving a particular quality of standard software. VI. CONCLUSION This paper deals about the status of the quality of the software that is being developed. The importance of the work lies in the fact that the parameters that have been introduced here give a clear picture about the qualitative and the quantitative states of the software stage. The parameters can be used for other kinds of software analysis as determining how much effort needs to be put in as regards to which aspect to improve the quality of the software. Only when we compare the software with any particular standard can this be made possible. For this reason we stress upon the necessity of having an international standard of various types of software that are typically being developed nowadays. It would be better to express the standards as functions of time so that the comparisons can be easily made. The conceptions used here are significant as they can be further enhanced to develop newer understandings about the quality. Here we have taken development time in terms of number of month. For smaller software, we can take the development time in terms of number of days. We can also review the concept by using number of software developers instead of taking the number of months for software development. Then we shall be calculating some other parameters instead of time gap but then the parameter quality gap would remain. Only this time it would be in terms of number of working hands instead of being calculated with respect to time. The above mentioned parameters as well as the significance of the ratio between the quality gap and time gap are areas for future work. They need to be studied and hypnotized separately as a separate piece of research work.
ISSN : 0975-4024
Vol 5 No 3 Jun-Jul 2013
2826
Ekbal Rashid et.al / International Journal of Engineering and Technology (IJET)
REFERENCES [1] [2] [3] [4] [5] [6]
Srinivasan Desikan, Gopalaswamy Ramesh, Software Testing, Principles and Practices Pearson, 2012, pg 444-450. Ben Chelf Measuring Software quality, A study of Open Source Software, Coverity, Chief Technology Officer Coverity, Inc. Mark Sherriff and Laurie Williams Defect Density Estimation Through Verification and Validation North Carolina State University Raleigh, NC, USA 27695 {mssherri, lawilli3}@ncsu.edu). Ekbal Rashid, Srikanta Patnaik, Vandana Bhattacharya. Analogy-based Software Quality Prediction with Project Feature Weights, American Journal of Software Engineering and Applications. Vol. 2, No. 2, 2013, pp. 49-53. doi: 10.11648/j.ajsea.20130202.14 Stephen H. Kan Metrics and Models in Software Quality Engineering, second edition by Addison Wesley pg.100. Ekbal Rashid, Srikanta Patnaik, Vandana Bhattacherjee “A Survey in the Area of Machine Learning and Its Application for Software Quality Estimation” has been published in ACM SigSoft ISSN 0163-5948, volume 37, number 5, September 2012, http://doi.acm.org/10.1145/2347696.2347709 New York, NY, USA.
ISSN : 0975-4024
Vol 5 No 3 Jun-Jul 2013
2827