and complete support throughout the past years, and who always ... Pat, Greg, Derek and Johnathan McDermid ...... of their interactions with their environmentâ (Malingreau and Belward 1992). ...... A Workbook for using SpaceStat in the.
UNIVERSITY OF CALGARY
Using Landsat TM and IRS imagery to Detect Seismic Cutlines: Assessing their Effects on Landscape Structure and on Grizzly Bear (Ursus arctos) Landscape Use in Alberta
by Julia Linke
A THESIS SUBMITTED TO THE FACULTY OF GRADUATE STUDIES IN PARTIAL FULFILLMENT OF THE REQUIREMENTS FOR THE DEGREE OF MASTER OF SCIENCE
DEPARTMENT OF GEOGRAPHY
CALGARY, ALBERTA AUGUST, 2003
© Julia Linke
THESIS COMMITTEE APPROVAL PAGE
UNIVERSITY OF CALGARY FACULTY OF GRADUATE STUDIES
The undersigned certify that they have read, and recommend to the Faculty of Graduate Studies for acceptance, a thesis entitled “Using Landsat TM and IRS imagery to Detect Seismic Cutlines: Assessing their Effects on Landscape Structure and on Grizzly Bear (Ursus arctos) Landscape Use in Alberta” submitted by Julia Linke in partial fulfillment of the requirements for the degree of Master of Science in Geography
___________________________________________________ Supervisor, (Dr. Steven E. Franklin, Department of Geography)
________________________________________________________________ (Dr. Mryka Hall-Beyer, Department of Geography)
_________________________________________________________________ (Dr. Mary Reid, Department of Biological Sciences)
__________________________ Date
ii
ABSTRACT Besides providing habitat to the grizzly bear, the Rocky Mountain Foothills of Alberta include considerable seismic oil and gas exploration. Seismic cutlines have long been introduced to this landscape, however their effects on habitat structure and on landscape use of grizzly bears remained yet to be quantified. Using high resolution, panchromatic IRS satellite imagery, seismic cutlines were mapped inside the Foothills Model Forest Grizzly Bear Research Project Area south of Hinton, Alberta with an overall accuracy of 88%. The impacts of cutline densities on grizzly bear habitat structure were measured using landscape metrics meaningful for the distribution of grizzly bears. Principal Component Analysis was used to identify the parsimonious set of landscape metrics required to describe and quantify the spatial pattern of the foothills landscape. Seismic cutline densities directly affect four out of five investigated landscape metrics (edge density, mean patch size, mean nearest neighbour, and coefficient of variation in mean nearest neighbour). Cutline densities and landscape structure were also related to grizzly bear landscape use using Poisson family Generalized Linear Models. While seismic cutlines do not directly predict grizzly bear landscape use, the habitat structures they create are important predictors of grizzly bear landscape use.
iii
ACKNOWLEDGEMENTS I am grateful to my supervisor, Steven Eric Franklin, who always donated his guidance and complete support throughout the past years, and who always encouraged me to pursue the many scientific questions I stumbled upon. During the course of my thesis work, I consulted and collaborated with many wonderful researchers. I thank G. Stenhouse for his collaboration, for all bear biology conversations, and for the field support during the past three years. I am thankful to Marie Josee Fortin for sharing her expertise regarding spatial point pattern analyses. Kevin McGarigal and Rob Rempel are thanked for communications and collaborations regarding landscape structure assessment. Stefania Bertazzon’s office door was always open for my many statistical questions, which was tremendously valued. I thank Peter Ehlers for his great help in modeling non-linear statistical regressions. Darren Bender, Graham Forbes, Mryka Hall-Beyer, and Michael Lavigne are appreciated for their contributions to this study. I also thank Mark Boyce, Rich Harris, Melissa Hart, Scott Nielsen, and one anonymous reviewer for constructive comments on parts of my research, which improved my work. For technical support, I thank Julie Dugas, Medina Hansen, Yvonne Martin, Greg McDermid, Kirk Montgomery, Jasper Stoodley, and the Geography Department of the University of Calgary. After a computer hard drive failure three weeks before completion of this thesis, the company TECHSQUAD in Calgary spent much effort in retrieving all important thesis documents and data. Tremendous thanks are extended to them. Infinite thanks go to Sophia Anna Linke who loyally went to daycare the many days I worked on my thesis, and to Falk Huettmann, who did not only stimulate me to develop
iv
research ideas and strategies, but who always supported me with his love and encouraged me to follow my path in difficult times. I also thank my sister, Kathrin Welte, for always being my best friend. Thanks also are extended to Annelise Krah, Lisa Welte, the Presse Family, and the Hűttmann Family for all their support. I am thankful for the close friendships I have developed during my time in Calgary. Sharon, Ulrik, Benjamin and Eve Seward invited me to stay with their home for the first few months in Calgary, which I will always be grateful for. The friendship that was started three years ago will always be treasured. Pat, Greg, Derek and Johnathan McDermid hosted many wonderful dinners, parties, trips and they always offered helping hands, which will remain unforgettable. This thesis was supported by a National Science and Engineering Research Council (NSERC) PGS A scholarship with Canadian Forest Service Supplement, an Alberta Ingenuity Award, a University of Calgary Graduate Program Travel Award, and a Graduate Student Association Travel Award. This research was carried out as part of the Foothills Model Forest Grizzly Bear Research Project, which was funded by an NSERC Collaborative Research and Development Grant, and by all Foothills Model Forest Grizzly Bear Project Sponsors.
v
DEDICATION I dedicate this thesis to my parents, Eva Linke-Welte and Siegfried Welte, and to my deceased father, Guenter Linke. They provided me a solid foundation from where I could reach and accomplish my dreams and aspirations. I am thankful for all their support and love.
vi
TABLE OF CONTENTS THESIS COMMITTEE APPROVAL PAGE........................................................................ ii ABSTRACT.......................................................................................................................... iii ACKNOWLEDGEMENTS.................................................................................................. iv DEDICATION...................................................................................................................... vi TABLE OF CONTENTS..................................................................................................... vii LIST OF TABLES................................................................................................................. x LIST OF FIGURES ............................................................................................................. xii LIST OF ABBREVIATIONS............................................................................................. xiv 1 INTRODUCTION .............................................................................................................. 1 1.1 Research Objectives and Strategies ............................................................................. 6 1.1.1 Seismic Cutline Mapping ..................................................................................... 6 1.1.2 Parsimonious Landscape Metrics........................................................................ 6 1.1.3. Relationships between Seismic Cutlines and Landscape Metrics ...................... 8 1.1.4 Effects of Seismic Cutlines and Landscape Structure on Grizzly Bear Landscape Use ................................................................................................................................. 8 1.2 Study Area ................................................................................................................... 9 1.3 Organization of the Thesis......................................................................................... 12 2 GRIZZLY BEAR LANDSCAPE STRUCTURE: TECHNIQUES AND ECOLOGY.... 13 2.1 Basic Remote Sensing Mapping Techniques............................................................. 13 2.1.1 Image Fusion ...................................................................................................... 13 2.1.2 Classification Techniques ................................................................................... 16 2.2 Landscape Metrics as Measures of Spatial Structure ................................................ 19 2.3 Scale Issues in Remote Sensing and Wildlife Ecology ............................................. 23 2.3.1 Temporal Scale ................................................................................................... 24 2.3.2 Spatial Scale ....................................................................................................... 25 2.3.3 Scale Effects........................................................................................................ 27 2.3.4 Dealing with Scale: Research Design and Interpretation .................................. 28 2.4 Grizzly Bear Life History, Distribution, Habitat and Anthropogenic Effects ........... 30 3 METHODS ....................................................................................................................... 35 3.1 Seismic Cutline Mapping........................................................................................... 35 3.1.1 Research Design ................................................................................................. 35 3.1.2 Imagery, Spatial Extents and other Mapping Data Sources .............................. 35 3.1.3 Vegetation Seismic Mask. ................................................................................... 38 3.1.4 Manual Digitizing ............................................................................................... 38 3.1.5 Classification-based Mapping ............................................................................ 41 3.1.6 Map Accuracy, Field Data Collection and Analysis .......................................... 42 3.1.6.1 Field-based Accuracy Assessment............................................................... 42 3.1.6.2 Field Data Collection for Omitted versus Mapped Cutline Segments......... 44 3.1.6.3 Statistical Analysis of Field Data................................................................. 46 3.2 Landcover Baseline Maps for Landscape Structure Quantification .......................... 50 3.3 Landscape Structure Quantification........................................................................... 53
vii
3.4 Parsimonious Landscape Metrics .............................................................................. 55 3.4.1 Research Design ................................................................................................. 55 3.4.2 Statistical Techniques ......................................................................................... 57 3.4.2.1 Class-level Metrics ...................................................................................... 57 3.4.2.1 Landscape-level Metrics .............................................................................. 59 3.5 Relationships between Seismic Cutlines and Landscape Structure........................... 61 3.5.1 Research Design ................................................................................................. 61 3.5.2 Analysis Techniques............................................................................................ 66 3.6 Effects of Seismic Cutlines and Landscape Structure on Grizzly Bear Landscape Use ......................................................................................................................................... 68 3.6.1 Research Design ................................................................................................. 68 3.6.2 Grizzly Bear Data ............................................................................................... 69 3.6.2.1 Grizzly Bear Location Data ......................................................................... 69 3.6.2.2 Spatial Autocorrelation as Indication for Scale of Analysis........................ 71 3.6.2.3 Grizzly Bear Landscape Use........................................................................ 71 3.6.3 Landscape Features............................................................................................ 73 3.6.4 Statistical Analysis.............................................................................................. 74 4 RESULTS AND ANALYSIS........................................................................................... 76 4.1 Explorative Seismic Cutlines..................................................................................... 76 4.1.1 Digitized Map ..................................................................................................... 76 4.1.1.1 Accuracy Assessment .................................................................................. 76 4.1.1.2 Field Characteristics of Omitted Cutline Segments..................................... 80 4.1.2 Map of Classification Origin .............................................................................. 84 4.2 Parsimonious Landscape Metrics .............................................................................. 87 4.2.1 Class-level Parsimonious Landscape Metrics.................................................... 87 4.2.2 Landscape-level Parsimonious Landscape Metrics ........................................... 91 4.2.3 Parsimonious Landscape Metrics compared to other Studies............................ 92 4.3 Relationships between Seismic Cutlines and Landscape Metrics ............................. 95 4.3.1 Metric Responses to Cutlines in Binary, Simulated Landscapes........................ 95 4.3.1.1 Edge Density................................................................................................ 95 4.3.1.2 Mean Patch Size........................................................................................... 97 4.3.1.3 Variation in Mean Patch Size ...................................................................... 97 4.3.1.4 Mean Nearest Neighbour Distance ............................................................ 100 4.3.1.5 Variation in Mean Nearest Neighbour Distance........................................ 101 4.3.2 Metric Responses to Cutlines in Foothills DGBH Sub-Landscapes................. 103 4.3.2.1 Edge Density.............................................................................................. 103 4.3.2.2 Mean Patch Size......................................................................................... 106 4.3.2.3 Variation in Mean Patch Size .................................................................... 106 4.3.2.4 Mean Nearest Neighbour Distance ............................................................ 111 4.3.2.5 Variation in Mean Nearest Neighbour Distance........................................ 113 4.4 Effects of Seismic Cutlines and Landscape Structure on Grizzly Bear Landscape Use ....................................................................................................................................... 116 4.4.1 Population-level Landscape Use ...................................................................... 116 4.4.2 Gender-specific Landscape Use ....................................................................... 118 4.4.3 Discussion of Model Results ............................................................................. 118
viii
5 SUMMARY AND CONCLUSIONS ............................................................................. 124 5.1 Summary.................................................................................................................. 124 5.2 Conclusions.............................................................................................................. 127 5.2.1 Seismic Cutline Mapping .................................................................................. 127 5.2.2 Parsimonious Landscape Metrics..................................................................... 128 5.2.3 Relationships between Seismic Cutlines and Landscape Metrics .................... 129 5.2.4 Effects of Seismic Cutlines and Landscape Structure on Grizzly Bear Landscape Use ............................................................................................................................. 130 5.3 Future Research ....................................................................................................... 130 6 REFERENCES ............................................................................................................... 133 7 APPENDICES ................................................................................................................ 143 7.1 Appendix 1: Computation of field data as predictors of seismic cutline segments. 143 7.2 Appendix 2: List of 49 class-level (C) and 54 landscape-level metrics computed in this thesis from the reclassified landcover maps (List adapted from Cushman et al in review). .......................................................................................................................... 144 7.3 Appendix 3: Contrast Weights, Landcover Similarity Values, and Landcover Edge Depths using the GIDTAF map as example. ................................................................. 146 7.3.1 Appendix 3a) Landcover Contrast Weights ...................................................... 146 7.3.2 Appendix 3b) Landcover Similarity Values ...................................................... 146 7.3.3 Appendix 3c) Landcover Edge Depths (m) ....................................................... 147 7.4 Appendix 4: Formula and general description of landscape metrics (McGarigal and Marks, 1995, McGarigal et al. 2002) used in the investigations of a) relationships between seismic cutlines and landscape metrics, and of b) effects of cutlines and landscape structure on grizzly bear landscape use (superscript letters describe which metric was used in which investigation)........................................................................ 148
ix
LIST OF TABLES Table 1 Landcover type reclassifications of the Integrated Decision Tree Approach (IDTA) map: a) Detailed Grizzly Bear Habitat map (DGBH), b) Broad Grizzly Bear Habitat Map (BGBH), c) Generalized Integrated Decision Tree Approach Foothills (GIDTAF) Map. ............................................................................................................................. 51 Table 2. Sex, age, number of GPS locations, exposure to human use related to resource extraction, and 100% minimum convex polygon (MCP) home range sizes for each GPS collared grizzly bear located within the foothills area of the Bear Research Project during early summer (June 1 - July 31) of 1999 and 2000.............................. 70 Table 3 Densities of manually digitized Explorative Seismic Cutlines across Bear Management Units of the Foothills Area..................................................................... 76 Table 4 Accuracy Assessments of manually digitized explorative seismic cutline map and of ACCESS explorative seismic map. ......................................................................... 78 Table 5 Accuracy assessment sampling effort inside the foothills area stratified per image tile. ............................................................................................................................... 79 Table 6 Coefficients (β), standard errors (SE), p-values (p), residual deviance, and degrees of freedom of step-AIC (Venables and Ripley, 1994) selected binary Generalized Linear Models from three sets of field predictors, collected in Summer 2001 along sampling lines inside the test area, each explaining the presence or absence of a manually digitized cutline segment ('digitized point' vs. 'digitizing gaps' respectively). ..................................................................................................................................... 81 Table 7 Distribution of AIC-selected GLM predictors of omitted (n=24) and mapped cutline segments (n=86), showing minimum, mean (χ), standard error (SE) and maximum, from field data collected in Summer 2001 inside the test area of the foothills. ....................................................................................................................... 83 Table 8 Principal Component clusters (metric groups), identified through partial Principal Component and Clustering Analysis on 49 class-level configuration metrics across 8 GIDTA landcover types of the extended foothills area, with their respective universality, consistency and strength. Meaning of each cluster was provided by the metric group name, listing also the largest positive and negative loadings. Consistency was assessed against the average of all within cluster correlations across all classes being 0.74. Universal and consistent metric groups were highlighted forming the minimum set of class-level metric groups to be used within this study area. Unique metric groups were italicized, and low consistency metric groups appeared in normal font. (* indicates fundamental metric groups as identified by Cushman et al. in review, ** landcover type number explained in Table 1c)............. 88
x
Table 9 Six significant principal components, or metric groups, of 54 landscape-level configuration metrics from the extended foothills area GIDTA map, as retained from partial principal component analysis. Components were ordered by their explanatory power (percent explained variance). Meaning of each component was provided by the metric group name, listing also the largest positive and negative loadings (* indicates fundamental metric groups as identified by Cushman et al. in review). ..................... 91 Table 10 Explanatory model parameters, showing equations, degrees of freedom, significance, coefficients, standard error (SE), 95% confidence limits, pseudo-r2, sampled data range, and model generalizability of cutline induced changes in landscape metrics over 104 DBGH sub-landscapes (please see chapter 4.3.1 for equation details)......................................................................................................... 105 Table 11 Distribution of landscape structure variables, showing minimum, mean (χ), standard error (SE) and maximum, over all sub-landscapes within the sample population-level (n = 72 sub-landscapes), the female sample population-level (n = 61 sub-landscapes), and the male sample population-level analysis (n = 35 sublandscapes)................................................................................................................. 116 Table 12 Explanatory model parameters, showing residual deviance, degrees of freedom, significance, coefficients (β) and standard error (SE) of model variables, for early summer grizzly bear landscape use at the population level, the female population level, and the male population level. ......................................................................... 117
xi
LIST OF FIGURES Figure 1 Seismic cutlines within a sub-section (NTS map sheet 83F16) of the Alberta Foothills in a) a 30 m resolution 1998 Landsat TM image and in b) a 5.6 m panchromatic Indian Remote Sensing Image. ............................................................... 7 Figure 2 Core Foothills Study Area in context of the Foothills Model Forest (FMF) Grizzly Bear Research Project Area, the Extended Foothills Area, Bear Management Units, major towns, and terrain. ............................................................................................. 10 Figure 3 Indian Remote Sensing Image tile stratification of Core Foothills Area. ............ 36 Figure 4 ACCESS seismic cutlines inside the Core Foothills Area. ................................... 39 Figure 5 Test area example of a) vegetation mask and corresponding b) IDTA landscover map............................................................................................................................... 40 Figure 6 Stratification of Sampling Lines within the Test Area and the Core Foothills Area.............................................................................................................................. 43 Figure 7 Protocol for systematic field plots showing a) location along sampling line, b) sampling details, and c) collected data. ....................................................................... 45 Figure 8 Example of linear interpolation of location of field plots to seismic map. .......... 47 Figure 9 Landcover maps of the year 1999 for the FMF grizzly bear project area using three different reclassification schemes on the a) IDTA map: b) Detailed Grizzly Bear Habitat Map, c) Broad Grizzly Bear Habitat Map, and the d) Generalized Integrated Decision Tree Approach Foothills map. ...................................................................... 52 Figure 10 Stratification of the Extended Foothills Area into 5.4 x 5.4 km sub-landscapes for the purpose of the parsimony analysis based on the GIDTAF map....................... 56 Figure 11 Stratification of the DGBH map inside the Core Foothills Area into 2300 ha large hexagons. ............................................................................................................ 63 Figure 12 Simple simulations of hypothetical, binary landscapes with increasing fragmentation level, and of cutline densities. .............................................................. 64 Figure 13 Original configuration of simulated binary landscapes, showing their initial edge density, mean patch size, coefficient of variation, mean nearest neighbour distances and coefficient of variation of mean nearest distances. ............................................... 65
xii
Figure 14 Stratification of the Core Foothills Area into movement scale (8.7 km diameter), hexagon-shaped sub-landscapes and corresponding density of collared grizzly bear use points in relation to available area during early summer of a) 1999 and b) 2000. 72 Figure 15 Manually digitized explorative seismic cutlines inside the Core Foothills Area stratified into Bear Management Units........................................................................ 77 Figure 16 K-means cluster membership within seismic and non-seismic class: a) all clusters occur in each class, but b) about half of the clusters have higher relative membership in seismic class........................................................................................ 85 Figure 17 Two K-means clustering mapping results in the clear area of test area: In first result, a) cutlines were mapped using all clusters with higher relative seismic membership, where b) most cutlines were detected but also much mis-classification occurred, whereas in the second results, c) cutlines were mapped using only threshold clusters, with fewer mis-classification errors, but with less continuous coverage of cutlines. ........................................................................................................................ 86 Figure 18 Effects of simulated cutline densities on selected landscape metrics, such as a) edge density, b) mean patch size, c) coefficient of variation in mean patch size, d) mean nearest neighbour distance, and e) coefficient of variation in mean nearest neighbour distance, across seven, simulated binary landscapes. ................................. 96 Figure 19 Effects of seismic cutline densities and initial edge density on change in edge density as a) observed across 104 DGBH sub-landscapes, and as b) predicted from model fitting............................................................................................................... 104 Figure 20 Effects of seismic cutline densities and initial mean patch size on change in mean patch size as a) observed across 104 DGBH sub-landscapes, and as b) predicted from model fitting...................................................................................................... 107 Figure 21 Observed change in coefficient of variation in mean patch size across 104 DGBH sub-landscapes in relation to a) seismic cutline densities and initial coefficient of variation in mean patch size and in relation to b) observed change in largest patch index........................................................................................................................... 109 Figure 22 Display of DGBH Foothills Sub-landscapes a) # 247 and b) # 277................. 110 Figure 23 Effects of seismic cutline densities and initial mean nearest neighbour distance on change in mean nearest neighbour distance as a) observed across 104 DGBH sublandscapes, and as b) predicted from model fitting. .................................................. 112 Figure 24 Effects of seismic cutline densities and initial coefficient of variation in mean nearest neighbour distance on change in coefficient mean nearest neighbour distance as a) observed across 104 DGBH sub-landscapes, and as b) predicted from model fitting.......................................................................................................................... 114
xiii
LIST OF ABBREVIATIONS
Abbreviation
Complete name
Area_MN
Mean Patch Size
Area_CV
Coefficient of Variation in Mean Patch Size
BMU
Bear Management Unit
BGBH
Broad Grizzly Bear Habitat
ED
Edge Density
DGBH
Detailed Grizzly Bear Habitat
GIS
Geographic Information System
GIDTAF
Generalized Integrated Decision Tree Approach in Foothills
GLM
Generalized Linear Model
GPS
Global Positioning System
IDTA
Integrated Decision Tree Approach
JNP
Jasper National Park
FMF
Foothills Model Forest
LPI
Largest patch Index
MNN_MN
Mean Nearest Neighbour Distance
MNN_CV
Coefficient of Variation in Mean Nearets Neighbour
MSI
Mean Shape Index
SIEI
Simpson Evenness Index
TM
Thematic Mapper
xiv
1 INTRODUCTION The Rocky Mountain Foothills of Alberta, Canada provide habitat for grizzly bears (Ursus arctos) and other wildlife. However, this area also hosts considerable mining, seismic oil and gas exploration, forest harvesting activities, and recreational activities, which inherently influence the configuration and composition of the natural landscape. In the process of conventional oil and gas exploration, a dense network of 5-10 m wide seismic cutlines is created. The seismic cutlines consist of explorative lines, which are straight lines used for oil and gas exploration, and of exploitative lines, which are generally wider, curvy, access lines used as entry to oil and gas well sites. Regeneration rates on these cutlines appear to be much lower than in forestry clear cuts, or might even be prevented by off-road vehicle use (Revel et al. 1984). These cutlines dissect contiguous landscape components, or patches, thereby fragmenting this landscape. However, these fragmentation effects are yet to be quantified or assessed. Other human activities, such as forest harvesting, shape the landscape structure in direct ways, but also in indirect ways, for instance through the addition of roads (Reed et al. 1996, McGarigal et al. 2001). Managing the foothills grizzly bear population within this dynamic, multi-use landscape requires greater understanding of their habitat use within the landscape (Nielsen et al. 2002a) and the influences that landscape structure may have on such use. It is in this context that the Foothills Model Forest (FMF) Grizzly Bear Research Project was founded in 1999, with the objective to provide resource managers with the necessary knowledge and planning tools to ensure the long-term conservation of grizzly bears in the Yellowhead Ecosystem (Stenhouse and Munro 2000). One of its main research components is directed towards habitat mapping, where
1
landcover is annually mapped using the Integrated Decision Tree Approach (IDTA) based on remote sensing imagery, such as Landsat TM imagery (Franklin et al 2001). This annual IDTA landcover map however does not include seismic cutlines since the 30 m resolution of the Landsat TM imagery is too low to capture these features. Seismic cutlines are not indefinite features in the landscape, their persistence depending on the rate of vegetation regeneration, the soil substrate (Revel et al. 1984), and the amount of human use. Mapping seismic cutlines therefore becomes a function of identifying newly developed, existing and disappearing cutlines. Any study involving this dynamic landscape feature requires its accurate depiction at the specific time of interest. Relationships between spatial patterns and wildlife habitat processes have received much attention in the disciplines of environmental management, conservation biology, and landscape ecology over the last two decades (Wiens 1989, Levin 1992, Diaz 1996, Davidson 1998). Over 50 landscape-level and class-level landscape metrics and indices have been developed to quantify spatial patterns into single variables (e.g. McGarigal and Marks 1995, Frohn 1998). These metrics can quantify the habitat from mere composition (i.e., proportion of habitat patches within a landscape unit, habitat richness and diversity) to actual configuration (arrangement, position and orientation of habitat patches within the landscape) (McGarigal and Marks 1995). Some of these metrics are redundant and the landscape structure may be characterized by a few groups of metrics (McGarigal and McComb 1995, Riiters et al. 1995, Cushman et al. in review). Which metrics to choose to quantify the spatial patterns of a particular landscape is often not clear, and frequently previous literature is consulted in this task (Popplewell 2001).
2
Several studies have successfully related landscape metrics to habitat use and habitat selection of several wildlife species (e.g., Stuart-Smith et al. 1997, Chapin, et al. 1998, Knutson et al. 1999, Potvin et al. 2001). The relationships between habitat structure and wildlife habitat use can be especially informative in areas where the rates of anthropogenic developments and disturbances are increasing and their large-scale geographic and ecological effects on habitat use are uncertain. Assuming that structure and habitat use can be successfully related parallel to other factors influencing wildlife habitat use, such as food availability and mating behavior, the link between habitat use and anthropogenic development can be made via studying the effects of the anthropogenic development on landscape structure. This is the mental framework of this thesis research undertaken in collaboration with the FMF grizzly bear research project. Oil and gas exploration in the foothills is occurring at a remarkable rate (Schneider et al. 2003) and its consequences on grizzly bear habitat structure and bear landscape use requires documentation. A previous smallscale, local study (12km2 study area) established that the development of seismic cutlines did not displace grizzly bears in the Flathead River drainage in direct ways (McLellan and Shackelton 1989). The question remains whether large-scale regional grizzly bear landscape use is affected by seismic cutlines and by the landscape structures they create in the East Slopes of the Rocky Mountains in Alberta. While previous grizzly bear habitat studies have investigated habitat selection at scales varying from annual home ranges (Mace et al. 1996) to microsites (Hamer and Herrero 1987, Mace et al. 1996), several recent studies (Mace et al. 1999, Nielsen et al. 2002a) have focused on selection at a patch-level scale (Johnson 1980). These studies
3
use generalized linear models, which is the most commonly applied method for resource selection function (RSF) analysis (Manly et al. 1993, Boyce and McDonald 1999). RSFs have been developed for both individuals and populations (Mace et al. 1999, Nielsen et al. 2002a). This analysis can explain small-scale selection and avoidance for patch or habitat types if the accuracy of utilization points is relatively high (White and Garrot 1990). However, only a few studies can be found applying these habitat selection concepts to grizzly bear occurrence and landscape structural variables. Two studies have focused on landscape composition, such as habitat proportion (McLellan and Hovey 2001) in the Flathead River drainage and habitat variety/richness in FMF grizzly bear RSF modeling (Nielsen and Boyce 2002). One study in the FMF grizzly bear project (Popplewell et al. 2003) has started to investigate configurational metrics, such as edge density, mean patch size, mean nearest neighbor and patch size covariance, in determining grizzly bear density classes of bear management units (BMUs), which are delineated watersheds approximating the size of a female annual homerange. There appears to be a lack of a general consensus on the role of fragmentation and spatial patterns in grizzly bear ecology. Nielsen and Boyce (2002) demonstrated that grizzly bears selected for patches within a neighborhood of higher habitat variety, indicative of natural fragmentation, since they would provide more potential local resources for various behavioral activities (e.g. feeding, bedding, etc.). However, Popplewell et al. (2003) found that high bear density classes were generally associated with lower fragmentation, and McLellan and Shackelton (1988) showed that anthropogenic fragmentation, as caused by roads, triggered avoidance by grizzly bears. The meaning of landscape structure to grizzly bear population is far from solved.
4
In this thesis, a landscape ecology approach is presented using a large-scale analysis to quantify and assess the effects of seismic cutlines on grizzly bear habitat structure, and to investigate what role seismic cutlines and landscape structure play in determining the landscape use by grizzly bears in the Alberta Rocky Mountain foothills. All analyses focus on the early summer (June 1 to July 31) time window to reduce seasonally influenced grizzly bear foraging behavior effects (Nielsen et al. 2002b). During early summer, bears are known to feed on a variety of foods, such as horsetail (Equisetum arvense), cow parsnip roots (Heracleum maximum), graminoids (grasses, sedges and rushes), insects, and on elk calves or carrion (Hamer and Herrero, 1987, Herero 1985, Nagy et al. 1989, Munroe and Stenhouse 2003). This time period was selected since the foraging behavior is considered more general and the food supply is more evenly distributed. This contrasts to late summer and early fall, when the foraging behavior is mainly driven by berries, such as buffalo berries (Sheperdia canadensis) and blueberries (Vaccinium Spp) (Hamer and Herrero 1987, Nagy et al. 1989) and thus presents a different underlying distribution 'mechanism' not of focus of this investigation. Summarizing the outlined, current information needs in context of grizzly bear conservation, several questions can be formulated for this thesis: •
How can seismic cutlines be mapped?
•
Which of the various existing landscape metrics are required to describe most aspects of spatial pattern of the FMF grizzly bear habitat?
•
What are the relationships between seismic cutline densities and the FMF grizzly bear habitat structure?
•
What are the effects of seismic cutlines and spatial patterns on grizzly bear landscape use?
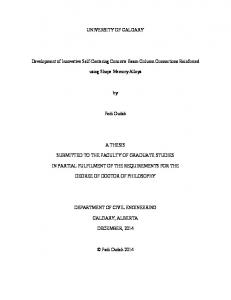
5
1.1 Research Objectives and Strategies 1.1.1 Seismic Cutline Mapping Consistent updates to grizzly bear habitat maps are required for sound baseline habitat information. Seismic cutlines are not part of the Landsat-based IDTA landcover mapping since the 30 m sensor resolution prevented full detection of these features (Fig.1a). Therefore, the first thesis objective concentrates on investigating a feasible method by which satellite imagery could be used to detect existing seismic cutlines in the Foothills area of the Grizzly Bear Research Project. High resolution, panchromatic Indian Remote Sensing (IRS) imagery is available for the FMF grizzly bear project area, which appears to show seismic cutlines relatively well (Fig.1b). A classification and a manual digitizing mapping approach from this IRS imagery are to be compared to address this objective. This investigation is limited to the narrow, straight, explorative seismic cutlines least likely to be mapped by the Landsat TM imagery. 1.1.2 Parsimonious Landscape Metrics A large list of landscape metrics and indices has been developed (e.g. McGarigal and Marks 1995, Frohn 1998, McGarigal et al. 2002) to quantify spatial patterns into single variables; however, several metrics can be redundant (Riiters et al. 1995, Cushman et al. in review). To address this issue of metric redundancy within the foothills area of the grizzly bear research project, the second thesis objective is to find the parsimonious suite of independent class-level and landscape-level metrics capturing most of the spatial patterns of the foothills habitat structure. Multivariate statistical techniques are applied to landscape metrics of sub-landscapes (sub-zones) of the extended foothills to address this objective. 6
Figure 1 Seismic cutlines within a sub-section (NTS map sheet 83F16) of the Alberta Foothills in a) a 30 m resolution 1998 Landsat TM image and in b) a 5.6 m panchromatic Indian Remote Sensing Image.
7
1.1.3. Relationships between Seismic Cutlines and Landscape Metrics Oil and gas exploration in Alberta occur at remarkable rates (Schneider et al. 2003). The third thesis objective is to assess the combined effects of explorative and exploitative seismic cutline densities on the landscape structure of grizzly bear habitat inside the foothills. Aspects of landscape structure important to grizzly bear distributions in the foothills are to be investigated to address this objective. The main focus is directed towards a) assessing the quantitative relationship between cutline densities and metric changes and b) discerning the influence of the original landscape structure on these relationships. 1.1.4 Effects of Seismic Cutlines and Landscape Structure on Grizzly Bear Landscape Use The effect of seismic cutlines and spatial patterns on grizzly bears is still largely unknown. In order to contribute knowledge to this question, the fourth and final objective of this thesis is to investigate the effects of seismic cutlines and landscape structure on the grizzly bear landscape use inside the FMF grizzly bear project. Multivariate regression analysis is to be used to model the relationships between seismic cutlines, landscape structure and bear landscape use based on location data from Global Positioning System (GPS)-collared grizzly bears.
8
1.2 Study Area The 9750-km2 FMF Grizzly Bear Project (Stenhouse and Munro 2000) is located within the Yellowhead Ecosystem, southwest of Edson, Alberta, Canada (Fig.2). The grizzly bear project area was stratified into 29 bear management units (BMUs), which were delineated watersheds in the rough size of a female annual homerange, used for habitat research and planning purposes (Stenhouse and Munro 2000) (Fig.2). The western boundary of the Core Foothills Area of the grizzly bear project area park forms the boundary to Jasper National Park (JNP). Seven western BMUs were located inside JNP. When first established in 1999, the grizzly bear project area was bounded in the east by Highway 40, which constitutes the eastern boundary of the Core Foothills Area. In the year 2000, the Core Foothills Area was extended to the east, comprising the Extended Foothills Area (Fig.2). The western part of the FMF Grizzly Bear Project, within JNP, contains no human use related to resource extraction. Bio-geoclimatic conditions, grizzly bear food production and availability differ between JNP and the Foothills Areas, restricting some comparisons between the multi-use Foothills and the protected park zone. Therefore, this study was focused on the multi-use Extended Foothills Area, where anthropogenic disturbance exists throughout, however to varying degrees. Most of the research of this thesis was carried out in the Core Foothills Area (Fig.2) to reduce computational efforts. The Extended Foothills Area is 7450 km2 in size, and it covers portions of the Foothills and Rocky Mountain natural regions of west-central Alberta (Beckingham et al. 1996). East of the Core Foothills Area boundary, the Lower Foothills natural sub-region (Beckingham et al. 1996), with elevation gradients between 840 and 1,150 m, dominates
9
Figure 2 Core Foothills Study Area in context of the Foothills Model Forest (FMF) Grizzly Bear Research Project Area, the Extended Foothills Area, Bear Management Units, major towns, and terrain.
10
the vegetation environment. This subregion is characterized by the codominant occurrence of aspen (Populus tremuloides), balsam poplar (Populus balsamifera), lodgepole pine (Pinus contorta), and white spruce (Picea glauca) (Strong, 1992, Beckingham et al 1996). About 25 % of this eastern portion of the Extended Foothills Area is also dominated by the Upper Foothills natural sub-region, with elevation gradients between 1,150 and 1,450 m (Beckingham et al. 1996). The Upper Foothills natural sub-region is characterized by closed-canopied coniferous forests with lodgepole pine the most dominant species and white spruce being also common as pure stands or in associations with lodgepole pine (Beckingham et al. 1996). Aspen is generally rare in this sub-region, only occurring on warm southerly slopes on coarse-textured soils. The western portion of the Extended Foothills Area, the 3,040-km2 Core Foothills Area, includes a range in topographic elevation from about 1,100 to 2,880 m, with about 25% of the area contained in the Montane, Sub-alpine, and Alpine natural sub-regions, and the remaining 75% in the Upper Foothills sub-region (Beckinham et al. 1996). The Montane sub-region occurs only on the western portion of major river valleys below the Sub-alpine natural region, and it is characterized by the occurrence of Douglas-fir (Pseudotsuga menziesii) or lodgepole pine and/or aspen stands which succed into white spruce stands (Strong 1992, Beckingham et al. 1996). The Sub-alpine natural sub-region lies above the Upper Foothills and the Montane at elevations between 1,300 and 2,000 m, and it is characterized by lodgepole pine stands, which are co-dominated by Engelmann spruce (Picea engelmanii) and subalpine fir (Abies lasiocarpa) (Beckingham et al. 1996). The Alpine sub-region starts at elevations between 1,800 and 2000 m where herbaceous vegetation dominates.
11
1.3 Organization of the Thesis The research of this thesis was undertaken between fall 2000 and summer 2003, and the findings in regards of all four thesis objectives are presented in sequence, within each of the traditional components of a thesis. Chapter one outlines the background on the information needs for grizzly bear conservation and formulates specific research objectives in the area of seismic cutline mapping, parsimonious landscape metrics, relationships between cutlines and grizzly bear habitat structure, and effects of cutlines and habitat structure on grizzly bear landcape use. The study area is also described in this chapter to provide spatial context. Chapter two reviews the current knowledge pertaining to these objectives. Background is provided on basic remote sensing mapping techniques to map grizzly bear habitat structure. Origin, use and sensitivity of landscape metrics are reviewed to understand them as indicators of landscape structure. Since any wildlife ecology or remote sensing study contains a specific scale at which a phenomenon is studied, basic aspects of scale and scale effects are also reviewed. The life history traits and the distribution of the study object, the grizzly bear, are reviewed to provide a sound basis for ecological inferences of the statistical results. Chapter three outlines all methods and data sets applied in all four thesis objectives, and they are described in sequence. Chapter four describes the findings of each thesis objective separately, and discusses their inference in context with other studies. Chapter five concludes the thesis by summarizing the main results, by addressing the implications of the major findings from all thesis objectives, and by outlining potential for future research on the study subjects.
12
2 GRIZZLY BEAR LANDSCAPE STRUCTURE: TECHNIQUES AND ECOLOGY 2.1 Basic Remote Sensing Mapping Techniques Synoptic and repetitive biophysical and biochemical vegetation data for large geographic areas over long periods of time are as crucial for sustainable forest management (Franklin 2001), as they are for grizzly bear conservation (Craighead et al. 1986, Craighead 1998). Remote sensing has been proven to be the only practical, quantitative tool to acquire such data and to describe, map and evaluate habitat for grizzly bears (Craighead et al. 1986, Gaines et al. 1994, Craighead 1998) or for other wildlife (Frohn 1998). Before remote sensing imagery can be mapped using one of the existing classification methods to map habitat, some image transformation may be required to create a more informative baseline image (Franklin 2001). Within the context of this study, where panchromatic, fine-resolution and multi-spectral, coarse resolution satellite imagery exist, image fusion is the transformation of interest. The two sections below will provide some background to image fusion and to basic classification techniques. 2.1.1 Image Fusion The merging or fusion of satellite imagery derived from different sensors is an efficient way to combine the information of two different images within a single data set (Chavez et al. 1991, Saraf 1999). Multisensor image data are complementary in the way that the interpretability of the spatially coarser multispectral imagery, such as Landsat TM images, can be enhanced with spatially finer panchromatic (black and white) imagery, such as Systeme Pour l’Observation de la Terre (SPOT) or Indian Remote Sensing (IRS) satellites (Saraf 1999). The advantage for merging multispectral image data with high-resolution
13
image data lies in offering a “product in which distinct spectral patterns provided by the Landsat TM [multispectral image] are displayed by the various hues while the SPOT panchromatic data provides high resolution data in which surface textural patterns are revealed” (Sunar and Musaoğlu 1998). Several techniques exist to undertake the fusion of multisensor images and they include Intensity-Hue-Saturation (IHS) transformations (Carper et al. 1990, Sunar and Musaoğlu 1998, Saraf 1999), Principal Component Analysis (PCA) (Chavez et al. 1991), High-Pass Filter (HPF) procedures (Chavez et al. 1991), and Wavelet Transforms (WT) (Kumar et al. 2000). Common to all techniques is the first step of geometric registration of two images of different sensors (Kumar et al. 2000, Saraf 1999, Schetselaar 1998, Sunar and Musaoğlu 1998). The IHS transform is one of the most popular techniques to undertake the fusion procedure (Chavez et al. 1991, Schetselaar, 1998), where intensity, hue and saturation refer to the parameters of human colour perception (Lillesand and Kiefer 2000). Intensity stands for the total brightness of a colour, hue refers to the dominant or average wavelength of light contributing to a colour, and saturation specifies the purity of a colour relative to grey (Carper et al. 1990). The IHS method “uses three bands of the lower spatial resolution image and transforms these [from Red Green Blue (RGB) space] into IHS space, then the higher resolution image is contrast stretched so that it has approximately the same variance and average as the intensity component image, and lastly the higher resolution image replaces the intensity component before the images are re-transformed back into original space” (Chavez et al. 1991). This general technique has been applied to the fusion of Landsat TM and SPOT panchromatic images (Chavez et al. 1991, Sunar and Musaoğlu 1998), to the fusion of SPOT multispectral 20 m resolution and SPOT panchromatic 10 m
14
resolution images (Carper et al. 1990), and to the fusion of IRS multispectral 24 m resolution (LISS-3) and IRS panchromatic 5 m resolution images (Saraf 1999). Principal Component Analysis works in a similar fashion as the IHS transform, since the first principle component image (like the intensity image in IHS transform) of the low resolution multispectral image is replaced with the contrast stretched, high resolution, panchromatic image (Chavez et al. 1991). The final merged product is obtained by an inverse transformation of the modified component set (Kumar et al. 2000). Common to the IHS and PCA methods is their assumption that the contrast-stretched, high-resolution image is similar to the intensity image or the first principal component image. However, as seen in the comparative study of Chavez et al. (1991), this assumption is not always valid. Spectral characteristics of the original multispectral images can be distorted (Chavez et al. 1991). Despite this finding, IHS still is promoted as an efficient tool to improve mapping techniques through increased image classification opportunities with higher spatial detail (Saraf 1991). The high-pass filter method encompasses the application of a high-pass spatial filter to the high- resolution panchromatic image, which removes most of its spectral information (Chavez et al. 1991). The filter results are then added to the lower spatial resolution, multispectral image, which yields a data set that provides spectral information with higher spatial resolution (Chevaz et al. 1991). Chevaz et al. (1991) found that the HPF method distorted spectral values the least compared to PCA and IHS. Another development of fusion techniques is the cubic spline wavelet transform method. In this method, the intensity component of the multispectral image is extracted, similarly to the IHS transform, however instead of replacing the intensity component with
15
the whole panchromatic image, a wavelet transform is applied to the panchromatic image data and the multispectral intensity image, decomposing them into lower spatial resolution and detail image (Kumar et al. 2000). The detail components of the panchromatic image are combined with wavelet reduced intensity image and a fused intensity image is obtained with the inverse wavelet transformation. The other two colour transform components, such as hue and saturation, are inverse colour transformed to obtain the final merged product (Kumar et al. 2000). These authors compare this method with IHS, PCA, HPF, and others and conclude that the cubic spline transform constitutes the least spectral difference of the merged image to the original multispectral image. This is mainly because panchromatic data are merged separately with each band after histogram matching of the panchromatic data with that of the individual bands in contrast to other methods (i.e. IHS), where global histogram matching leads to some loss of spectral signatures. 2.1.2 Classification Techniques “The overall objective of image classification procedures is to automatically categorize all pixels in an image into land cover classes or themes” (Lillesand and Kiefer, 2000). Based on multi-spectral satellite imagery, combinations of Digital Numbers (DN) across image bands are identified for various land cover classes or habitat types in this process. Such unique DN combinations are generally refereed as spectral signatures of a particular class (Richards and Jia, 1999). Classification approaches focusing on such spectral information of image pixels are referred to as spectral pattern recognition (Lillesand and Kiefer 2000). Satellite imagery can also be classified with spatial pattern recognition approaches, which categorizes pixels based on their spatial relationship with pixels surrounding them, and with temporal pattern recognition, which uses time to guide feature
16
identification (Lillesand and Kiefer 2000). Since spectral pattern recognition classification approaches constitute the backbone of most classification activities, focus is directed towards their techniques. Two main techniques compose the spectral pattern recognition classification approach, which are supervised and unsupervised classification (Jensen 1996, Lillesand and Kiefer 2000). Supervised classification, as the name implies, requires some input derived from field work, air photos or others, before the chosen classification algorithm is applied (Mather 1999). A known set of land cover classes to be mapped are identified a priori, which are to be separated on the image based on statistical properties of the image data (Franklin 2001). Training samples of the spectral data of the known land cover classes need to be collected and their spectral patterns are subsequently evaluated using decision rules or classification algorithms to determine the identity of each pixel (Mather 1999, Lillesand and Kiefer 2000). Several classification algorithms exist, such as parallelepiped, maximum likelihood, centroid (k-means), fuzzy maximum likelihood, or neural net classifiers (Jensen, 1996, Mather 1999, Lillesand and Kiefer 2000). Unsupervised classification does not rely on training samples to classify an image; instead it uses the statistical or clustering properties of the image data to find a set of natural, spectral classes (Thomas et al. 1987). This approach does not allow predefining centers of classes, as is the case in supervised classification. Here, the relationship between the class labels allocated by the classifier algorithm to the image pixels and the land cover classes, existing in the area, is determined after unsupervised classification has been carried out (Mather 1999). Several clustering algorithms exist, such as ISODATA or fuzzy cmeans classifier (Jensen 1996); however, the most common algorithm is the k-means
17
approach (Lillesand and Kiefer 2000). The k-mean clustering procedure requires only the number of clusters to be located and the algorithm arbitrarily seeds cluster centers in the multi-dimensional spectral image space. Based on mean vector distances from each pixel to each cluster center, cluster membership is determined, and the image is reclassified, from where new cluster memberships are formed again. This process continues for the number of iterations specified by the user (Lillesand and Kiefer 2000).
18
2.2 Landscape Metrics as Measures of Spatial Structure It is generally assumed that spatial structures or patterns of landscape mosaics control the ecological processes, which are operating within it (Haines-Young and Choppin 1996). Landscape ecology has made it its very goal to investigate the effects of landscape patterns on ecological processes (Turner 1989); however, a complete understanding of the links between patterns and processes is still missing (Haines-Young and Choppin 1996). To come to such an understanding requires the development of methods to quantify spatial patterns into single variables before links to ecological processes can be determined (Frohn 1998). Landscape metrics and indices commonly constitute such variables (Diaz 1996, Frohn 1998). Whereas one of the first landscape metrics studies presented only three metrics, namely dominance (the degree to which certain kinds of landscape patches or classes predominate in the landscape), contagion (the extent to which similar patches are clumped together), and shape (the form of an area or a patch as determined by the variation of its border) (O'Neill et al. 1988, Forman 1997), an extensive array of landscape metrics and indices exist today (McGarigal and Marks 1995, Elkie et al. 1999). McGarigal et al. (2000) categorized and described a selection of landscape indices, presenting eight metric categories, each of which contained several index types. The main metric categories identified were 1) area metrics, 2) edge metrics, 3) shape metrics, 4) core (or interior) area metrics, 5) nearest neighbour metrics, 6) diversity, richness, evenness metrics, 7) interspersion/juxtaposition, contagion and configuration metrics, and 8) connectivity and circuitry.
19
The large number of indices that has been developed to describe and quantify spatial structure often appears to be overwhelming and the question of potential metric redundancy was raised by Riitters et al. (1995). Using a Factor Analysis of 55 landscape metrics applied to 85 maps of land use and cover in the United States, Riitters et al. (1995) found that these 55 metrics could be reduced to 26. Six factors explained 87% of the variation in the 26 metrics and they proposed that these factors could be represented by six univariate metrics: 1) average perimeter-area ratio (or edge-interior ratio), 2) contagion, 3) standardized patch shape, 4) patch perimeter-area scaling, 5) number of attribute classes, and 6) large-patch density-area scaling. While their study presents metrics, which were aimed at detecting environmental changes with the help of remotely sensed imagery, other metrics could probably be identified if spatial patterns were analyzed at different scales (Davidson 1998, HainesYoung and Choppin 1996). This methodological derivation of six metrics however demonstrates that Factor Analysis (or PCA) can be a useful tool to discard redundant metrics (Haines-Young and Choppin 1996), but these six metrics should not be used as an indication for being "best" for all applications (Davidson 1998). Davidson (1998) also argues that instead of simply avoiding the use of two highly correlated measures, indices should be chosen on the grounds of their sensitivity to the aspect of landscape pattern of concern. Cushman et al. (in review) also undertook a Principal Component Analysis on 54 landscape-level and 49 class-level landscape metrics computed on landscapes of three separate regions of North America (western Massachusetts, southwestern Colorado, and central Idaho). This analysis resulted in 24 class-level and 17 landscape-level metric
20
independent metric groups. Using measures like metric group importance, consistency and strength, they presented seven class-level and eight landscape-level metric groups, which were universal and consistent. They established that these two sets of "fundamental" parsimonious metric groups constitute consistent combinations of metrics that universally describe the major attributes of landscape configuration, since they were inherent aspects of landscape structure across three different regions of North America (Cushman et al. in review). Besides the issue of appropriate metric selection, there are several other factors, such as index uniqueness, index sensitivity, abrupt vs. continuous edges, statistical quantification, study area extent, and scale of resolution, which may influence the interpretation of landscape metrics (Haines-Young and Choppin 1996). These authors present that some index types are unique and may present different and contrasting results despite being an indicator of the same metric category. Similar indices of the same metric category may show different sensitivity to patterns under investigation. The application of structural approaches is made difficult in circumstances when edges, which are the locations where different patches or classes join, are gradual rather than distinct. In such cases it is recommended to use statistical approaches (Haines-Young and Choppin 1996). They also emphasize that quantization levels (8 bit data vs.16 bit data) and contrast levels of the landscape classification can influence landscape indices. For example, the actual spatial structure does not vary with different contrast levels, however, the landscape indices may vary giving false indication of pattern change. Such a situation may require the transformation of data by equal probability or histogram equalization methods (HainesYoung and Choppin 1996). The extent of the area under investigation determines which
21
results are going to be obtained, since an area may display fragmentation at one scale, but homogeneity at another scale. The scale of resolution can also affect the detection of spatial patterns (Haines-Young and Choppin 1996). While Wickham and Riitters (1995) found that diversity and evenness metrics are not "dramatically" affected by changing pixel sizes from four, 12, 28, and 80 m, Benson and MacKenzie (1995) found that landscape indices, such as percent largest patch index, patch number, patch area, edge length, and fractal dimension were sensitive to pixel changes from 25 m to 1100m. Another final important characteristic of landscape metrics to consider is their actual behaviours over the range of landscape structures. Hargis et al. (1998) investigated the relationships between six landscape metrics and the proportion of two landcover types across simulated landscapes, also controlling for the size and shape of patches. Most metrics were linearly associated at the lower landcover proportion range, but had nonlinear associations at higher proportions, which limits their direct comparability across different regions. Such non-linear metric behaviour was also found in simulated landscapes in a study of dispersal success on fractal landscapes (With and King 1999). An awareness of all of these interpretational effects and metric behavioural limitations needs to be embedded in any landscape quantification attempt.
22
2.3 Scale Issues in Remote Sensing and Wildlife Ecology "Images from satellites have revolutionized our perception and approaches to understanding landscapes and regions” (Forman 1997). This method allowed wildlife ecologists to view the habitat of any animal over a large spatial extent, such as the habitat of grizzly bear (Craighead et al. 1986), woodland caribou (Rangifer tarandus caribou) (Deuling 1999), wild turkeys (Meleagris gallopavo) (Glennon and Porter 1999), and others. Ecologists’ perceptions may have been revolutionized through satellite imagery; however, perceptual biases in the human mind and in analysis methods still exist. Every organism is an "observer" of the environment and every observer looks at the world through a filter, imposing a perceptual bias which influences the recognition of natural systems (Levin 1992). Science, in general, can be seen as a product of the way the world is seen, constrained by the space and time within which humans inhabit the world (Church 1996). The scale of resolution is a strong determinant of viewing and interpreting the environment and the interest in scale related research is constantly growing (Schneider 1994). It has only been within the last two decades that explicit attention has been directed toward the scale of ecological studies (Wiens 1989, Levin 1992); whereas other scientific disciplines have recognized the importance of scale earlier, such as geography (Schumm and Lichty 1965), botany (Greig-Smith 1952) and physics and mathematics (Orbach 1985, Gleick 1987). The definition of scale is still weak; several versions exist. Church (1996) describes scale as being relative and as being set by the resolution of measurements, and Schneider (1994) defines scale as "the resolution within the range of a measured quantity”. Common to all scientists however is the recognition of the temporal and spatial dimensions of scale
23
(Wiens 1989, Schneider 1994, Church 1996, Lillesand and Kiefer 2000). In ecology, scale can be seen as the product of grain and extent (Wiens 1989, Forman 1997), which relates to resolution (pixel size) and area of coverage in remote sensing (Lillesand and Kiefer 2000). One central focus of ecology is to detect and understand patterns and processes that create them (Wiens 1989, Levin 1992). If such understanding is not to be an artefact of scale, the spatial and temporal scales at which studied organisms perceive and respond to their environment need to be considered in any ecological research (Wiens 1989). 2.3.1 Temporal Scale Temporal scale refers to the frequency with which a measurement is made (Lillesand and Kiefer 2000). The key to temporal scale is change over time, and this pattern or trend may change between hours, days, months, years or centuries. Depending on the research question and on the object under study, the temporal scale of the investigation can be very different. For example, if the diurnal photosynthetic rates of red maple (Acer rubrum) and white birch (Betula papyrifera) are compared in mid-summer, the temporal scale units are hours and the time frame comprises several days (Linke 1999). As an example for the marine ecosystem, which encompasses 2/3 of the world, the turnover rate of the whole water body of the Atlantic Ocean is 275 years (Angel 1993) and to detect and understand the patterns and processes of this water turnover, it would require more than six academic life spans. Visiting the past and detecting landscape changes are made possible by frequent passes of satellites over the same area, which provide the equivalent of time-lapse photography (Forman 1997). Satellites passing frequently over the same area translates for example into the minimum temporal unit of 16 days for Landsat 5 and 7 satellites, of 24 days for Indian
24
Remote Sensing (IRS) satellites (Richards and Jia 1999), and of one day for Advanced Very High Resolution Radiometer (AVHRR) satellites (Malingreau and Belward 1992). Therefore, temporal landscape changes less than the minimum temporal unit of a given satellite cannot be addressed using such imagery. With respect to the opportunity to retrieve spatial information about configurations of landscape elements, such as habitat, in the past, it needs to be considered that imagery from earth resource satellites is only available starting in 1972 (Richards and Jia 1999). 2.3.2 Spatial Scale Spatial scale can be understood in two ways. The remote sensing scientist and cartographer define spatial scale as a proportion, a ratio of length on a map to actual length (Lillesand and Kiefer 2000, Forman 1997). The ecologist’s definition of spatial scale is the level or degree of spatial resolution perceived or considered (Forman 1997). These different definitions of scale lead to confusions in the usage of adjectives such as small and large (Lillesand and Kiefer 2000). Small scale means for a remote sensing scientist that a large area is covered and the difference between actual and mapping size is great (coarse spatial detail), whereas the ecologist sees a small-scale study as encompassing a small area with fine spatial detail (Lillesand and Kiefer 2000). In this thesis, small and large-scale terminology is applied in ecological context, and fine and coarse-scale terminology is applied in remote sensing context. In respect to grain (resolution) and extent (area of coverage), the former pertains to the size of the individual measurements or sampling units in an ecology study or to the pixel size of a satellite image (Wiens 1989, Lillesand and Kiefer 2000), whereas the latter pertains to the overall area encompassed by a study or by the image size (Wiens 1989, Lillesand and Kiefer 2000). Overall seen, "extent and grain
25
define the upper and lower limits of resolution of a study; they are analogous to the overall size of a sieve and its mesh size, respectively” (Wiens 1989). The spatial scale at which measurements or observations are taken influences the recognition of spatial patterns and underlying processes of the environment and of the organisms under study (Wiens 1989). An additional scale besides the spatial scale of measurement and observation, which can be called intrinsic scale, should also be considered since it may also determine what spatial patterns are found (Malingreau and Belward 1992). "The intrinsic scale is a property of the ecological process of interest, for example, tree fall, competition, stomatal control, or microclimate feedbacks, and it is governed in part by the size of the individual organisms (or events) and in part by the range of their interactions with their environment” (Malingreau and Belward 1992). Remotely sensed imagery provides the tools of viewing a large area at the same time and therefore investigations at the large landscape scale are possible.
Limitations in
applying this tool lie in the quantities of spatial resolution and area of coverage. Spatial resolution of imagery depends on the satellite’s spectral sensitivity, or the instantaneous field of view, and the area of coverage depends on the sensor’s swath width, or on the total field of view (Lillesand and Kiefer 2000, Richards and Jia 1999). For Landsat 7 TM satellites, area of coverage is 185 x 185 km, and the spatial resolution lies at 30 m for most of its spectral bands, and at 15 m for its panchromatic (black and white) band (Richards and Jia 1999). For IRS-1D satellites, the area of coverage is 70 x 70 km and the spatial resolution is 5.6 m for its panchromatic band (Richards and Jia 1999). For AVHHR satellites, the area of coverage is 2394 X 2394 km and the spatial resolution is 1.1 km (Richards and Jia 1999). Varying the extent of a study area may be obvious when thinking
26
about scale; however, the change in grain size is also very important when trying to detect and understand patterns and processes. 2.3.3 Scale Effects The distribution of any species is patchy on a range of scales (Levin 1992) and the spatial variability of organisms and the environment may be controlled through different processes and mechanisms, if viewed at different scales (Wiens 1989). Changes in scale in the measurement of a variable cause the variance of that variable to also change in two ways: 1) with increasing grain size and constant extent, greater proportions of spatial variability are contained within the grain sizes and therefore within-grain heterogeneity decreases, whereas between-grain heterogeneity increases; 2) with increasing extents and constant grain size, an increase in spatial extent will be paralleled with an increase in spatial variance, since a larger variety of landscape elements may be included (Wiens 1989). However, the way variance exactly changes with grain size also depends on the magnitude and the form of the heterogeneity of an area (Palmer 1988) and on the type of the measurements taken (Wiens 1989). It is generally accepted that the higher the spatial variance of an organism, the patchier is its distribution (Legendre and Fortin 1989). With respect to generalizations and predictability of detected patterns and processes, larger scales of time and space yield higher predictability than short term, small-scale studies (Wiens 1989, Levin, 1992). At small spatial and temporal scales, “a stochastic phenomena may make the systems of interest unpredictable” whereas “at larger spatial regions and longer time scales, for which macroscopic statistical behaviours are more regular...the systems become more predictable” (Levin 1992). Focus on larger spatial regions and longer time frames allow for generalizations, but at the same time they lose the
27
detail of information about causal mechanisms derivable from small-scale studies (Wiens 1989, Levin 1992). The issue of how the satellite’s spatial resolution affects the recognition of spatial patterns is also very relevant. The size of the objects under study (such as trees, agricultural crops) in relation to the sensor’s resolution, as well as the research objective again, determine the appropriate scale or spatial resolution of imagery required to capture the spatial heterogeneity present (Woodcock and Strahler 1987). These authors presented that the overall variance of satellite images of a forested, a suburban, and an agricultural area were always highest at the resolution that was closely related to the size of the objects in the image. For example, for the forested area, the local variance was low at 0.75 m resolution, increased to about 6 m resolution (average crown diameter was 8 m), and continuously decreased afterwards to the maximum resolution size of 300m. They are suggesting that the appropriate choice of scale is the spatial resolution where variance is greatest. 2.3.4 Dealing with Scale: Research Design and Interpretation Knowing that scale has an effect on the detection and understanding of patterns and causal mechanisms is one step toward the development of common ecological theories within scales (Wiens 1989). There is not one single proper scale at which all sampling ought to be undertaken (Wiens 1989, Levin 1992), and there are no simple rules to automatically select the proper scale of attention (Meentemeyer 1989). Several techniques are available for the analysis of spatial pattern or spatial variability of ecological observations across scales, such as the nearest neighbour method (Davis et al. 2000), semivariance analysis (Meisel and Turner 1998), and several other univariate
28
(spatial correlograms and spectral analysis) and multivariate (Mantel test and Mantel correlogram) methods (Legendre and Fortin 1989). Most statistical approaches are based on the observation that variance increases as transitions are approached in hierarchical systems (O’Neill et al. 1986). "Peaks of unusually high variance indicate scales at which the between-group differences are especially large, suggesting that this may represent the scale of natural aggregation or patchiness of vegetation” (Greig-Smith 1952) or organisms, which is referred to as the boundary of a scale domain by Wiens (1989). This demonstrates that arbitrary scale choices can be avoided by analysing the variance of measurements across many scales. Within remote sensing, a method of choosing the appropriate scale of imagery is presented by Woodcock and Strahler (1987). A digital aerial photograph with a high spatial resolution is taken of the study area and subsequently this image is collapsed to successively coarser spatial resolutions while calculating local variance (standard deviations of moving 3 x 3 pixel windows are computed and the mean of these values over the entire image is taken as an indication of local variability) at each scale. The scale or resolution where variability is highest is deemed to be the appropriate scale in relation to the structural components of the ground.
29
2.4 Grizzly Bear Life History, Distribution, Habitat and Anthropogenic Effects The grizzly bear is a relatively long-lived omnivore, with a maximum life expectancy between 20 and 30 years (Jones 1982, Knight and Eberhardt 1985). Grizzly bears have delayed reproductive maturity, which occurs between four and eight years of age (Herrero 1978). This species is generally intolerant to human disturbances (Weaver et al. 1996) and their populations require cautious management (Eberhardt 1990). The Alberta resident grizzly bear population is mainly distributed in the western-central part of the province, where 69% of the primary range is provided. It is thought that this area supports a similar percentage of the estimated current resident population (Alberta Environment 1999). Within these areas, in the springtime, female grizzly bears are more frequently found within low- and mid-elevation habitats, whereas in summer and fall, females associate with the mid- to high-elevation habitats (Mace et al. 1999). The spatial requirements for movement change from population to population, given differing environments, but they also differ between sex and between individuals. For example, the mean annual home ranges for grizzly bears in Montana are 768 km2 for males and 125 km2 for females (Mace and Waller 1997), whereas the mean home ranges for grizzly bears in the Canadian Central Arctic are 7245 km2 for males and 2100 km2 for females (McLoughlin 2000). Within the Kananaskis Country of Alberta population, adult females exhibited home ranges between 57 km2 and 1061 km2 (ESGBP 1998). It was found that these homeranges were not mutually exclusive between and within sexes, and overlap zones were randomly used over space and time, which indicated a lack of territoriality (Mace and Waller 1997).
30
Grizzly bears spend the winter (about November to March) in dens, which are often located in snow accumulation areas, where they are in a state of hibernation (Herrero 1985). After leaving their dens in early spring, the grizzly bear’s food is mainly composed of salmon berry (Rubus spectabilis), devil’s club (Oplopanax horridum) (Herrero 1985) and hedysarium roots (Hamer and Herrero 1987). In Yellowstone National Park, Wyoming, it was found in spring, that grizzlies also fed on ungulate carcasses, such as elk and bison, where April constituted the month of peak carcass use compared to the months of March and May (Green et al. 1997). During early summer (May to July) in the Albertan Rocky Mountain front ranges, horsetails (Equisetum arvense) make up a large component of grizzly bears’ diet and elk calves are also hunted during May and June (Hamer and Herrero 1987). Over the whole range of summer (May to September), graminoids (grasses, sedges and rushes) as well as insects (e.g. ants) form another component of grizzly bears’ diet (Hamer and Herrero 1987, Herero 1985). During late summer and fall, buffalo berries (Shepherdia canadensis) and Vaccinium Spp. berries constitute the main food source (Hamer and Herrero 1987, Herrero 1985). Besides foraging and denning areas, the grizzly bear’s habitat requirements include areas for cover, bedding, and mating (Herrero 1985). Cover for bears is provided through dense trees and shrubs, hiding them from other animals and people (Herrero 1985). Grizzlies however do forage in uncovered, open areas, such as extensive subalpine meadows, if they do not feel threatened or harassed by people (Herrero 1985). Cover is also one requirement for grizzlies when they retreat to rest or to bed after foraging, especially in hot weather conditions and in areas where human contact is high (Herrero
31
1985). Mating areas appear to be associated with isolated mountain ridges or tops, where remoteness prevents human disturbance (Herrero 1985). Anthropogenic impacts on grizzly bears include the alteration of food availability, habitat changes, and the frequently reciprocal intolerance between humans and grizzly bears (Mattson 1987), all of which have contributed to the decline in grizzly bear populations to some extent. Specifically in Alberta, the resident population size is conservatively estimated to have been around 6000 individuals at pre-European contact times, in an area which carries only about 850 individuals today (ESGBP 1998, Alberta Environment Protection 2000 unpublished data). Bear intolerance of humans and human intolerance of bears is a definite factor for grizzly bear mortality rates, since it was found that 77-85% of 99 grizzly bears were killed by humans in the Rocky Mountains of British Columbia, Alberta, Montana, Washington and Idaho between 1975 and 1997 (McLellan et al. 1999). In the Albertan Kananaskis Country, about half of the grizzly bear mortalities are due to “problem bears”, which are bears that associate with humans and constitute a risk for injury, and another approximate half of the mortalities is comprised of legal hunting, self-defense, illegal hunting, and First Nations hunting (ESGBP 1998). Through the introduction of pathogens and the conversion of habitat to agricultural and industrial areas, important past food sources, such as chestnuts, whitebark pine seeds, and salmon, declined strongly over the past century in the United States of North America, therefore limiting the foraging areas of the grizzly bear (Mattson 1987). But habitat conversion also caused losses in its refuge areas (Mattson 1987). Habitat changes through the development of highways and roads have not been without effect. In the Bow River watershed, Alberta, it was found that the Trans Canada Highway, with 24-hour, year round
32
traffic volumes, could act as an effective barrier for adult female grizzlies and a filter for males (Gibeau 2000, Gibeau and Herrero 1998). This movement barrier for grizzlies, with traffic volume as the key variable in the permeability of a highway, is seen as significant potential for permanent habitat and population fragmentation (Gibeau 2000). Habituated females however, have been observed to cross secondary highways, with more diurnal traffic patterns, on a regular basis (Gibeau and Herrero 1998). This demonstrates that there is a dualism associated with the effects of highways (Gibeau and Herrero 1998), which may be true for roads as well: most grizzlies avoid highways but some (habituated) grizzlies are attracted to them. The relationship between traffic and grizzly bears was also investigated on forest roads in the Swan Mountains of Montana, where it was found that most bears avoided 500 m buffers surrounding roads having more than 10 vehicles per day (Mace et al. 1996). During spring time, many bears showed neutral and positive selection for roads with no traffic, likely for foraging reasons, but appeared to avoid roads exceeding use of one vehicle per day (Mace et al. 1996). During summer and fall, grizzly bear selection of roads was negative and neutral even for roads with no traffic (Mace et al. 1996). In the Cabinet Mountains of Montana, grizzly bears were observed to use a 914 m wide buffer of open forest roads as well as a 122 m wide buffer of trails less than random. Mean distances to roads increased with the opening of closed forest roads from 655 m to 1122 m (Kasworm and Manley 1990). In Yellowstone National Park, grizzly bear use of primary roads was less than expected within the first 500 m during spring time and within 4 km during summer and fall (Mattson et al. 1987); traffic was not considered. McLellan and Shackelton (1988) found in the Flathead River watershed, British Columbia, that most
33
grizzly bears avoided forest roads, built through resource-extracting industries, such as forestry, mining, and petrocarbon, within 100 m, independently from traffic volume. These authors also mentioned that in addition to habitat displacement, resource-extracting roads constitute improved access for legal and illegal hunters.
34
3 METHODS 3.1 Seismic Cutline Mapping 3.1.1 Research Design In order to determine a feasible method for detecting and mapping explorative seismic cutlines, satellite imagery available for the study area was used as baseline data. The two mapping methods directly applied in this investigation were manual digitizing and unsupervised classification. The seismic mapping results of a third method, manual digitizing of satellite imagery with the help of aerial photograph information, undertaken by the ACCESS program (Alberta Environment) were also used for comparison in the accuracy assessment. 3.1.2 Imagery, Spatial Extents and other Mapping Data Sources The satellite imagery was composed of 6-bit (data gradient of 64 units), 5.6 m resolution, panchromatic IRS imagery. Coverage of IRS imagery for the 3950 km2 large foothills area was available between April and September 1998. Five atmospherically and geometrically corrected IRS image tiles of different dates were provided by the ACCESS program (Alberta Environment) and were subsequently mosaiced together (Fig.3). Image tile 1 displayed a strong atmospheric segregation into a clear and hazy area (Fig.3). A second spatial extent was delineated into a 330 km2 large test area (10% of the total foothills area) to efficiently allocate computational, field and analysis efforts (Fig.3). The test area was located within image tile 1. It contained approximately equal portions of clear and hazy conditions to reduce biases due to
35
Figure 3 Indian Remote Sensing Image tile stratification of Core Foothills Area.
36
atmospheric conditions (Fig.3). Exact image date information was unavailable for two image tiles (Fig.3, image tiles 3 and 4). An atmospherically corrected and orthorectified 30 m resolution, multi-spectral Landsat TM scene from August 29, 1998 was acquired and re-sampled to 5m using remote sensing processing software PCI Works 7.0 for the purpose of merging spectral information to the high-resolution panchromatic imagery. This allowed for later image classification. The IRS mosaic was subsequently co-registered to the Landsat TM scene using 52 ground control points with the nearest neighbour resampling method yielding a residual error of 0.7 pixels (one pixel equals 5 x 5m). Three infrared, high-contrast bands 4, 5,and 7 of the Landsat TM image were merged with the panchromatic IRS intensity image using the PCI XPACE task 'Fusion' using the IHS transform and nearest neighbour resampling method. In order to enhance seismic cutline detectability, edge detector and sharpening filters in PCI XPACE were applied to all the three fusion bands at three filter sizes (3x3, 5x5, 11x11). Visual inspection revealed that the 11 x 11edge detector filter enhanced cutlines the most, and it was used to enhance the three fusion bands. A new, updated data set which mapped explorative and exploitative seismic cutlines became available during the time of this study through the ACCESS program (Alberta Environment), which had been derived from the same 1998 IRS imagery used in this thesis. The ACCESS mapping method consisted of using an old cutline layer produced in the 1:20,000 aerial photograph mapping program between 1980 and 1994 and manually implementing changes based on the 1998 IRS imagery (Doug Knight, pers. comm. 2001). This data set is hereafter referred to as the ACCES seismic layer. During the course of this masters project, the ACCESS seismic layer was stratified into two classes of seismic
37
cutlines, the straight 'explorative cutlines' and the curvy, access creating 'exploitative cutlines' (Fig.4). 3.1.3 Vegetation Seismic Mask. Based on the IDTA landcover map (Franklin et al. 2001) existing for the study area, a vegetation mask was created to overlay on the imagery and on the mapped seismic cutline layers. This mask included areas where existing vegetation was very open or low in height (such as herbaceous areas, shrubs, recent clear cuts, and wet open areas) or where the substrate was bare (rock, snow, road/rail line, or water) (Fig.5), which prevented a visible, fragmentation effect of the surrounding habitat by the cutlines. When applying this vegetation mask to remove segments from any of the seismic layers, they were referred to as 'effective' seismic layers. 3.1.4 Manual Digitizing The edge enhanced IRS Landsat fusion image was displayed in PCI Image Works and all straight, explorative seismic cutline segments visible to the eye were mapped within the core foothills area. The 5-10 m wide cutlines were manually traced as a 2 pixel (10 m) wide grid layer. This was selected in order to be suitable as an image classification seismic mask and as habitat features within the grizzly bear habitat map. During the digitizing process, no vegetation mask was overlaid to ensure that all existing cutlines visible from the imagery could be detected. The process of manually digitizing cutlines in the core foothills area was completed over a period of five days.
38
Figure 4 ACCESS seismic cutlines inside the Core Foothills Area.
39
Figure 5 Test area example of a) vegetation mask and corresponding b) IDTA landscover map.
40
3.1.5 Classification-based Mapping In order to reduce computational efforts, explorative seismic cutlines were mapped using a classification approach only inside the clear area of test area (Fig.3). Seismic cutlines occur in many different surrounding habitats and on many different soil substrates triggering varying revegetation species and growth rates (Revel et al. 1984). Therefore, a supervised classification was not appropriate since not one spectral signature would exist for classifying seismic cutlines. A common unsupervised classification method, the Kmeans clustering method (Lillesand and Kiefer 2000), was then applied to determine the natural spectral groupings or clusters present in the edge enhanced IRS Landsat fusion image. The number of clusters and iterations was set very high, at 200 respectively, in order to include any potential for unique spectral groupings. Areas with low vertical contrast to seismic cutlines were masked out for this classification approach using the vegetation mask (Fig.5) to minimize classification confusion. After 200 spectral clusters were identified, the manually digitized seismic cutline layer was overlaid, dividing the kmeans classification into two classes, seismic and non-seismic. This allowed the identification of cluster membership based on percent areal coverage of clusters per class as follows:
Eqn.1: % seismic coverage of a cluster
=
Eqn. 2: % non-seismic coverage of a cluster =
area covered by cluster within seismic class total area of seismic class area covered by cluster within non-seismic class total area of non-seismic class
To identify whether particular clusters occurred more predominantly within the seismic class compared to their occurrence within the non-seismic class, the difference in percent
41
coverage between the seismic and the non-seismic classes was computed (i.e. positive values indicated clusters with relatively higher importance within the seismic class). When finally mapping the seismic cutlines, two scenarios of cluster merging were compared. In scenario one, all clusters with a higher relative seismic membership (i.e. clusters with positive difference values) were merged to identify seismic lines. In scenario two, all clusters were ordered in decreasing order according to their difference in percent coverage between the two classes. Within the positive difference clusters, the resulting histogram sloped steeply down initially and then asymptotically approached zero. The cluster after which the curve began to straighten out was used to indicate the threshold up to which all previous, higher ordered, clusters were merged into the seismic class. This threshold scenario attempted to reduce the amount of misclassification, since every additional cluster to the seismic class also contributed to the non-seismic class. 3.1.6 Map Accuracy, Field Data Collection and Analysis 3.1.6.1 Field-based Accuracy Assessment Due to unsatisfactory mapping results based on classification procedures alone, efforts to assess map accuracy were focused on comparing the performance of the manually digitized seismic map to the ACCESS layer of explorative seismic cutlines. In order to collect data on the accuracy of these two maps, a field sampling program was carried out in June and July 2001 inside two sampling areas: a) test area, and b) complete foothills area (Fig.6). Eight cutline segments, each five km long, stratified by the two dominant seismic cutline directions, NE and SE, and by the two atmospheric conditions, clear and hazy, were selected as sampling lines inside the test area. One of these segments had to be divided into two smaller components (Fig.6) due to unsuitable field 42
Figure 6 Stratification of Sampling Lines within the Test Area and the Core Foothills Area.
43
conditions. Along the sampling lines, the presence and absence of intersecting seismic cutlines were recorded. The intersection point was recorded with a hand-held Garmin GPS. The total of 40 km of sampling lines constituted about 5% of IRS mapped seismic lines inside the test area. The same procedure was applied on sampling lines in the larger foothills area, which had a sampling intensity of 5km (2.5 km NE and 2.5 km SE) per image tile zone (Fig.6). This sampling intensity was designed to satisfy field time constraints while covering all strata combinations with equal sampling intensity. The effort in the foothills area was 30 km. This yielded a total effort of all sampling lines combined of 70 km. Errors of omission and commission and overall accuracy (Lillesand and Kiefer 2000) for both seismic layers and for both spatial extents were computed based on the number of cutlines found in the field compared to the number of cutlines mapped from the remote sensing imagery. 3.1.6.2 Field Data Collection for Omitted versus Mapped Cutline Segments In order to investigate the field characteristics of the manually digitized seismic cutlines versus existing cutlines omitted in the digitizing process, a systematic sampling regime along all of the sampling lines was designed. Every 300 m along the sampling lines (Fig.7a), a 5 x 5 m ground vegetation plot was taken in the center of the seismic line (Fig.7c) and the location coordinates recorded. The ground vegetation inside the seismic cutline was addressing the question whether the actual vegetation characteristics influenced the detection of cutlines during the mapping process. Other seismic cutline features, such as width, and terrain, here slope and aspect, were assessed at the center of the ground vegetation plot (Fig.7b and c). Incidence value, or surface illumination - a common
44
Figure 7 Protocol for systematic field plots showing a) location along sampling line, b) sampling details, and c) collected data.
45
method of analyzing terrain when integrating ground data with remote sensing –of every field plot were subsequently computed from the collected terrain data and the solar elevation and azimuth data from the IRS imagery (Monteith 1973, Justice and Townshend 1981). Seismic cutlines were also likely to be omitted during mapping in cases where the surrounding environment did not provide sufficient contrast for the seismic cutline to be detected as a different feature. Seismic cutlines could be located either within a low contrast environment, such as meadows to either side, or it could be positioned along the boundary of two different environments, such as a closed forest and a shrub. Both conditions had the potential to cause omissions during the manual digitizing method. Therefore, the field program was designed to assess the degree of contrast between the two surrounding vegetation patches (i.e. matrix stand) of the cutlines. This was done with a traditional forest plot, positioned 30 m perpendicularly to either side of the seismic line, using prism sweeps and a densiometer (Fig.7b,c). The spatial accuracy of the seismic map was also assessed in the field by recording coordinates of road and seismic intersections (i.e. ground control plots) along the sampling lines using the hand-held GPS. Due to irregular distortions in the manually digitized seismic map which originated from spatial distortions in the IRS imagery, all field plots were spatially relocated to the seismic map using linear interpolation between nearest ground control plots (Fig.8). 3.1.6.3 Statistical Analysis of Field Data The statistical analysis of the 300 m field plots assessed and explained differences between field plots mapped by the manual digitizing method (hereafter referred to as
46
Figure 8 Example of linear interpolation of location of field plots to seismic map.
47
'digitized points') and those undetected by this method (hereafter referred to as 'digitizing gap points'). Therefore, the field characteristics of cutline segments omitted during manual digitizing were to be revealed. For this analysis, only the intensively sampled test area field points (total n = 110) were used in this assessment; the incorporation of plots within the foothills area to include the mapping parameter of image quality was not possible due to the low sample size within each image tile (n=15). The field plot data were analyzed using a binary generalized linear model (GLM) with a binomial logit link and with the 'digitized points' and 'digitizing gap points' as response variable (Venables and Ripley 1997). Generalized linear models extend the assumptions of normality associated with classical linear regression modeling to accommodate such nonnormal, binary response variables (McCullagh and Nelder 1989, Quinn and Keough 2002). This variable was explained by three different sets of predictors, explaining topics as a) structural characteristics of line (width and terrain), b) contrast variables (matrix change in crown closure, mean matrix crown closure, matrix change in conifer, mean matrix amount of conifer, matrix change in height, mean matrix height), and c) seismic line vegetation features (seismic % tree cover, seismic % shrub cover, seismic % nonwoody vegetation, seismic % rock, seismic % soil, seismic % dead matter, seismic % open water, % soil moisture, and seismic ATV usage) (please see Appendix A for details on the computation of these field variables). The software package S-Plus 2000 (MathSoft 1999, Venables and Ripley 2002) was used for all statistical analysis steps. Correlations among model coefficients within each of the three predictor sets were accepted until r=0.5. This relatively low threshold was used since multivariable regression analysis was sensitive to collinearity among predictor variables (Harrel 2001). In order to
48
select predictors within the correlated pairs, Chi-square p-values and AIC values were used (Burnham and Anderson 1998, Venables and Ripley 2002) in addition to an understanding of the physical effects of correlated variables in respect with their visual discrimination. Model selection was achieved with the automated step Akaike Information Criterion (stepAIC) (Akaike 1973, Venables and Ripley 2002). The model is selected by a backward stepwise search for the linear combination of predictors specified in the starting GLM based on the lowest AIC (Venables and Ripley 2002). The signs and the relative magnitude of the GLM coefficients indicated the relationships between predictors and the response variable (i.e. positive coefficient indicate relationship with digitized points and a negative coefficient indicates relationship with gap points). To further support the AICselected model results, p-values from a sequential analysis of deviance based on a F-test (Venables and Ripley 2002) were also provided.
49
3.2 Landcover Baseline Maps for Landscape Structure Quantification 30 m spatial resolution land cover maps of the grizzly bear research project study area for the years 1999 and 2000 provided the source data for landscape structure quantification. These maps were created based on an integrated decision tree approach (IDTA) to classifying Landsat satellite imagery (Franklin et al. 2001). The 23 IDTA landcover types (Table 1, Fig.9) had an overall accuracy of 83%. Roads were part of the IDTA map, which combined all undivided paved roads, 1-lane gravel, and unimproved roads. The IDTA landcover map was resampled to 5 m to allow the merging of ‘effective’ seismic explorative cutlines, derived from the manual digitizing method, and ‘effective’ exploitative cutlines, derived from the ACCESS layer. The ‘effective’ cutline layers were used to avoid overestimation of cutline induced fragmentation of grizzly bear habitat in areas, where the surrounding habitat was not visually dissected. This IDTA map was subsequently reclassified into three schemes to suit particular objectives. In order to generally reduce the number of landscape variables, a Detailed Grizzly Bear Habitat (DGBH) map with 16 landcover types (Table 1, Fig.9) was created (Popplewell 2001). The 16-class DGBH map was further simplified into the Broad Grizzly Bear Habitat (BGBH) map with 11 landcover classes (Table 1, Fig.9), most of which were common to other grizzly bear habitat studies (Mace et al. 1996, Waller and Mace 1997, Nielsen et al. 2002a). A third reclassification, the Generalized Integrated Decision Tree Approach Foothills (GIDTAF) Map, ensured representation of all landcover types classes over the entire extended foothills area (Table 1, Fig.9).
50
Table 1 Landcover type reclassifications of the Integrated Decision Tree Approach (IDTA) map: a) Detailed Grizzly Bear Habitat map (DGBH), b) Broad Grizzly Bear Habitat Map (BGBH), c) Generalized Integrated Decision Tree Approach Foothills (GIDTAF) Map. Original IDTA Landcover Types 1. Closed Conifer
a) DGBH Landcover Types 1. Closed Conifer
b) BGBH Landcover Types 1. Closed Forest
c) GIDTAF Landcover types 1. Closed Forest
2. Closed Deciduous
2. Closed Deciduous
3. Mixed Forest
3. Mixed Forest
4. Open Conifer
4. Open Conifer
2. Open Forest
2. Open Forest
5. Open Deciduous
5. Open Deciduous
6. Alpine
6. Alpine
3. Alpine
not applicable in foothills
7. Herbaceous 0.6) in a hierarchical approach; metrics, which had the least number of collinear landscape metrics, were retained. The set of uncorrelated metrics was composed of mean patch size (Area_MN), mean shape index (MSI), coefficient of variation in mean nearest neighbor (MNN_CV), and Simpson's Evenness Index (SIEI). Two of the 12 BGBH landcover type proportions, 'alpine' and 'non-forested features', were removed from the data set since they were correlated with several other types.
73
'Alpine' was correlated with 'closed forest' (r = -0.65), with 'open forest' (r = 0.66), and with 'non-forested features' (r = 0.63). 'Non-forested features' was also correlated with 'closed forest' (r = -0.66). The ruggedness index was also removed from this investigation, since it was correlated with proportion of seismic lines (r = -0.71), and seismic lines constituted one of the major landscape features of interest. The final set of landcover type proportions entering the statistical analysis were those of closed forest (Pcforest), open forest (Poforest), herbaceous cover (Pherb), shrubs and wetlands (Pshrubs), roads (Proads), recent clearcuts (Precentcut), older cuts (Poldcuts), fire-originated stands (Pburn), seismic lines (Pseismic), and streams (Pstreams). 3.6.4 Statistical Analysis Poisson family generalized linear models (GLM) with log-linear link (Venables and Ripley 2002) were used to relate the 10 compositional and 4 configurational, independent (r < 0.6) landscape metrics for each landscape unit with the grizzly bear landscape use by all sampled bears (population-level), by all sampled females, and by all sampled males. The bear landscape use data was poisson distributed, and GLMs extend the assumptions of normality associated with classical linear regression modeling to accommodate such nonnormal response variables (McCullagh and Nelder 1989, Quinn and Keough 2002). The statistical investigation was limited to linear relationships to reduce model complexity. The underlying strategy was to find the best-fitting explanatory model with the fewest number of predictor variables, following the principle of parsimony (Box and Jenkins 1970, Burnham and Anderson 1998, Quinn and Keough 2002). Stepwise model selection procedures were applied using the Akaike's Information Criterion (AIC) (Akaike 1974) based on the S-PLUS command stepAIC in the MASS library (Venables and Ripley,
74
1997). To further support the AIC-selected model results, we also provided p-values from a sequential analysis of deviance based on a F-test (Venables and Ripley 1997). To ease the interpretation and comparability of regression coefficients, predictors were standardized to z-scores by calculating the deviations from the mean in standard deviation units previous to regression analysis (Menard 2001, Quinn and Keough 2002). All statistical data handling was done using S-PLUS 2000 (Mathsoft 1999) on an IBM PC computer.
75
4 RESULTS AND ANALYSIS 4.1 Explorative Seismic Cutlines 4.1.1 Digitized Map The manual digitizing method generated a map of explorative seismic cutlines visible from IRS imagery of the year 1998 (Fig.15). According to this map, the foothills area contained 1330 km of explorative seismic cutlines, yielding an average line density of 0.44 km/km2. Explorative seismic cutline densities in the nine foothills BMUs ranged from 0.11 km/km2 (Whitehorse BMU, Fig.15, Table 3) to 1.30 km/km2 (Lovett BMU, Fig.15, Table 3).
Table 3 Densities of manually digitized Explorative Seismic Cutlines across Bear Management Units of the Foothills Area. Bear Management Unit (BMU) Whitehorse Gregg Cardinal Brazeau Maskuta Beaverdam McLeod Pembina Lovett
Explorative Seismic Density (km/km2) 0.11 0.13 0.17 0.37 0.45 0.54 0.63 0.71 1.30
4.1.1.1 Accuracy Assessment Inside the intensively sampled test area, the manually digitized seismic map had the same low error of omission (5%) as the ACCESS seismic layer (Table 4), translating into overall map accuracies of 95%. However, at the foothills scale, where variations in image date and atmospheric conditions exist, seismic feature recognition appeared to be
76
Figure 15 Manually digitized explorative seismic cutlines inside the Core Foothills Area stratified into Bear Management Units.
77
reduced slightly when using IRS imagery only as the basis for mapping. This was demonstrated by the higher error of omission of 12%, reducing the overall accuracy of the manually digitized seismic map to 88%, while the ACCESS seismic layer maintained a low error of omission of 4% (Table 4). At both spatial scales, the test area and the foothills area, the manually digitized seismic map exhibited much lower errors of comission (5% and 4% respectively, Table 5) than the ACCESS seismic map (28 % and 27% respectively, Table 4). The strong overestimation of presence of seismic cutlines by the ACCESS map was likely due to the age of the secondary information used in their methodology. Aerial photographs had dated from the 1980s to the early 1990s, and some seismic cutlines were re-grown by 1998. While this secondary information helped to maintain high overall accuracies, the map overestimation constituted the tradeoff of this method.
Table 4 Accuracy Assessments of manually digitized explorative seismic cutline map and of ACCESS explorative seismic map. Error Type
Error of Omission (Number of mapped lines divided by number of present lines subtracted from 100% accuracy) Error of Comission (Number of mis-mapped lines divided by total number of mapped lines) Overall Accuracy (Number of mapped lines divided by number of present lines)
Test Area Manually ACCESS digitized Seismic Seismic Map Map
Foothills (incl. test area) Manually ACCESS digitized Seismic Seismic Map Map
100%-(18/19) =
100%-(22/25) =
100%-(18/19) =
100%-(24/25) =
5%
5%
12%
4%
1/19 *100% =
7/25 *100% =
1/23 *100%=
9/33*100%=
5%
28%
4%
27%
18/19*100%=
18/19 *100%=
22/25 =
24/25 =
95%
95%
88%
96%
78
These accuracy results require interpretation in the context of the sampling regime employed. Inside the test area, sampling effort was equally stratified within the hazy and the clear area and within the two main seismic directions, sampling 5% (of length) of all existing seismic cutlines inside the test area. While this sampling was considered to be representative across the whole test area, the sampling effort across the complete foothills area varied across image tiles between 1.5% and 6% (Table 5). The field budget only allowed a restricted time in the field, and therefore the foothills sampling regime was designed to cover a large spatial extent with a sampling intensity of 5km per tile. Since the sampling effort varied across the complete foothills (Table 5), the accuracy assessment was more representative of cutlines mapped in image tile 1,2 and 4, and tended to underrepresent cutline detection from image tiles 0 and 3 (Table 1).
Table 5 Accuracy assessment sampling effort inside the foothills area stratified per image tile. Image Tile
Total Length of Manually Digitized Seismic Cutlines (km)
Percent Sampling Effort (length of cutlines sampled divided by total cutlines)
0
150
5/150 =3%
1
650
5+20 /650 =4%
2
120
5/120 =4%
3
330
5/330 =1.5%
4
80
5/80 =6%
79
The overall accuracy of 88% by the manually digitized seismic map layer was a satisfactory result given that only the presence or absence had been noted in the field and that no other seismic field characteristics had been incorporated at this stage of analysis. It was also satisfactory since this map exceeded the overall accuracy of the IDTA map (Franklin et al 2001). The analysis of field cutline characteristics (section 4.1.1.2) provided further information on the nature of omission errors. The spatial accuracy of seismic cutlines was determined based on 34 ground control points collected at road and seismic intersections over the foothills area and had a mean error of 12.5m, ranging from 2.5 m to 34m.
4.1.1.2 Field Characteristics of Omitted Cutline Segments The field program was designed to provide information on the seismic field characteristics from segments omitted by the manual digitizing method compared to the segments which had been mapped. Inside the test area, 110 field plots were collected and were analyzed using three different sets of predictors. Based on AIC model selection, line width was the sole important explanation of 'digitized points' (coefficient:0.264, st. error = 0.100, Table 6) within the first set of predictors (Set A) investigating structural characteristics of seismic cutlines. This suggested that the manually digitized seismic layer tended to omit cutline segments that were narrower than mapped cutline segments. Within the second set of predictors (Set B) investigating matrix contrast features, mean crown closure between both matrix stands ('matrix mean crown closure') and mean percent conifer composition between both matrix stands (matrix mean conifer') tended to omit
80
Table 6 Coefficients (β), standard errors (SE), p-values (p), residual deviance, and degrees of freedom of step-AIC (Venables and Ripley, 1994) selected binary Generalized Linear Models from three sets of field predictors, collected in Summer 2001 along sampling lines inside the test area, each explaining the presence or absence of a manually digitized cutline segment ('digitized point' vs. 'digitizing gaps' respectively). Name of Predictor Set
Set A (Structural Seismic Characteristics)
Uncorrelated Predictors (rt )
4.837 0.091 n/a 53.082