Debugging such concurrent programs is ... error, error detection, debugging, hardware counters. 1. ..... x86_64 GNU/Linu
UNSERIALIZABLE INTERLEAVING DETECTION USING HARDWARE COUNTERS Fernando Emmanuel Frati1, 2, Katzalin Olcoz Herrero3, Luis Piñuel Moreno3, Marcelo Naiouf1, Armando De Giusti1,2 1
Institute of Research in Computer Science LIDI (III-LIDI), School of Computer Science, UNLP, Argentina {fefrati, mnaiouf, degiusti}@lidi.info.unlp.edu.ar 2 National Commission of Scientific and Technical Research (CONICET) School of Computer Science, UNLP, Argentina 3 Group of Architecture and Technology of Computing Systems (ArTeCS), Complutense University of Madrid, España {katzalin, lpinuel}@dacya.ucm.es ABSTRACT Concurrent programs are needed to take advantage of multicore computers. Debugging such concurrent programs is very difficult due to their nondeterminism. So, error detection tools need to be used in production environments. One very popular detection technique is interleaving analysis, which detects atomicity violations in shared memory programs. Unfortunately, the algorithms that implement this technique can be very costly at runtime, restricting its use to the software testing stage. This paper shows how to use the hardware counters present in today's processors to detect the occurrence of unserializable interleavings. This optimization will reduce the overhead introduced by concurrency bug detection tools. KEY WORDS Parallel architectures, concurrent program, concurrency error, error detection, debugging, hardware counters 1.
INTRODUCTION
In any concurrent program, the programmer has to specify how processes are synchronized. Depending on the communication model used, there are different methods to establish synchronization. For example, in a shared memory model, it is common to use semaphores or monitors, whereas in a distributed memory model, message passing is commonly used. Concurrency errors occur when the programmer makes a mistake when using any of these methods, resulting in race conditions, deadlocks, or atomicity violations. One feature that makes concurrency errors particularly difficult to detect, is that they appear only under certain implementation condition, depending mainly on the nondeterminism present in the execution order of processes. If these errors do not occur during the test, the program will be part of the production systems for which it was thought, making them vulnerable.
These errors, their causes, and ways to avoid them have been studied extensively by the scientific community. In 1978, Lamport established the concept of partial order between segments of processes [1] (it is called Happens Before relation), and it has been used to build racecondition detection tools. Lockset (proposed in 1997 [2]) is a different method to detect race conditions which verifies that all shared variables are protected at the time they are accessed. Deadlocks are another example of common mistake present in concurrent programs. In 1972, Holt [3] proposed a model that was able to detect deadlock conditions for shared resources (in fact, this technique is used by operating systems to manage their resources). Finally, with the advent of multiprocessors to conventional computers, atomicity violations have begun to take a leading role because their occurrence is more generalized than before. In 2006, Shan Lu [4] postulated an analysis of the order in which multiple threads access memory to help detect atomicity violations. The technique classifies interleavings as serializable or unserializable, where the latter may be atomicity violations (this issue is addressed further on this paper). Atomicity violations have also been addressed by other authors [5], [6]. Any of these errors can be found frequently in widely used, real programs, such as Apache, MySQL, or Mozilla Firefox [7]. Due to this non-determinism in parallel execution, it would be very useful to have tools to monitor applications in production environments. Unfortunately, the overhead introduced by the detection algorithms is a determining factor in the viability of their use. For this reason, the current proposals tend to include a version of the algorithm which uses hardware extensions to accelerate them and reduce the impact of the instrumentation. These extensions involve changes to the architecture of the machines where they run (such as adding bits to the cache line). In this paper, a different approach is proposed: using data available through the processor's performance-counters to choose when to run detection algorithms. Previous experiments [8] indicate that much of the overhead caused
by the monitoring tool is wasted in monitoring safe code regions. A similar technique was used by Greathouse in 2011[9] to optimize a tool for detecting race conditions called Intel Inspector XE. However, this tool is only able to detect race conditions, and it uses algorithms based on happens-before and lockset. The techniques and conclusions of this work are aimed at determining the feasibility of using counters to detect unserializable interleavings, which will optimize techniques for detecting atomicity violations in shared memory environments. The hypothesis is that it will reduce the instrumentation overhead by restricting access to those which are actually not serializable. The paper is organized as follows: Section 2 offers a background and main concepts needed to follow the rest of the work. Section 3 presents our approach and the features addressed in this paper. Section 4 explains the algorithms used for the experiments. Section 5 describes the test environment. Section 6 shows the results of the experiments. Finally, in Section 7, conclusions are drawn. 2.
interleavings that may have been caused by a concurrency error. Proposals of this type seek the occurrence of unserializable interleavings. When an unserializable interleaving is detected, the tool emits an alert or initiates a corrective procedure (immediately after the error occurs), even to determine what instructions caused the error. The instrumentation required to perform this type of analysis introduces a high overhead in the monitoredapplication's runtime. As mentioned in the introduction, algorithms to implement this technique include a version that uses hardware extensions to accelerate, and thus diminish the impact of instrumentation. Table 2 shows the results of running the software and hardware versions of AVIO [4] on the suite of benchmarks SPLASH-2 applications. Unfortunately these extensions involve changes to the architecture of the machines they run on (e.g., add bits to the cache line), their application in real production environments thus becoming non-viable.
BACKGROUND
AVIO (Hardware)
AVIO (Software)
fft
0,5 %
42X
fmm
0,4 %
19X
lu
0,4 %
23X
radix
0,4 %
15X
Average
0,4 %
25X
Benchmarks
2.1 Interleavings Analysis Concurrency errors can be seen through the pattern access (reads and writes) that several processes make on each memory direction. When a variable is accessed between two accesses to it by a different thread, it is called interleaving. Depending on interleaving configuration, this could be a concurrency error. Table 1 shows the different possible configurations: in each case, both accesses by thread 0 are aligned to the left, whereas the one interleaved access by thread 1 is indented to the right. Over eight possible cases, four can be serialized. Serialized means that interleaving does not alter the perception that the processes involved have regarding the memory region they access, and is therefore considered to be safe. Interleavings 0, 1, 4 and 7 are safe because their occurrence produces the same effect as if they had not happened. On the other hand, cases 2, 3, 5 and 6 are Case
Interleaving
Case
Interleaving
0
read read read
4
read read write
1
write read read
5
write read write
2
read write read
6
read write write
3
write write read
7
write write write
Table 1. Each case shows a different interleaving configuration. Access are interleaved read/write operations to the same memory direction by two threads.
Tabla 2. Overhead comparison between hardware and software versions of AVIO over SPLASH-2 suite benchmarks. X represents application runtime without instrumentation.
2.2 Hardware counters All current processors have a set of special registers called hardware counters [10]. These registers can be programmed to count the number of times an event occurs within the processor during the execution of an application. Such events can provide information on different aspects of program execution (e.g., number of instructions executed, number of failures in L1 cache, or number of floating point operations executed). This information is intended to help developers understand the performance of their algorithms and optimize their programs. These events are poorly documented, and often vary between different architectures. Processor manufacturers usually offer a manual to indicate events and a brief description of what it is they are supposed to measure. 3.
HARDWARE COUNTERS INTEGRATION WITH CONCURRENCY BUG DETECTION TOOLS
The alternative proposed in this paper is to use the information provided by hardware counters about what is happening in the processor to filter safe regions of code. It
will improve the performance of bug detection tools based on interleaving analysis. The key is keeping the monitoring tool disabled and toggling it to enabled mode if unserializable interleavings start occurring. In order to reach this we need: – To know if unserializable interleavings can be detected through hardware counters. – To determine whether most interleavings are serializable or not. This would hint as to whether there is a chance of optimization with our proposal. – To characterize applications through their unserializable interleavings distribution in the code. Each one of these features will be explained in the next subsections.
Case
read write read
read read
2
write read
1
read write
3
write write
Even if an application has a high optimization potential, it is important to know how these unsafe accesses are distributed by the code. If they are concentrated, it is more likely that our approach will reach a high performance improvement. But if they are scattered over the code, our tool could start continuously toggling between the enabled and disabled modes. This scenario is undesirable because it could affect not only the performance, but also the detection capability of the tool. 4.
IMPLEMENTATION
4.1 Monitoring tool In order to capture the information needed, we designed a software layer placed between the target application and the hardware. Basically, this tool detects when a new thread is created and sets its affinity to a specific core (we make sure each thread is running in different cores to take advantage of the changes in coherence states) and starts a hardware counter configured for the selected event. The tool also keeps software counters for program instructions. It can classify them in reads, writes,
Our hypothesis is that overhead can be reduced if
write read read
0
3.3 Concentrated vs. distributed interleavings
3.2 Optimization feasibility
2
Pattern
monitoring is restricted to the regions of code that are unsafe. Thus, to determine if the technique proposed can improve the performance of the bug detection tool with a particular application, first we calculate the ratio between the number of unsafe accesses and total accesses. An application with an unsafe access indicator (UAI) near to zero has a high potential because it means there are few unserializable accesses, whereas an application with an UAI near to one has a low potential.
The goal is to find events that can be used to detect code segments of the program where unserializable interleavings occur. Since there are no events to measure interleavings, the problem is simplified to two accesses to the same memory address from different process. We assume each process to be running in different cores on a processor with at lest one level cache shared among them and a MESI based coherency protocol. Each access can be a read or a write operation. The complete interaction between the accesses of each process is called access pattern. Table 3 summarizes the four possible cases. In all cases, the event must occur with each read or write operation. In coherence MESI-based protocols, there is a "Shared state" (S) which indicates that the cache line has been read by more than one processor. The candidate events are those that indicate a transition to or from this state. Each access pattern helps detect different interleavings. Table 4 shows the relationship between these cases. As it can be seen, the access patterns that are useful for the purpose of this study are 1 and 2, because they allow tracing unserializable interleavings 2, 3, 5, and 6.
1
Case
Table 3. Each case shows a different pattern access to the same memory address by two threads.
3.1 Unserializable interleaving detection through hardware counters
0 Pattern access / read Interleaving read read
Pattern
3 write write read
4
5
read read write
write read write
6 read write write
7 write write write
0
read read
YES
YES
-
-
YES
-
-
-
1
read write
-
-
YES
-
YES
YES
YES
-
2
write read
-
YES
YES
YES
-
YES
-
-
3
write write
-
-
-
YES
-
-
YES
YES
Table 4. Each cell shows if the pattern access can be useful to detect an interleaving.
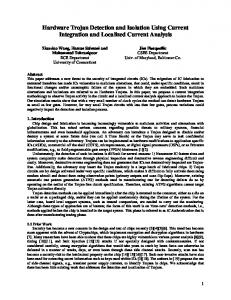
branches, and others. This information will be enough to know the UAI of the target application. The tool has two operation modes: 1. Showing statistics collected when the target application finishes. 2. Showing partial statistics collected every preset number of instructions. The second operation mode will allow us to determine the distribution of unserializable interleavings along the code. 4.2 Micro-benchmarks To verify that an event can be used to distinguish between different access patterns, we designed the microbenchmarks shown in Figure 1. In each case, the simulated interaction between two threads is repeated N times (N is a parameter of the program). Each thread has a local variable called tmp used to simulate the reading operations. The shared variable is represented by an array of N elements Var, which is initialized by the main program thread. In order to have visibility regarding code operation, functions P() and V() were implemented with shared variables, instead of using pthread semaphores. Figure 2 shows the pseudocode for these operations. Variables s1 and s2 act as semaphores initialized to 1 and 0 respectively. To avoid false sharing, a structure that fills the entire cache line for all vars (s1, s2 and array elements) was designed. This allows analyzing state changes associated with the read/write operations on these variables. 5.
EXPERIMENTAL SETUP
The monitoring tool was developed with the Pin [11] dynamic binary instrumentation framework, version 2.11. The perf_event system calls to access counters were used. Experiments were performed on a machine with two Xeon X5670 processors, each of which with 6 cores with HT. The operating system was a Debian wheezy/sid x86_64 GNU/Linux with kernel 3.2.0, and the compiler was gcc, version 4.7.0. No optimization options were used Thread 0
Thread 1
tmp = Var[c];
Thread 1
tmp = Var[c];
tmp = Var[c];
Case 0
Thread 0
V(cache_line *s){ *s++; } Figure 2. P() and V() functions used to synchronize threads.
because they may modify the codes to be analyzed. The micro-architecture of these processors, called Westmere, corresponds to the Nehalem micro-architecture with 32nm technology. This processor has three levels of cache – L1 (32KB) and L2 (256KB) are private of each core and L3 (12MB) is shared among all cores within the same physical processor [12]. The coherence protocol is based on MESI, but adds a fifth state, "Forward" (F), to indicate that the line was sent from one socket to another. In this scheme, a cache line that is read by several cores will be in state S for all copies and in all cache levels (L1, L2 and L3). When one of the copies is modified, its cache line state is changed to Modified (M). That change of state is propagated to the other cores, whose copies are changed to the Invalid state (I) [13]. The event selected was MEM_UNCORE_RETIRED: LOCAL_HITM, whose description in the Software Developer's Manual for Intel architectures [14] indicates that it counts the number of reading instructions on cache lines that are in state M in the cache of a sibling core, which means that this event can detect access pattern two (it occurs after the read operation). As far as we know, there is no event to detect access pattern one (at least in the Westmere micro-architecture). To see if the event selected was appropriate for our purposes, the micro-benchmarks explained in Section 4.2 were used. In all remaining experiments, the SPLASH-2 benchmark suite [15] was used. These benchmarks were run on 2 threads using the test inputs. Table 5 shows the configuration for each program of the suite.
Thread 0
Thread 1
Var[c] = 0;
Var[c] = 1;
Case 1 Repeat N times
P(cache_line *s){ while(*s