Unsupervised Classification of Dialogue Acts using a Dirichlet Process Mixture Model Nigel Crook, Ramon Granell, and Stephen Pulman Oxford University Computing Laboratory Wolfson Building Parks Road, OXFORD, UK
[email protected] [email protected] [email protected]
Abstract
other tasks such as summarisation, (Murray et al., 2006). Therefore, a correct DA classification of dialogue turns can bring benefits to the performance of these modules and tasks.
In recent years Dialogue Acts have become a popular means of modelling the communicative intentions of human and machine utterances in many modern dialogue systems. Many of these systems rely heavily on the availability of dialogue corpora that have been annotated with Dialogue Act labels. The manual annotation of dialogue corpora is both tedious and expensive. Consequently, there is a growing interest in unsupervised systems that are capable of automating the annotation process. This paper investigates the use of a Dirichlet Process Mixture Model as a means of clustering dialogue utterances in an unsupervised manner. These clusters can then be analysed in terms of the possible Dialogue Acts that they might represent. The results presented here are from the application of the Dirichlet Process Mixture Model to the Dihana corpus.
1
Many machine learning approaches have been used to automatically label DAs. They are usually based on Supervised Learning techniques involving combinations of Ngrams and Hidden Markov Models (Stolcke et al., 2000; Mart´ınezHinarejos et al., 2008), Neural Networks (Garfield and Wermter, 2006) or Graphical Models (Ji and Bilmes, 2005). Relatively few approaches to DA classification have been based on unsupervised learning methods. Some promising results were reported by Anderach et al (Andernach et al., 1997; Andernach, 1996) who applied Kohonen Self Organising Maps (SOMs) to the problem of DA classification. Although the SOM is nonparametric in the sense that it doesn’t require that the number of clusters to be found in the data be a parameter of the SOM that is specified before clustering begins, it’s capacity to detect clusters is limited to the size of the two-dimensional lattice onto which the clusters are projected, and the size of this lattice is determined prior to clustering. This paper investigates the use of an unsupervised, nonparametric Bayesian approach to automatic DA labelling: namely the Dirichlet Process Mixture Model (DPMM). Specifically, the paper reports results from applying the Chinese Restaurant Process (CRP), a popular approach to DPMMs, to the automatic labelling of DAs in the Dihana corpus. The Dihana corpus (J.M.Bened´ı et al., 2006) has previously been used for the same task but with a supervised learning approach (Mart´ınezHinarejos et al., 2008). The results reported here indicate that, treating each utterance as a bag of words, the CRP is capable of automatically clus-
Introduction
Dialogue Acts (DAs) are an important contribution from discourse theory to the design of dialogue systems. These linguistics abstractions are based on the illocutionary force of speech acts (Austin, 1962) and try to capture and model the communicative intention of human or machine utterances. In recent years, several dialogue systems have made use of DAs for modelling discourse phenomena in either the Dialogue Manager (Keizer et al., 2008), Automatic Speech Recogniser (Stolcke et al., 2000) or the Automatic Speech Synthesiser (Zovato and Romportl, 2008). Additionally, they have been used also in
Proceedings of SIGDIAL 2009: the 10th Annual Meeting of the Special Interest Group in Discourse and Dialogue, pages 341–348, c Queen Mary University of London, September 2009. 2009 Association for Computational Linguistics
341
Level First
tering most utterances according to speaker, level 1 and in some cases level 2 DA annotations (see below).
2
The Dihana corpus
Second
The Dihana corpus consists of human-computer spoken dialogues in Spanish about queuing information of train fares and timetables. The acquisition was performed using the Wizard of Oz (WoZ) technique, where a human simulates the system following a prefixed strategy. User and system utterances are different in nature, user utterances are completely spontaneous speech whereas system utterances are based on pre-written patterns that the WoZ selected according to what the user said in the previous turn, the current dialogue state and the WoZ strategy. There is a total of 900 dialogues with a vocabulary of 823 words. However, after applying a process of name entity recognition (cities, times, number, ...) and making the distinction between system and user words there are 964 different words. The same process of name entity recognition was also used by Martinez Hinarejos (Mart´ınez-Hinarejos et al., 2008)
Third
Table 1: Set of dialogue act labels used in the Dihana corpus
automatic, unsupervised clustering of the utterances in the Dihana corpus. This approach treats each utterance as a bag of words (i.e. an unordered collection of words) (Sebastiani, 2002). Utterances are clustered according to the relative counts of word occurrences that they contain so that utterances with similar histograms of word counts will, in general, appear in the same cluster.
2.1 Annotation scheme Dialogues were manually annotated using a dialogue act annotation scheme based on three levels (see Table 1). The first level corresponds to the general intention of the speaker (speech act), the second level represents the implicit information that is referred to in the first level and the third level is the specific data provided in the utterance. Using these three levels and making the distinction between user and system labels, there are 248 different labels (153 for the user and 95 for the system). Combining only first and second level there are 72 labels (45 for user and 27 for system), and with only first level there are 16 labels (7 for user and 9 for system). Annotation was done at utterance level. That is, each dialogue turn was divided (segmented) into utterances such that each one corresponds to a unique DA label. An example of the segmentation and annotation of two turns of a dialogue can be seen in Figure 1
3
Labels Opening, Closing, Confirmation, Undefined, Not-understood, Waiting, Consult, Acceptance, Rejection Departure-hour, Arrival-hour, Fare, Origin, Destination, Day, Train-Type, Service, Class, Trip-time Departure-hour, Arrival-hour, Fare, Origin, Destination, Day, Train-Type, Service, Class, Trip-time, Order-number, Number-trains, Trip-type
Bayesian methods for unsupervised data clustering divide into parametric and nonparametric approaches. Parametric approaches to clustering such as Finite Bayesian Mixture Models (Mclachlan and Peel, 2000) require prior estimation of the number of clusters that are expected to be found in the data. However, it is not always possible to know this in advance and often it is necessary to repeat a modelling experiment many times over a range of choices of cluster numbers to find an optimal number of clusters. Sub-optimal choices for the number of clusters can lead to a degradation in the generalisation performance of the model. Nonparametric approaches to mixture modelling, on the other hand, do not require prior estimates of the number of clusters in the data; this is discovered automatically as the model clusters the data. Dirichlet Processes offer one approach to developing Bayesian nonparametric mixture models. The remainder of this section briefly introduces DPMMs, beginning with a brief look at finite Bayesian mixture models which will serve as useful background for presenting the Chinese Restaurant Process, the Dirichlet Process paradigm used in this paper.
Dirichlet Process Mixture Models
This paper present a Dirichlet Process Mixture Model (DPMM) (Maceachern and M¨uller, 1998; Escobar and West, 1995; Antoniak, 1974) for the
342
Speaker
Utterance
S
S1
U
U1 U2
Transcription Level 1 Level 2 Level 3 Welcome to the railway information system. How may I help you? Opening Nil Nil Could you tell me the departure times from Valencia Question Departure-hour Origin to Madrid . Question Departure-hour Destination
Figure 1: An example of some turns from an annotated dialogue of D IHANA corpus.
Figure 2: A 3-simplex with two examples points and the corresponding distributions
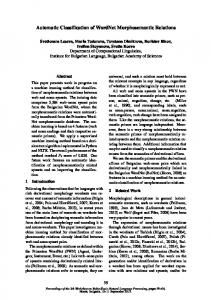
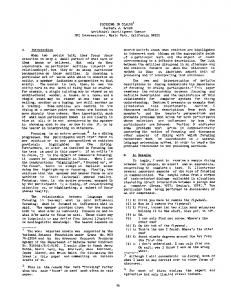
3.1 Finite Bayesian Mixture Models A Dirichlet distribution is defined as a measure on measures. Specifically, a Dirichlet distribution defines a probability measure over the k-simplex. The k-simplex is a convex hull constructed so that each point on the surface of the simplex describes a probability distribution over k outcomes: Qk = {(x1 , . . . , xk ) : xi ≥ 0 ∀i ∈ {1 . . . k},
k X
xi = 1}
i=1
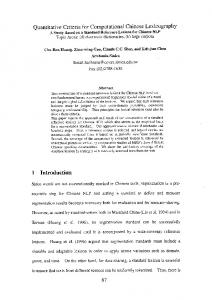
Figure 2 shows a 3-simplex with two example points and the corresponding distributions. The Dirichlet distribution places a probability measure over the k-simplex so that certain subsets of points on the simplex (i.e. certain distributions) have higher probabilities than others (Figure 3). The probability measure in the Dirichlet is parameterised by a set of positive, non-zero concentration constants α = {α1 , . . . αk : αi > 0}, written Dirichletk (α1 , . . . αk ). The effects of different values of α for the 3-simplex are shown in Figure 3. The probability density function of the Dirichlet
Figure 3: Three example Dirichlet Distributions over the 3-simplex with darker regions showing areas of high probability: (a) Dirichlet(5,5,5), (b) Dirichlet(0.2, 5, 0.2), (c) Dirichlet(0.5,0.5,0.5).
343
distribution is given by: Dirichletk (α1 , . . . , αk ) = f (x1 , . . . , xk ; α1 , . . . , αk ) P k Γ( ki=1 αi ) Y ai −1 xi = Qk i=1 Γ(αi ) i=1 R∞ where Γ(x) (= 0 t(x−1) e−t dt) extends the factorial function to the real numbers. Since a draw from a Dirichlet distribution (written β ∼ Dirichletk (α)) gives a distribution, a Dirichlet can be used as the prior for a Bayesian finite mixture model: β ∼ Dirichletk (α1 , . . . , αk )
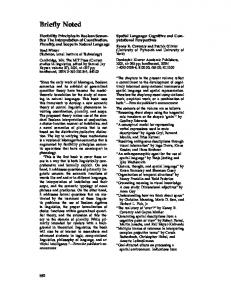
Figure 4: An example finite Bayesian mixture model. (a) The prior distribution over components φz1 (b) and φz2 (c)
β is a distribution over the k components φ of the finite mixture model. Each component φzi is drawn from a base measure G0 (φzi ∼ G0 ). The choice of distribution G0 depends on the nature of the data to be clustered; with data that is represented using the bag of words model, G0 must generate distributions over the word vocabulary. Hence the Dirichlet distribution is an appropriate choice in this case:
utterances containing more occurrences of word A than B or C, whilst φz2 will tend to generate utterances with more C’s than A’s or B’s. A component zi is then selected for each utterance (zi ∼ M ultinomialk (β)). Note that in this example, the distribution β would lead to more utterances generated by φz2 than by φz1 . Suppose that five utterances are to be generated by this model and that the components for each utterance are z1 = 1, z2 = 2, z3 = 2, z4 = 1 and z5 = 2. The words in each utterance are then generated by repeated draws from the corresponding component (e.g. x1 = ACAAB, x2 = ACCBCC, x3 = CCC, x4 = CABAAC and x5 = ACC).
φzi ∼ Dirichletv (α1 , . . . , αv ) where v is the size of the vocabulary. For each data point (utterance) xi a component φzi is selected by a draw zi from the multinomial distribution β: zi ∼ M ultinomialk (β) A suitable distribution F (φzi ) is then used to draw the data point (utterance). In the bag of words model, the multinomial distribution is used to draw the words for each data point xi :
3.2 Dirichlet Processes A Dirichlet Process can be thought of as an extension of a Dirichlet distribution where the dimensions of the distribution are infinite. The problem with the infinite dimension Dirichlet distribution, though, is that its probability mass would be distributed across the whole of the distribution. However, in most practical applications of mixture modelling there will be a finite number of clusters. The solution is to have a process which will tend to place most of the probability mass at the beginning of the infinite distribution, thereby making it possible to assign probabilities to clusters without restricting the number of clusters available. The GEM stick breaking construction (the name comes from the first letters of Griffiths, Engen and McCloskey (Pitman, 2002)) achieves precisely this (Pitman and Yor, 1997). Starting with
xi ∼ M ultinomialv (φzi ) A small example will illustrate this generative process. Imagine that there are just two types of utterances with a vocabulary consisting simply of the words A, B and C. A finite Bayesian mixture model in this case would first draw β from a suitable Dirichlet distribution (e.g. β ∼ Dirichlet2 (0.5, 1)) as, for example, is shown in Figure 4(a). Next the two components φz1 and φz2 would be drawn from a suitable base distribution G0 (e.g. φz1 ∼ Dirichlet3 (1, 0.5, 0.5) and φz2 ∼ Dirichlet3 (0.5, 0.5, 1), see Figure 4(b) and 4(c)). In this case, φz1 will tend to generate
344
a stick of unit length, random portions βk′ are repeatedly broken off the stick, with each part that is broken off representing the proportion of probability assigned to a component: βk′ ∼ Beta(1, α)
βk =
Qk−1 i+1
(1 − βi′ ) · βk′
The Dirichlet Process mixture model can now be specified as: β ∼ GEM (α) φzi ∼ G0 zi ∈ (1 . . . ∞) zi ∼ M ultinomial(β) xi ∼ F (φzi ) 3.3 Chinese Restaurant Process The Chinese Restaurant Process (CRP) is a popular Dirichlet Process paradigm that has been successfully applied to many clustering problems. In the CRP, one is asked to imagine a Chinese restaurant with an infinite number of tables. The customers enter the restaurant and select, according to a given distribution, a table at which to sit. All the customers on the same table share the same dish. In this paradigm, the tables represent data clusters, the customers represent data points (xi ) and the dishes represent components (φz ). As each customer (data point) enters the restaurant the choice of which table (cluster) and therefore which dish (component) is determined by a draw from the following distribution:
φi |φ1 , . . . , φi−1 ∼
1 (α + i − 1)
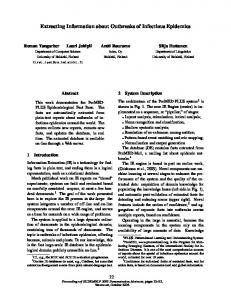
Figure 5: The first four steps of the initial clustering process of the CRP. The probability distribution over the tables is also shown in each case. i.e. component), and making a draw from that distribution to determine the new table for that customer. The posterior distribution across the tables is calculated as follows:
i−1 X δφj + αG0 j=1
where α is the concentration parameter for the CRP. The summation over the δφj ’s counts the number of customers sat at each of the occupied tables. The probability of sitting at an already occupied table, therefore, is proportional to the number of customers already sat at the table, whilst the probability of starting a new table is proportional to αG0 . Figure 5 illustrates four iterations of this initial clustering process. Once all the customers (data points) have been placed at tables (clusters), the inference process begins. The posterior p(β, φ, z|x) cannot be calculated exactly, but Gibbs sampling can be used. Gibbs sampling for the CRP involves iteratively removing a randomly selected customer from their table, calculating the posterior probability distribution across all the occupied tables together with a potential new table (with a randomly drawn dish,
φi |φ1 , . . . ,φi−1 , x i−1 X 1 ∼ δφj p(xi |φj ) + αG0 p(xi |φi ) B j=1
P where B = αp(xk ) + i−1 j=1 p(xi |φi ) is the normalising constant. After a predetermined number of samples, the dish (component) of each occupied table is updated to further resemble the customers (data points) sitting around it. In the bag of words approach used here, this involves converting the histogram of word counts in each customer (utterance) sitting at the table into an empirical distribution H(xi ), taking the average of these empirical distributions and modifying the dish (component) to further resemble this distribution: mi µ X H(xj ) φi = φi + mi j=1
where µ (0 ≤ µ < 1) is the learning constant and mi is the number of customers around
345
Cluster No. 1 4 9 12 13 14 15 17 18 19 20 22 23 25 28 29 33 41 46 49 51 53
table i. The inference process continues to iterate between Gibbs sampling and updating the table dishes (components) until the process converges. Convergence can be estimated by observing n consecutive samples in which the customer was returned to the same table they were taken from.
4
Results
The CRP with Gibbs sampling was used to cluster both user and system utterances from the 900 dialogues in the Dihana corpus. Each utterance is treated as an independent bag of words where all information about the dialogue that it came from and the context in which it was uttered is ignored during training. Intra-cluster and inter-cluster similarity measures were used to evaluate the resulting clusters. Intra-cluster similarity Si′ is calculated by averaging the Euclidean distance between every pair of data points in the cluster i: Si′ =
1 2mi
mi X
|xi − xj |
i=1;j=1
Inter-cluster similarity S ′′ is calculated by summing the Euclidean distance between the centroids of all pairs of clusters: ′′
S =
n X
Ans 1 2 7 273 382 6 47 73 131 270 135 83 247 349 13 202 6 124 45
Ask 91 2 161 26 12 1 39 1 115 29 8 31 16 6 3 45 4 251 896 477
Clo
Not
Rej
1
327 1 1
1 1 1 909
1 3
3 2
1 1 1 5 1 1 1
1
2
4 2
Und 5 2 9 1 8 5 22 1 3 4 1 3 2 4 4 12 25 3 1 4 12 10
Table 2: Clusters of user utterances, with the counts for each level 1 speech act. The largest cluster for each speech act is in bold. The abbreviations are: Und = Undefined, Ans = Answering, Ask = Asking, Clo = Closing, Rej = Rejection, Not = Not-understood.
|Ci − Cj |
i=1;j=1
where Ci is the centroid of cluster i and n is the number of clusters. Two classification error measures were also used, one from the cluster (table) perspective E ′ , and the other from the perspective of the Dialogue Act (DA) annotations (first level) of the Dihana corpus E ′′ . The cluster classification error of table i is calculated by summing up the occurrences of each DA on the table, finding the DA with the largest total and allocating that DA as the correct classification for that table Di . The number of false positives fip for that table is the count of all customers (utterances) with DA annotations not in Di . The number of false negatives fin is the count of utterances with label Di that occur on other tables. The cluster classification error for table i is therefore: 1 Ei′ = (fip + fin ) n The DA classification error Ei′′ measures how well DA i has been clustered, using the size of the
DA class Nic , the size of the largest cluster of utterances from that DA class Mic , and the total number of utterances n in the corpus:
Ei′′ =
1 c (N − Mic ) n i
Table 6 summarises the results from three separate runs of the CRP, each increasing in number of epochs. It should be noted here that the Dihana corpus has 72 DA categories, so the ideal number of clusters discovered by the CRP would be 72. It should also be noted that given an initial random clustering, a good clustering algorithm will reduce intra-cluster similarity (S¯′ ), increase inter-cluster similarity (S ′′ ) and reduce the classification errors (E¯′ and E¯′′ ).
346
Epochs (K) 0 1000 1500
No. Clusters 70 44 54
S¯′ 99703.6 14975.4 10093.7
S ′′ 243.74 217.56 336.15
E¯′ 0.05303 0.01711 0.01751
E¯′′ 0.00979 0.00385 0.00435
Figure 6: The results from three separate runs of the CRP on utterances from the Dihana corpus. Cluster similarity measures and classification error values are shown after 0 (i.e. random clustering), 1000K, and 1500K epochs. S¯′ , E¯′ and E¯′′ are averaged values. Level 1
Level 2
Answering
Day Destination Fare Departure-hour Departure-hour,Fare Train-type Fare Departure-hour
Asking
Cluster No. 14 22 29 28, 41 4 12 49 51, 53
taining user utterances only and 2 clusters containing instances of both. Given that the system utterances in the Dihana corpus are generated from a restricted set of sentences, it is not surprising that these were easy to cluster and differentiate from user utterances. However, the CRP was also able to cluster user utterances well, which is more of a challenge. Table 2 shows the clusters that have specialised on user utterances, with the counts of the level 1 annotations in each case. The largest cluster for each level 1 annotation is shown in bold typeface. From here it can be seen that cluster 15 has specialised on both Closing and Rejection. It is not surprising that these fall within the same cluster since the words used in each are often the same (e.g. “No thank you” can act as either a closing statement or a rejection statement). Clusters 14, 22, 29, 28 and 41 have specialised to the Answering annotation, whilst clusters 4, 12 49, 51 and 53 have specialised to Asking. Table 3 shows how each of these clusters have specialised to level 2 annotations. Cluster 14, for example, specialises on the Answering:Day pair, whilst 22 specialises on Answering:Destination pair. These initial results show that, at least for the Dihana corpus, the DPMM can successfully cluster utterances into Speaker, Level 1, and Level2 classes. Whilst this looks promising, it must be acknowledged that the Dihana corpus is restricted to train service inquiries and it remains unclear whether this approach will generalise to other dialogue corpora with a broader range of topics and wider vocabularies. Future work will include investigating the use of ngrams of words, syntactic features, the DAs of previous utterances and experimentation with other corpora such as Switchboard (Godfrey et al., 1992).
Table 3: Clusters that have specialised on level 1 and level 2 annotations.
5
Discussion
The first row of the table in Figure 6 shows the cluster similarity measures and classification errors after 0 epochs of the inference procedure (i.e. for a random clustering of utterances). This gives a baseline for the measures and error values used in subsequent runs. The second row of values shows the results after a run of 1000K epochs of the inference procedure. This run finds only 44 clusters but has a much lower value for S¯′ than was found in the random clustering, showing a significant increase in the similarity between utterances within each cluster. Surprisingly, the value for S ′′ is also reduced, showing that the differentiation between the clusters formed at this stage is even lower than there was with the random clustering. E¯′ and E¯′′ show suitable reductions indicating that the classification errors are being reduced by the inference process. The third row of values show that after 1500K epochs 54 clusters have been found, intracluster similarity is increased beyond that for the random clustering, but the classification errors remain essentially the same as for the 1500K run. Although the 1500K epoch run found only 54 clusters, it was able to clearly distinguish between system and user utterances: with 30 clusters containing system utterances only, 22 clusters con-
Acknowledgments This work was funded by the Companions project (www.companions-project.org) sponsored by the
347
European Commission as part of the Information Society Technologies (IST) programme under EC grant number IST-FP6-034434. We thank Jeff Bilmes (University of Washington) for many very helpful discussions about Dirichlet processes and their application.
C. D. Mart´ınez-Hinarejos, J. M. Bened´ı, and R. Granell. 2008. Statistical framework for a spanish spoken dialogue corpus. Speech Communication, 50:992–1008. Geoffrey Mclachlan and David Peel. 2000. Finite Mixture Models. Wiley Series in Probability and Statistics. Wiley-Interscience, October. Gabriel Murray, Steve Renals, Jean Carletta, and Johanna Moore. 2006. Incorporating speaker and discourse features into speech summarization. In Proceedings of the main conference on Human Language Technology Conference of the North American Chapter of the Association of Computational Linguistics, pages 367–374, Morristown, NJ, USA. Association for Computational Linguistics.
References Toine Andernach, Mannes Poel, and Etto Salomons. 1997. Finding classes of dialogue utterances with kohonen networks. In In Daelemans, pages 85–94. J.A. Andernach. 1996. A machine learning approach to the classification and prediction of dialogue utterances. In Proceedings of the 2nd International Conference on New Methods in Language Processing, pages 98–109.
J. Pitman and M. Yor. 1997. The two-parameter Poisson-Dirichlet distribution derived from a stable subordinator. Annals of Probability, 25(2):855–900.
Charles E. Antoniak. 1974. Mixtures of dirichlet processes with applications to bayesian nonparametric problems. The Annals of Statistics, 2(6):1152–1174.
J. Pitman. 2002. Combinatorial stochastic processes. Fabrizio Sebastiani. 2002. Machine learning in automated text categorization. ACM Comput. Surv., 34(1):1–47, March.
J.L. Austin. 1962. How to do things with words. Oxford: Clarendon Press.
Andreas Stolcke, Noah Coccaro, Rebecca Bates, Paul Taylor, Carol Van Ess-Dykema, Klaus Ries, Elizabeth Shriberg, Daniel Jurafsky, Rachel Martin, and Marie Meteer. 2000. Dialogue act modeling for automatic tagging and recognition of conversational speech. Comput. Linguist., 26(3):339–373.
Michael D. Escobar and Mike West. 1995. Bayesian density estimation and inference using mixtures. Journal of the American Statistical Association, 90(430):577–588. Sheila Garfield and Stefan Wermter. 2006. Call classification using recurrent neural networks, support vector machines and finite state automata. Knowl. Inf. Syst., 9(2):131–156.
E. Zovato and J. Romportl. 2008. Speech synthesis and emotions: a compromise between flexibility and believability. In Proceedings of Fourth International Workshop on Human-Computer Conversation, Bellagio, Italy.
J. J. Godfrey, E. C. Holliman, and J. Mcdaniel. 1992. SWITCHBOARD: telephone speech corpus for research and development. In Proc. ICASSP, volume 1, pages 517–520 vol.1. Gang Ji and J. Bilmes. 2005. Dialog act tagging using graphical models. In Acoustics, Speech, and Signal Processing, 2005. Proceedings. (ICASSP ’05). IEEE International Conference on, volume 1, pages 33– 36. J.M.Bened´ı, E.Lleida, A. Varona, M.J.Castro, I.Galiano, R.Justo, I. L´opez, and A. Miguel. 2006. Design and acquisition of a telephone spontaneous speech dialogue corpus in spanish: Dihana. In Fifth International Conference on Language Resources and Evaluation (LREC), pages 1636–1639, Genova, Italy, May. S. Keizer, M. Gasic, F. Mairesse, B. Thomson, K. Yu, and S. Young. 2008. Modelling user behaviour in the his-pomdp dialogue manager. In IEEE SLT, pages 121–124, Dec. Steven N. Maceachern and Peter M¨uller. 1998. Estimating mixture of dirichlet process models. Journal of Computational and Graphical Statistics, 7(2):223–238.
348