Magnetic Resonance in Medicine 59:181–189 (2008)
Unsupervised Estimation of Myocardial Displacement From Tagged MR Sequences Using Nonrigid Registration Maria J. Ledesma-Carbayo,1,2 J. Andrew Derbyshire,1 Smita Sampath,1 Andre´s Santos,2 Manuel Desco,3 and Elliot R. McVeigh1* We propose a fully automatic cardiac motion estimation technique that uses nonrigid registration between temporally adjacent images to compute the myocardial displacement field from tagged MR sequences using as inputs (sources) both horizontally and vertically tagged images. We present a new multisource nonrigid registration algorithm employing a semilocal deformation model that provides controlled smoothness. The method requires no segmentation. We apply a multiresolution optimization strategy for better speed and robustness. The accuracy of the algorithm is assessed on experimental data (animal model) and healthy volunteer data by calculating the root mean square (RMS) difference in position between the estimated tag trajectories and manual tracings outlined by an expert. For the ⬃20000 tag lines analyzed (45 slices over 20 – 40 time frames), the RMS difference between the automatic tag trajectories and the manually segmented tag trajectories was 0.51 pixels (0.25 mm) for the animal data and 0.49 pixels (0.49 mm) for the human volunteer data. The RMS difference in the separation between adjacent tag lines (RMS_TS) was also assessed, resulting in an RMS_TS of 0.40 pixels (0.19 mm) in the experimental data and 0.52 pixels (0.56 mm) in the volunteer data. These results confirm the subpixel accuracy achieved using the proposed methodology. Magn Reson Med 59: 181–189, 2008. © 2007 Wiley-Liss, Inc. Key words: MRI; heart; myocardial motion; tagged MRI; motion tracking; nonrigid registration
Most heart diseases involve changes in the mechanical properties of the myocardial tissue either by direct damage or as an indirect compensation process. The study of these properties is very relevant both for better understanding of the pathophysiological processes and for their impact in clinical protocols to achieve earlier diagnosis and better follow- up. In this context, regional myocardial motion estimation is a key measurement for understanding both healthy and pathological mechanics. It has been demon-
1Laboratory of Cardiac Energetics, National Heart, Lung and Blood Institute, National Institutes of Health, Department of Health and Human Services, Bethesda, Maryland, USA. 2ETSI Telecomunicacio ´ n, Universidad Polite´cnica de Madrid, Madrid, Spain. 3Hospital General Universitario Gregorio Maran ˜ on, C Dr. Esquerdo, 46, Madrid, Spain. Grant sponsor: the Fulbright Program; Grant number: Ruth Lee Kennedy grant; Grant sponsor: the Spanish Health Ministry; Grant numbers: PI041495, PI041920, and PI052204; Grant sponsor: the CDTEAM project from the CENIT program (Spanish Ministry of Industry); Grant sponsor: the Intramural Research Program of the National Heart Lung and Blood Institute, NIH; Grant number: Z01HL004609. *Correspondence to: Elliot R. McVeigh, Laboratory of Cardiac Energetics, National Institutes of Health, National Heart, Lung and Blood Institute, 10 Center Drive, MSC-1061, Building 10, Room B1D416, Bethesda, Maryland 20892-1061. E-mail:
[email protected] 23 October 2006; 4 September 2007; 16 September 2007 DOI 10.1002/mrm.21444 Published online 3 December 2007 in Wiley InterScience (www.interscience. wiley.com).
© 2007 Wiley-Liss, Inc.
strated that MR tagging is capable of measuring local myocardial function with superb accuracy (1,2) and that the sensitivity of the detection of the wall motion abnormalities is increased in the presence of tags (3). Myocardial tagging was first addressed by Zerhouni et al. (4) and Axel and Dougherty in 1989 (5). These techniques use spin tagging concepts to produce noninvasive markers in the myocardial tissue that persist during at least part of the cardiac cycle. The tagging process is based on modulating the longitudinal magnetization of the tissue just before the sequence of images is acquired. Spatial modulation of magnetization (SPAMM) is the most common technique used to produce sinusoidal tag patterns (5,6). Myocardial motion estimation can also be addressed using alternative techniques such as displacement encoding with stimulated echoes (DENSE) (7), harmonic phase MRI (HARP) (8), or phase contrast techniques. (9). For further details on myocardial motion MR sequences and MR tagging, refer to refs. 10 and 11. Tissue motion and deformation can be assessed by tracking the tags over time with image postprocessing algorithms. Typical image processing schemes that propose to analyze MRI tagging data usually involve three steps: segmentation of the myocardium (endocardium and epicardium) (12); detection of tag points in each slice and time frame (13); and fitting a motion field to the tags detected (14). While most tracking methods have been developed for 2D data, 3D extensions (or 4D [3D plus time]) have also been proposed, combining volumetric acquisitions of short-axis and long-axis images (14 –16). Previous methods have proposed various segmentation techniques, such as snakes or deformable models (17,18), in some cases combined with finite element models (19) or mechanical constraints (20,21). Energy-based techniques such as registration (22) or optical flow (23) have also been proposed to track and fit myocardial motion. In particular, Bspline models have been extensively proposed within segmentation strategies using Bsnakes and Bsolids (15,24,25) or in model fitting strategies both spatial and spatiotemporal (14,22,26). Declerck et al., in their motion reconstruction comparison (2), proved that Bsplines constitute the best motion fitting model. Most of these schemes allow the computing of left ventricular segmental displacement and strain. However, most of them are too slow to be used in clinical practice and require user intervention. The recently proposed HARP technique (8) presents a new way to obtain the displacement field efficiently from tagged images by isolating the spectral peaks corresponding to the tag pattern in the frequency domain. Myocardial motion is computed automatically using spectral optical flow techniques that track the phase tagged in the myocardial tissue. A drawback of this technique is that the spec-
181
182
M.J. Ledesma-Carbayo et al.
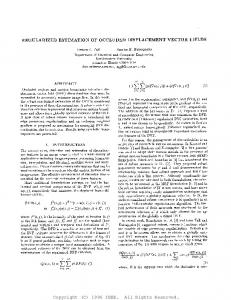
FIG. 1. Scheme proposed for tracking the myocardial displacement through time. Partial displacement fields g⬘t between consecutive pairs of images are obtained using the complete and complementary information of horizontally and vertically tagged images. The total displacement field, gt(X), is then obtained from the contribution of the partial fields.
tral power associated with the DC peak can interfere with the process; therefore, innovative schemes have been proposed to eliminate this DC peak (27–29). More detailed information on cardiac MRI motion analysis and mathematical models and postprocessing techniques can be found in ref. 16. In this paper, nonrigid image registration is used to estimate myocardial motion from 2D sequences that contain any tagging pattern. Nonrigid registration methods have been previously addressed to compute 3D myocardial motion estimates using information theory metrics (22). However, these metrics may not be adequate in the 2D context due to the small number of samples (30). Therefore, we propose to use a robust similarity criterion based on pixel intensity together with a semilocal parametric transformation model to represent and estimate the myocardial motion (31–33). The method proposed is a multisource method that takes advantage of all the image information present in the two inputs of the algorithm, the horizontally and vertically tagged images (34). Myocardial segmentation is not required and therefore the method is completely unsupervised. The method has been evaluated with respect to expert manual tracings on data from an animal model and volunteers, obtaining subpixel accuracy. METHODS Automatic estimation of the myocardial motion field was computed using a multisource nonrigid registration algo-
rithm based on a semilocal Bspline parametric model (31,33,35). This approach estimates the interframe displacement fields, g⬘t (x), from consecutive pairs of images obtained from the given sequences. The Lagrangian motion field, g(t,X), is then calculated by accumulating the displacements from the partial fields over time. The multisource inputs to the proposed algorithm are both the horizontally and vertically tagged image sequences. The 2D motion field g(t,X) is therefore computed to be consistent with all the information present in both inputs. Problem Definition Let us consider the image sequences fa(t,x) and fb(t,x), corresponding to the image intensities in the vertically and horizontally tagged images respectively, with t ⫽ 1, . . ., T and x ⬅ (x1, x2) 僆 I. Our goal is to estimate a 2D motion field g(t,X) over the whole temporal domain that is consistent with all the provided information. Figure 1 shows the scheme of the approach presented. We choose to represent the motion following a Lagrangian representation with respect to the first frame of the image sequences; a point at coordinate x1 ⫽ X in the first frame (t ⫽ 1) will move to the location xt ⫽ g(t,X) at time t. The formulation is therefore defined as: g共t,X兲 ⬅ gt 共X兲 where t ⫽ 1, . . ., T and X ⬅ (x1, x2) 僆 I.
[1]
Automated Cardiac Motion Assessment
183
FIG. 2. Multisource nonrigid registration scheme. The nonrigid registration problem between consecutive frames of sequences is formulated as an optimization problem that finds the best transformation minimizing the given criterion E. This criterion encompasses a similarity metric between the multisource test and reference data and a regularization term to guarantee overall smoothness.
We define a series of transformations, g⬘t(xt-1), between successive pairs of images that describe the g(t,X) such that: g t 共X兲 ⫽ gⴕt 共xt⫺1 兲 ⫹ gt⫺1 共X兲
Optimization Criterion The optimization criterion used in our registration scheme is composed of two different terms, a data term ED and a regularization term ER.
[2] E ⫽ E D ⫹ ␣E R
where xt-1 ⫽ gt-1(X) for t ⫽ 2,. . . T and g1 (X) ⫽ X for t ⫽ 1, with the g⬘t(xt-1) found through independent multisource nonrigid registration processes. Multisource Nonrigid Registration The interframe displacement field g⬘t(x) was obtained using a multisource nonrigid registration algorithm based on work previously presented (33,35). The registration process is formulated as an optimization procedure that minimizes a criterion E(fa, fb) to find the best transformation parameters that define g⬘t(x) (Fig. 2). More specifically, given the consecutive image pairs (fa(t-1,x), fb(t-1,x)) as reference and (fa(t,x), fb(t,x)) as test, the method finds a correspondence function g⬘t, which relates the coordinates of both pairs of images. The same spatiotemporal sampling is assumed for fa and fb before applying the proposed method. The following subsections extend the key parts of the algorithm: the optimization criterion, the transformation model, and the optimization procedure.
[3]
The data term is the summation of the contributions coming from the two different sources of information fa and fb. For each source image, the sum of squared differences between the pixels (x僆 I) in the reference image (fa(t-1,x), fb(t-1,x)) and the corresponding ones in the warped version of the test image (fwa , fwb) ⫽ (fa (t,x⫹g⬘t(x)), fb (t,x⫹g⬘t(x))) is computed. As a result, the following expression is obtained: E D ⫽ 1/共2N 1兲
冉冘
冊
2
(f a共t,x ⫹ gⴕt(x)兲 ⫺ fa 共t ⫺ 1,x兲 ⫹
冘
共fb 共t,x ⫹ gⴕt 兲共x兲兲 ⫺ fb 共t ⫺ 1,x兲)2 )
[4]
where NI is the number of pixels in each frame and the summation is over x, the pixel pairs defined in Eq. [1]. We chose to use the sum of squared difference (SSD) criterion because of its simplicity, fast computation time, and smoothness of the resulting search space. The extension of this criterion to the multisource case provided good
184
M.J. Ledesma-Carbayo et al.
results in the proposed framework. The use of this measurement actually assumes an intensity conservation between consecutive frames that can be admitted in the case of tagged MR image frames separated by short time intervals as compared with T1 recovery (23). However, if required, the T1 signal modulation could also be included in the criterion (23). A regularization term was added to the data term to improve the stability of the solution and to overcome some of the intrinsic difficulties of the registration process such us intracavitary intensity variations, through-plane motion, noise and artifacts. As a reasonable regularization term, the vector Laplacian of the transformation was chosen, providing good results for low values of the weight ␣.
ER ⫽
冕冕
储ⵜ 2gⴕ t 储2 dx1 dx2
[5]
Speed and robustness are improved by the use of a multiresolution approach in both the image and the transformation space. The multiresolution methodology used creates a pyramid of subsampled images optimal in the L2-sense, taking advantage of the spline representation (37). The problem is solved starting at the coarser level of the pyramid (the most subsampled image) and proceeding to the finest level. For each image level, two levels of deformation are optimized following also a coarse to fine strategy. Spatiotemporally Derived Parameters Regional analysis of the myocardium is attained by computing the spatiotemporal derived parameters (mean displacement, velocity, and strain) from the estimated motion field for every segment. The B-spline representation of the transformation allows the computing of spatial derivatives analytically.
Transformation Model The transformation between the test and reference frame pairs was defined as a linear combination of Bspline basis functions, located in a rectangular grid (31–33) gⴕ t 共x兲 ⫽
冘
cjr 共x/h ⫺ j兲
[6]
The spacing between grid points h (knot-spacing) determines the number of parameters cj to be optimized and the final rigidity of the solution. The compact support of the B-splines actually determines the local influence of the parameters. The use of B-splines also provides other advantages such as computational simplicity, good approximation properties, and implicit smoothness. In all our experiments we used cubic B-splines. In a general approach, the degree could be set as a parameter; however, Laplacian regularization requires the use of cubic B-splines. When this requirement is not present, similar accuracies in results could be obtained with quadratic B-splines with less computation time. Interpolation In order to calculate the warped images (fwa , fwb), a continuous version of the input images is efficiently computed from a 2D spline interpolation using filtering (36). This representation also allows the analytical calculus of the image derivatives needed in the optimization and regularization processes and provides an excellent framework to achieve subpixel solution. Multiresolution and Optimization Strategy A gradient descent optimization approach is used to find the solution g⬘ ⫽ arg min g⬘僆G E(g⬘) for each registration process. The directional information embedded in the tagged data allows for a more efficient optimization by decoupling the two directional components of the gradient. Therefore, the horizontal estimation of the motion is driven by the horizontally tagged images and similarly for the vertical component of the motion.
Image Data The proposed algorithm was tested on data from an experimental animal model and data from healthy volunteers. Both research protocols were approved by the Institutional Review Board of the National Heart, Lung, and Blood Institute. The animal data were acquired on five healthy dogs. A 3D fast gradient echo tagging sequence was used to acquired the tagged MR short-axis cardiac images using a General Electric (Milwaukee, WI, USA) 1.5 T CV/i scanner. Imaging parameters were as follows: field of view (FOV) ⫽ 180 ⫻ 180 ⫻ 128 –160 mm, acquisition matrix ⫽ 384 ⫻ 128 ⫻ 32, 12° flip angle, TE/TR ⫽ 3.4/8.0 ms, 4 –5-mm slice thickness, tagging separation 2.8 mm. Long-axis stripe tag images were acquired using a 2D fast gradient echo pulse sequence using the following imaging parameters: FOV ⫽ 200 ⫻ 200 ⫻ 8 mm, acquisition matrix ⫽ 256 ⫻ 128, 12° flip angle, TE/TR ⫽ 3.2/8.0 ms, 4 –5-mm slice thickness, tagging separation 6 mm, and 1 TR-persegment for 8-ms temporal resolution. Respiratory and cardiac gating were applied in order to have a more controlled experiment and reduce blurring (38). The complete cardiac cycle was acquired with a temporal resolution of 8 ms. However, only the first 40 time frames were actually used for analysis in this paper because the tag contrast-tonoise ratio in subsequent frames was too low for reliable manual segmentation. Three different short-axis locations were chosen for each subject, covering basal, mid, and apical sections of the left ventricle. Long-axis two- and four-chamber views were also used for the analysis. Human data were obtained from five normal healthy volunteers aged 30 –50 years and heart rates within the range of 45– 80 bpm with no prior history of cardiac disease or chest pain. The data were acquired on a 1.5 T Siemens Espree scanner (Siemens Medical Solutions, Erlangen, Germany) equipped with gradient coils capable of imaging at 33 mT/m and with maximum slew rates of 100 T/m/s. A gated, sequential, multiphase 2D balanced steady-state free precession (SSFP) imaging sequence with a 1-1 SPAMM tagging preparation was employed.
Automated Cardiac Motion Assessment
For balanced SSFP, a 3-TR linear ramp starting sequence was employed prior to data acquisition. During the imaging acquisitions, a ramped train of imaging flip angles, based on the prescription given in ref. 39, was used to distribute the tagging-prepared magnetization equally across all cardiac phases and was optimized for maximum tagging contrast according to the acquisition window and R-R durations. Typically, during each cardiac cycle, the flip angle increased monotonically from 25° at the beginning of the R-R to 50° at the end of the acquisition window. After acquisition, the flip angle was ramped back to zero for the remainder of the R-R. Typical imaging parameters used were: tag separation ⫽ 6 mm, imaging FOV ⫽ 300 ⫻ 300 mm, acquisition matrix ⫽ 256 ⫻ 130, TE/TR ⫽ 2.5/5.0 ms, slice thickness ⫽ 5 mm, tag separation ⫽ 6 mm and five TRs-per-segment for a temporal resolution of 25 ms. The first 20 –30 frames were selected, which provided enough tag contrast-tonoise ratio for reliable manual segmentation. Measurements To assess the accuracy of the proposed approach, horizontal and vertical tags were tracked by an expert using FindTags (12,13) to serve as a gold standard. A total number of 25 sequences (40 frames) from the animal data and 20 sequences from the volunteer data were analyzed (20 –30 frames). The estimated trajectories of the tags using our technique were calculated by applying the tracking deformation function to the points selected on the tag lines in the first frame. Two different sets of accuracy measurements were performed. First, the estimated trajectories of the horizontal and vertical tags were compared point to point to the manual tracking for 20 – 40 time frames, computing the total RMS error in mm. The accuracy of the horizontal and vertical motions were assessed independently. In a second measurement, the effect of tracking accuracy on strain measurements was estimated by measuring adjacent tag line distances. Manually traced adjacent tag distances were compared point to point with the estimated tag distances for both the horizontal and vertical tagged data, computing the RMS value of the measured tag separation (RMS_TS) in mm. All the measurements were calculated for all the tags present in the myocardium and over all the analyzed frames. The mean number of tags for animal data was 17 in the short-axis images, corresponding to aproximately 22,000 point-to-point comparisons along the sequence, and 8 tags in the long axis, corresponding to aproximately 5000 point-to-point comparisons. For the volunteer data, a mean value of 9 tags per frame was analyzed in the shortaxis images (3000 point-to-point comparisons) and 11 tags per frame in the long-axis images (3500 point-to-point comparisons). The temporal dependency of the RMS measurement was also studied for all sequences in the animal data set, representing the time evolution of the RMS along the cardiac cycle. Moreover, in order to explore the effect of time resolution and the ability of the proposed algorithm to recover larger displacements between frames, new sequences were generated and analyzed by downsampling
185
the number of frames by two and four, respectively (three slices). The RMS analysis was also performed with respect to the manually traced points. Short-axis sequences (N ⫽ 30) were analyzed using the proposed multisource nonrigid registration scheme. Longaxis sequences (N ⫽ 15) were studied as monosource data as they were only horizontally tagged to assess longitudinal motion. Cubic B-splines were used to represent the transformation and the subsequent image interpolation of the images. The multiresolution processing scheme was set at four levels in successive steps, having half the size in each dimension (37). Regularization was employed in all cases, using a value of ␣ equal to 1.0 (Eq. [3]), as this value was found to make the solution more stable. Optimal knot spacing was investigated by performing a set of initial tests on three different sequences from the animal data set. The knot spacing values tested were: 2.8 mm (equal to the tag spacing), 5 mm, and 10 mm. The RMS measurement with respect to the manual tracings was computed to decide the best option. The variability of the expert manual tracing was also checked by performing six independent tracings in one slice from the experimental data set. These data were analyzed following the same measurement procedure applied for the automatically traced points (RMS point-topoint comparisons). RESULTS The measurements performed to adjust the knot spacing parameter showed comparable results for the three spacing values investigated. Figure 3 shows the RMS measurement with respect to the manual tracings for the three different slices (basal, mid, and apical) and spacings (10, 5, and 2.8 mm). Horizontal (H) and vertical (V) errors were obtained independently. Best performance was ensured for 5- and 2.8-mm spacings, although 2.8 mm showed higher
FIG. 3. Comparison of RMS error measurements for different values of the knot spacing parameter h (1, 0.5, and 0.28 cm). Three different sequences of the same subject (basal mid and apical short axis) were analyzed with the proposed multisource nonrigid registration approach. Horizontal (H) and vertical (V) tracking errors were assessed independently. In general, the best performance results were for finer grids (0.5 and 0.28 cm).
186
FIG. 4. Artificial tags (red) automatically tracked using the proposed algorithm for a mid-LV slice of one of the animal subjects (top) and a basal slice of one of the volunteers (bottom). The same deformation field is actually applied in both the horizontal and vertical tagged images to obtain the artificial tags.
computation times (higher number of parameters cj to be optimized). Given these results, h ⫽ 5 mm was used for all the remaining experiments as it was a good compromise in terms of computation time and accuracy.
M.J. Ledesma-Carbayo et al.
Artificial tags were generated to visualize the recovered motion field by applying the reconstructed motion to an evenly spaced pattern located at the first frame of the sequence (end-diastole). Figure 4 shows the horizontal and vertical artificial tags at end systole for a mid-LV slice in one of the animal subjects (top) and a basal slice from one of the volunteer subjects (bottom). The current version of the algorithm coded in Python needed about 2 or 3 min to recover the motion field from a typical sequence (30 frames, 200 ⫻ 200 pixels) using a standard PC (3 GHz Pentium D, 1GB DDR2). We expect a five- to tenfold reduction in computation time when the algorithm is completely recoded in C. Tag location error measurements (RMS) in the experimental data resulted in a mean error of 0.52 ⫾ 0.16 pixels (0.25 ⫾ 0.07 mm; mean ⫾ SD) in the short-axis sequences and 0.51 ⫾ 0.15 pixels (0.45 ⫾ 0.14 mm) in the long-axis sequences. Similar results were obtained with the volunteer data, for which an RMS error of 0.46 ⫾ 0.11 pixels (0.50 ⫾ 0.12 mm) was obtained for the short-axis images and correspondingly 0.56 ⫾ 0.15 pixels (0.54 ⫾ 0.15 mm) in the long-axis sequences. Figure 5 shows RMS plots (Fig. 5a) for all the short-axis sequences analyzed (top: experimental; bottom: volunteer data) and both the horizontal and vertical tagged images with the expert manual tracings and the resultant artificial tags (Fig. 5b) at end-systole. RMS was calculated over all the tags present in the myocardium and along the frames analyzed within the sequence. The mean number of tags in the short-axis images was 17 in the experimental data, (⬃22,000 point-to-point comparisons along the sequence) and 9 in the volunteer data (⬃3000 point-to-point comparisons).
FIG. 5. a: RMS error from all the short-axis images analyzed in pixels (top: animal data; bottom: volunteer data). Light gray, horizontal error; dark gray, vertical error. Sequences grouped by subject and ordered by slices (B, basal, M, mid; A, apical). b: Manually traced points (green) are displayed together with tracked points (red) at end of systole, showing the small error measured.
Automated Cardiac Motion Assessment
187
FIG. 6. a: RMS error from all the long-axis images analyzed in pixels (top: animal data; bottom: volunteer data). Sequences grouped by subject. b: Manually traced points (green) are displayed together with tracked points (red) at end of systole, showing the small error measured.
Likewise, Fig. 6 shows the same information and figures for the long-axis data. No major differences are observed among subjects in the results displayed. The mean number of tags in the long-axis images was 8 in the experimental data, (5000 point-to-point comparisons along the sequence) and 12 in the volunteer data (3500 point-to-point comparisons). Adjacent tag separation error measurements (RMS_TS) in the experimental data resulted in a mean error of 0.40 ⫾ 0.06 pixels (0.19 ⫾ 0.03 mm) in the short-axis sequences and 0.48 ⫾ 0.21 pixels (0.42 ⫾ 0.19 mm) in the long-axis sequences. The results in the volunteer data were an RMS_TS error of 0.51 ⫾ 0.10 pixels (0.56 ⫾ 0.10 mm) in the short-axis images and 0.30 ⫾ 0.33 pixels (0.29 ⫾ 0.32 mm) in the long-axis sequences. Figure 7a shows the RMS_TS bar plot for all the animal sequences, and Fig. 7b shows the results for the volunteer data (top: short axis; bottom: long axis). These results confirm that the error in the strain could be equivalent or even smaller than the displacement error, since the tag mislocation is actually correlated in space due to the smoothness of the motion model used. Variability of manual tracing resulted in a mean RMS value of 0.26 ⫾ 0.06 pixels. In comparison with the automatic results, we can conclude that the accuracy achieved is not far from the accuracy of an expert user using FindTags (12,13).
The time-dependency study resulted in a linear dependence of the RMS through time mainly caused by the decreased signal-to-noise in the tags due to T1 recovery during the sequence (Fig. 8). For the entire sequence the RMS is maintained under one pixel. The temporal resolution study showed similar RMS results for both the doubled and quadrupled time intervals in comparison with the full temporal resoultion. These results confirm that error acumulation does not seem to occur at higher time resolutions, when more consecutive frames contribute to the computation of the final field.On the other hand, the algorithm shows a good performance to account for very small motions (high temporal resolutions) and mid-motions (coarse temporal resolutions). DISCUSSION The proposed method for motion tracking has shown good results on both animal and normal volunteer data sets. These two data sets actually cover a good range of tag image features (higher and lower temporal and spatial resolutions, stripe vs. sinusoidal tag shape, gradient echo sequence vs. SSFP sequence). The proposed process was shown to handle both data sets very efficiently, providing subpixel accuracy over the whole sequence. Subpixel accuracy is achieved thanks to the good approximation prop-
188
M.J. Ledesma-Carbayo et al.
FIG. 7. Adjacent tag separation error (RMS_TS) plots are represented for both the experimental data (a) and the volunteeer data (b). Tag separation measurements are equivalent or smaller than tag mislocation RMS for most data sets,showing that the strain calculation accuracy should be as good as the displacement accuracy.
erties of the B-spline transformation model and the robustness of the optimization process that incorporates an optimal multiresolution scheme and an analytical representation of the gradient. B-spline parametric models have previously been demonstrated to be suitable for motion modeling by Declerck et al. (2). In comparison with previous literature based on nonrigid registration techniques using information theory metrics (22,40) we have reported a better accuracy with respect to the manual delineation. One of the main points of the methodology presented is the fact that no user interaction is required throughout the whole process. The method performs both tag fitting and field fitting in one step. No masking or segmentation is applied thanks to the smoothness of the transformation model and the regularization introduced. Only in a few cases has some slight tethering coming from the adjacent static tissues been noticed. In these cases a mask defined in the first image of the sequence can be incorporated in the process to mask out the regions that produce the tethering. In comparison with other tag postprocessing techniques, such as HARP, the current approach produces a motion estimate making use of all the available information in the image. The multiple source approach together with the 2D transformation model allows for the computing of a coherent estimate of the 2D motion in just one process. In the advent of longer lasting tags (for example from 3 T imaging) periodicity motion field constraints could be added to improve the accuracy if full cycle imaging is achieved (32,35).
FIG. 8. Temporal dependency of RMS for all the animal (top) and volunteer (bottom) short-axis data sequences. RMS is maintained under one pixel through the analyzed frames of the sequences, therefore providing subpixel accuracy.
Automated Cardiac Motion Assessment
CONCLUSIONS This study suggests that fully automatic tagged MR image processing is feasible using multiple source nonrigid registration techniques. The method has been tested on highresolution experimental data (animal model) and on normal volunteer data. Subpixel accuracy is achieved in both data sets thanks to the B-spline image representation. Furthermore, the analytical representation of the deformation is an optimal framework to obtain spatiotemporally derived parameters analytically (such as strain) from the computed displacement field. ACKNOWLEDGMENTS The authors thank Yohannes Afework for his experienced use of Findtags for tag segmentation. The canine data in this study were obtained by Dan Ennis for his Ph.D. dissertation. REFERENCES 1. Moore CC, Reeder SB, McVeigh ER. Tagged MR imaging in a deforming phantom: photographic validation. Radiology 1994;190:765–769. 2. Declerck J, Denney TS, Ozturk C, O’Dell W, McVeigh ER. Left ventricular motion reconstruction from planar tagged MR images: a comparison. Phys Med Biol 2000;45:1611–1632. 3. Kuijpers D, Ho KY, van Dijkman PR, Vliegenthart R, Oudkerk M. Dobutamine cardiovascular magnetic resonance for the detection of myocardial ischemia with the use of myocardial tagging. Circulation 2003;107:1592–1597. 4. Zerhouni EA, Parish DM, Rogers WJ, Yang A, Shapiro EP. Human heart: tagging with MR imaging—a method for noninvasive assessment of myocardial motion. Radiology 1988;169:59 – 63. 5. Axel L, Dougherty L. MR imaging of motion with spatial modulation of magnetization. Radiology 1989;171:841– 845. 6. Young AA, Imai H, Chang CN, Axel L. Two-dimensional left ventricular deformation during systole using magnetic resonance imaging with spatial modulation of magnetization. Circulation 1994;89:740 –752. 7. Aletras AH, Ding S, Balaban RS, Wen H. DENSE: Displacement encoding with stimulated echoes in cardiac functional MRI. J Magn Reson 1999;137:247–252. 8. Osman NF, Kerwin WS, McVeigh ER, Prince JL. Cardiac motion tracking using CINE harmonic phase (HARP) magnetic resonance imaging. Magn Reson Med 1999;42:1048 –1060. 9. Wedeen VJ. Magnetic resonance imaging of myocardial kinematics, technique to detect, localize, and quantify the strain rates of the active human myocardium. Magn Reson Med 1992;27:52– 67. 10. McVeigh E. MRI of myocardial function: Motion tracking techniques. Magn Reson Med 1996;14:137–150. 11. Ozturk C, Derbyshire JA, McVeigh ER. Estimating motion from MRI data. Proc IEEE 2003;91:1627–1648. 12. Guttman MA, Prince JL, McVeigh ER. Tag and contour detection in tagged MR images of the left ventricle. IEEE Trans Med Imaging 1994; 13:74 – 88. 13. Guttman MA, Zerhouni EA, McVeigh ER. Analysis of cardiac function from MR images. IEEE Comput Graphics Applic 1997;17:30 –38. 14. Ozturk C, McVeigh ER. Four-dimensional B-spline based motion analysis of tagged MR images: introduction and in vivo validation. Phys Med Biol 2000;45:1683–1702. 15. Radeva P, Amini AA, Huang J. Deformable B-solids and implicit snakes for 3D localization and tracking of SPAMM MRI data. Comput Vis Image Understand 1997;66:163–178. 16. Amini AA, Prince JL. Measurement of cardiac deformations from MRI: physical and mathematical models. Dordrecht, The Netherlands: Kluwer Academic Publishers; 2001.
189 17. Clarysse P, Basset C, Khouas L, Croisille P, Friboulet D, Odet C, Magnin IE. Two-dimensional spatial and temporal displacement and deformation field fitting from cardiac magnetic resonance tagging. Med Image Anal 2000;4:253–268. 18. Park J, Metaxas DN, Axel L. Analysis of left ventricular wall motion based on volumetric deformable models and MRI-SPAMM. Med Image Anal 1998;1:53–71. 19. Young AA, Axel L. Three dimensional motion and deformation of the heart wall: Estimation with spatial modulation of magnetization—a model based approach. Radiology 1992;185:241–247. 20. Papademetris XL. Estimation of 3D left ventricular deformation from medical images using biomechanical models. New Haven, CT: Yale University Press; 2000. 21. Shi P, Sinusas AJ, Constable RT, Duncan JS. Volumetric deformation analysis using mechanics-based data fusion: applications in cardiac motion recovery. Int J Comput Vision 1999;35:87–107. 22. Chandrashekara R, Mohiaddin RH, Rueckert D. Analysis of 3-D myocardial motion in tagged MR images using nonrigid image registration. IEEE Trans Med Imaging 2004;23:1245–1250. 23. Prince JL, Mcveigh ER. Motion estimation from tagged MR image sequences. IEEE Trans Med Imaging 1992;11:238 –249. 24. Amini AA, Chen Y, Curwen RW, Mani V, Sun J. Coupled B-snake grids and constrained thin-plate splines for analysis of 2D tissue deformations from tagged MRI. IEEE Trans Med Imaging 1998;17:244 –356. 25. Huang J, Abendschein D, Davila-Roman VG, Amini AA. Spatio-temporal tracking of myocardial deformations with a 4-D B-spline model from tagged MRI. IEEE Trans Med Imaging 1999;18:957–972. 26. Declerck J, Feldmar J, Ayache N. Definition of a 4D continuous planispheric transformation for the tracking and the analysis of left-ventricle motion. Med Image Anal 1998;2:197–213. 27. Kuijer JP, Jansen E, Marcus JT, van Rossum AC, Heethaar RM. Improved harmonic phase myocardial strain maps. Magn Reson Med 2001;46:993–999. 28. Epstein FH, Gilson WD. Displacement-encoded cardiac MRI using cosine and sine modulation to eliminate (CANSEL) artifact-generating echoes. Magn Reson Med 2004;52:774 –781. 29. Aletras AH, Freidlin RZ, Navon G, Arai AE. AIR-SPAMM: alternative inversion recovery spatial modulation of magnetization for myocardial tagging. J Magn Reson 2004;166:236 –245. 30. Pluim JP, Maintz JB, Viergever MA. Mutual-information-based registration of medical images: a survey. IEEE Trans Med Imaging 2003;22: 986 –1004. 31. Sorzano CO, Thevenaz P, Unser M. Elastic registration of biological images using vector-spline regularization. IEEE Trans Biomed Eng 2005;52:652– 663. 32. Ledesma-Carbayo MJ, Kybic J, Desco M, Santos A, Suhling M, Hunziker P, Unser M. Spatio-temporal nonrigid registration for ultrasound cardiac motion estimation. IEEE Trans Med Imaging 2005;24:1113–1126. 33. Kybic J, Unser M. Fast parametric elastic image registration. IEEE Trans Image Proc 2003;12:1427–1442. 34. McVeigh ER, Atalar E. Cardiac tagging with breath-hold cine MRI. Magn Reson Med 1992;28:318 –327. 35. Ledesma-Carbayo MJ, Mahia-Casado P, Santos A, Perez-David E, Garcia-Fernandez MA, Desco M. Cardiac motion analysis from ultrasound sequences using nonrigid registration: validation against Doppler tissue velocity. Ultrasound Med Biol 2006;32:483– 490. 36. Unser M, Aldroubi A, Eden M. Fast B-spline transforms for continuous image representation and interpolation. IEEE Trans Pattern Anal Machine Intelligence 1991;13:277–285. 37. Unser M, Aldroubi A, Eden M. The L(2) polynomial spline pyramid. IEEE Trans Pattern Anal Machine Intelligence 1993;15:364 –379. 38. Ennis DB. Assessment of myocardial structure and function using magnetic resonance imaging. PhD Thesis, John Hopkins University, Baltimore, MD; 2004. 39. Ibrahim E-SH, Stuber M, Scha¨r M, Osman NF. Improved myocardial tagging contrast in cine balanced SSFP images. J Magn Reson Imaging 2006;24:1159 – 67. 40. Oubel E, Frangi AF, Hero AO. Complex wavelets for registration of tagged MRI sequences. In: 3rd IEEE International Symposium on Biomedical Imaging: Macro to Nano, Arlington, VA, USA; 2006. p 622– 625.