AbstractâIn this paper we describe a novel algorithm for constructing a compact representation of 3D laser range data. Our approach extracts an alphabet of ...
Unsupervised Learning of Compact 3D Models Based on the Detection of Recurrent Structures Michael Ruhnke
Bastian Steder
Giorgio Grisetti
Wolfram Burgard
Abstract— In this paper we describe a novel algorithm for constructing a compact representation of 3D laser range data. Our approach extracts an alphabet of local scans from the scene. The words of this alphabet are used to replace recurrent local 3D structures, which leads to a substantial compression of the entire point cloud. We optimize our model in terms of complexity and accuracy by minimizing the Bayesian information criterion (BIC). Experimental evaluations on large realworld data show that our method allows robots to accurately reconstruct environments with as few as 70 words.
I. I NTRODUCTION Representing and analyzing 3D data is an essential precondition for many robotic applications including navigation, object recognition, or manipulation. To this end several authors propose unstructured euclidean representations like point-clouds, grid maps, or surface maps. Whereas these methods provide accurate representations of the environment, their huge memory requirements typically prevent their application to large-scale environments. In this paper, we present an approach for compressing 3D data by determining repetitive patterns and using these patterns for representing the environment. The key idea of our approach is to extract an alphabet of common 3D patterns from dense 3D point clouds and to use this alphabet to compactly represent the entire scene. A further advantage of our approach is that it also supports to efficiently carry out other tasks including place recognition and object recognition. The idea to compress data by replacing multiple occurrences of the same data block by one word of an alphabet is at the root of classical compression approaches like, e.g., LZW [6]. These algorithms, however work on symbolic data. They furthermore focus on the loss-less reconstruction of the input without relying on additional knowledge about the data. In our context, the computationally intensive part is the recognition and the matching of recurrent patterns within noisy point clouds. We will address this problem with efficient data representations that encode the surface properties of the 3D scene and allow to quickly retrieve the occurrences of the pattern in the data. Our method constructs increasingly accurate models and optimizes them by minimizing the Bayesian information criterion (BIC) to trade-off the complexity of the model with its accuracy. We evaluate our approach on large real-world data sets. One advantage of our formulation is that only few parameters need to be defined. The experiments reveal that All authors are with the Autonomous Systems Lab, Department of Computer Science, University of Freiburg, D-79110 Freiburg, Germany {ruhnke,steder,grisetti,burgard}@informatik.uni-freiburg.de
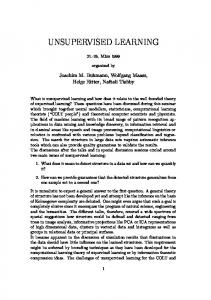
Fig. 1. This figure shows a point cloud reconstruction obtained with our approach. This scene reconstruction was built from an alphabet of size 114 (light blue). Points of the original scene that are not covered by the alphabet are black. In the bottom right we show two different views of one of the alphabet words chosen by our method.
our approach can compute accurate models with as few as 70 words, due to the recurrence of the local structures. Note that the number of words is automatically chosen by our algorithm and depends on the structural complexity of the environment. Figure 1 shows an example of a 3D scene reconstructed with our approach. In the next section we will provide a detailed discussion of related work. Then we will explain our map representation, followed by the alphabet selection procedure based on the BIC. Then we describe the words of our alphabets and the features we use to find repetitive structures. After presenting a final reduction step regarding the instances in the model, we will present experiments using different 3D data sets. II. R ELATED W ORK Accurate representations of 3D scenes and models are required by a wide range of applications. Recent developments on Simultaneous Localization and Mapping (SLAM) made it possible to obtain large metric models, however these models can be so large to not fit in memory. Most of the representations of the 3D data aim at being used within these SLAM algorithms. In these contexts, it is usually more important to focus on a reliable subset of the features in the environment rather than attempting to represent the scene in its whole complexity. A straightforward way to describe 3D data is to directly represent the unordered set of 3D points in the scene. This representation is commonly referred to as point-cloud. Popular algorithms in SLAM [7] and computer vision [2] rely on these kinds of representations. The advantages of point clouds are that they capture the world at an arbitrary level of resolution and that one can easily apply spatial transformations to them. Their disadvantage is that they lack structural information and that they can be arbitrarily redundant, resulting in large memory overheads.
In computer-graphics oct-trees are a common approach to represent scarcely occupied volumetric regions. In the context of 3D laser-based SLAM, Fairfield et al. [4] proposed to use oct-trees to represent the range measurements. The advantage of oct-trees is that they compactly represent the 3D space. Their main shortcoming is the complexity of applying 3D transformations, which basically requires to re-build the entire oct-tree. Additionally the oct-trees describe the pure occupancy information, while disregarding the fact that the 3D data originates from a surface. To recover properties of the surface from an oct-tree representation one needs to use a high resolution tree that may result in enormous memory requirements. Surface maps are another popular representation for 3D data. They can be thought of as 2D grids, where every cell encodes the height of an object. While these structures are clearly attractive to represent information related to the traversability of a given environment, they are quite inadequate to represent surfaces whose normals are not aligned with the z axis of the world. Additionally, it is not possible to represent full 3D environments with multiple levels using normal surface maps. To overcome this limitation, Triebel et al. [10] proposed the multilevel surface (MLS) maps. A MLS map can be thought of as a stack of surface maps each one describing one of the folds of the environment, plus a series of “vertical” entries that capture the information poorly represented by various surfaces. MLS maps are effective to represent man-made environments. However, the bounded resolution of the cells in the surface grid may be a problem for applications requiring a high accuracy like object detection. Puente et al. [3] describe an approach for 3D mapping based on laser range data that relies on extracting planar patches from the observations. Extracting planes is rather efficient, however the approach is restricted to environments where everything is planar. Furthermore, the unavoidable noise that affects the measurements limits the effectiveness of this representation in real world scenarios. Limetkai et al. [5] show the importance of richer semantic descriptions by introducing the Relational Object Maps that are classical 2D grid maps augmented with the information of object locations. The objects are classified using features and are used as landmarks for tasks like localization or place recognition. In contrast to these approaches our method aims to represent complex 3D models by utilizing the redundant information that occurs in different similar locations of an environment. We store prototypes of recurrent structures in the form of partial point clouds as words in our alphabet. These prototypes are then used to replace the occurrences of the corresponding partial point clouds in the original scene. Since we only need to store the references to words in the alphabet and their positions in the scene, we obtain a substantial compression of the original point cloud. As a result, our approach produces highly accurate and compact representations that can be manipulated as effectively as point clouds. At the same time, this representation has the potential for making additional tasks like place recognition or object detection substantially more effective compared to
procedures that operate on the full point cloud. III. L EARNING C OMPACT 3D M ODELS Point clouds are a common representation for 3D scenes consisting of an unordered set of 3D points D = {di } sampled at the interface between the occupied and the unoccupied space. The number of points required to represent a scene is directly proportional to the area of the visible surface of the objects and to the desired resolution. Furthermore, the resolution has a strong impact onto the specific applications that operate on the point cloud. For instance, applications like object recognition require a resolution higher than the size of the largest distinctive detail of the different objects to be detected. In this context, representing large scenes with the appropriate resolution leads to high memory requirements. However, in most man-made environments the scenes exhibit locally repetitive patterns. For instance, flat surfaces, corners, doorways, or multiple instances of the same object in the scene result in similar point distributions at different positions in the cloud. In this paper, we utilize these repeating structures to represent the scene in a way that is both compact and accurate. More precisely, we construct an alphabet of repeating local structures, which constitute the words of our alphabet. We then represent the overall scene based on these words, where a single word can occur multiple times at different locations in the scene. Each word s of our alphabet A is a subset of the points of the original point-cloud D selected from the neighborhood of a given point p with a maximum distance of δ. s = {d | d ∈ D, ||d − p|| < δ}.
(1)
Given an alphabet A = {s1 , . . . , sn } we can reconstruct a 3D scene that approximates the original one by combining the words in the alphabet. This can be parametrized by a model M(A, D) = {m1 , · · · , m|M| } for a given alphabet and a given scene. A model is a set of tuples mj = hidj , Tj i where idj is the index of a word in the alphabet and Tj is a 3D transformation. An item mj of the model specifies that the word with index idj occurs in the scene at location Tj . Based on this notation we can define the reconstructed scene R as the union of a set of words in the alphabet, each one positioned according to its corresponding transformation Tj : |M|
R=
[
j=1
Tj · sidj .
(2)
Here, Tj · sidj denotes a set obtained by transforming all points in the word sidj according to Tj . There is one remaining issue regarding R that has to be addressed. The positions of the words in the reconstructed scene might have a high overlap, leading to multiple points describing the same part of the original scene. Therefore, we introduce a ˆ where every point has sparsification step on R leading to R, a minimum distance ε to every other point in the set: ˆ = {ri | ri ∈ R ∧ kri − rj k ≥ ε ∀rj ∈ R} ˆ R
(3)
On the one hand, the more words are in our alphabet, the more memory consuming our representation is. On the other hand, having too few words reduces the accuracy of the representation. This trade off is naturally captured by the Bayesian information criterion (BIC). Our approach proceeds by iteratively enlarging the alphabet. During each iteration we sample a new word from the scene and use it to enlarge the alphabet. If this word improves the BIC score we accept it, otherwise we reject the word and pick another one. The procedure is stopped after a maximum number of iterations, or when the insertion of new words does not improve the BIC score anymore. In the remainder of this section we first discuss the Bayesian information criterion and describe the likelihood function that we use to estimate the accuracy of a model. Subsequently, we discuss how we compute the words in the alphabet and how we reconstruct a scene based on a given alphabet. We conclude the section by describing a step of our approach that aims to reduce the overlap between nearby words and further improves the result. A. Bayesian Information Criterion Given the input scene D = {d1 , ..., dN } of size N and the ˆ [n] = {r0 , · · · , rM } of size M created reconstructed scene R [n] from the alphabet A in iteration n, the BIC is defined as: ˆ [n] ) = −2 · ln(L(D, R ˆ [n] )) + k [n] · ln(N ). BIC(D, R
(4)
ˆ [n] )) is the likelihood function that measures Here L(D, R how well the data D is represented by the reconstructed ˆ [n] , while k [n] is the number of parameters point cloud R (see below). Minimizing the BIC therefore results in finding a model which is maximally consistent with the input (small negative log-likelihood), while having a limited complexity (small k). In our problem, the count of parameters is defined as follows: |A[n] |
k
[n]
=3·
X i=1
|si |,
si ∈ A[n] ,
(5)
which is the sum of the point cloud sizes of every word in the alphabet times 3, since a point has dimension 3. B. Likelihood Function By assuming the points in the cloud to be independent, we define the log-likelihood as follows: ! N Y [n] [n] ˆ )) = ln ˆ ) ln(L(D, R P (di | R (6) i=1
=
N X i=1
ˆ [n] )) ln(P (di | R
(7)
Here di represents the ith point in D and the probability of di is modeled depending on the data associations adi ,rj ˆ [n] : between di and the j th point in R ˆ [n] ) = P (di | R
M X j=1
P (di | rj , adi ,rj ) · P (adi ,rj )
(8)
The need to model the data associations arises from D ˆ [n] having different resolutions in corresponding areas. and R Since we lack any knowledge about the data associations, we assume a uniform distribution of the prior P (adi ,rj ), leading to M 1 X [n] ˆ P (di | R ) = (9) P (di | rj , adi ,rj ). M j=1 The main influence of the data association is typically in the close proximity around the target data point di . Therefore we only consider data associations within a distance ˆ [n],di = of 3σ (see below for a definition of σ). Let R [n] [n] ′ ′ ˆ ˆ {r1 , · · · , rM ′ } ⊆ R be the points in R that are in this range of di : ˆ [n] ˆ [n],di = {rj ∈ R R
|
kdi − rj k ≤ 3σ},
(10)
Using this set we can approximate (9) as ′
M 1 X P (di | R ) ≈ P (di | rj′ , adi ,rj′ ). M j=1
ˆ [n]
(11)
Given an association adi ,rj the probability for a data point pair is modeled as a spherical Gaussian P (di | rj , adi ,rj ) = √
1 1 exp(− 2 kdi − rj k2 ). 2σ 2πσ
(12)
We model the deviation σ range dependent for each point di proportional to the resolution of the original laser scan at the range of di . Given an angular resolution of α we compute σdi in the following way: �α� · range(di ) (13) σdi = λ · tan 2 A uniform chosen σ would overestimate the importance of the low resolution parts in the input data. Consider a typical 3D range scan taken in a planar world where every patch can be described by a planar point cloud. In this context, the only difference between the planar point clouds is their resolution. By using our formulation of the likelihood function, the best BIC rated word is the one having the “average” resolution. Reconstructing the scene with this best candidate reduces the accuracy in high resolution areas, while it improves low resolution parts. C. Alphabet Symbols and Model Creation So far we described, how to evaluate the BIC of a model. In this section we describe the data structure of the words in our alphabet and how to obtain a model M(A, D) given an alphabet A and a scene D. To be able to find similar structures in the 3D data, we extract local point features, that provide descriptors for easy comparison. Every word in our alphabet stores a feature descriptor and a representative point cloud of the part in the scene from where the descriptor was extracted. The decision where to extract the features is a two step process. First we extract interest points on the range image using an adaption of the Laplacian of Gaussian (LoG) method known from the vision community (see our previous
Fig. 2. This figure visualizes the points in an example scene, where we extracted features. In the bottom right corner is the range image corresponding to the point cloud.
work [8] for more details). These points are supposed to cover complex structures in the scene, like corners or other non-distinctive regions. It is important to use a method that ideally always extracts the points on the same place on a surface, to facilitate the feature matching. After the interest point extraction we distribute feature points on the scan in a uniform fashion, so that every point in the scan has a fixed maximum distance to such a point. These points are supposed to cover uniform structures like planes, where the exact placement of the point is of less importance. See Figure 2 for an example. The maximum distance between these points is connected to the size in the world that is covered by a feature, since a big enough overlap has to be guaranteed. The next step of the feature extraction is the determination of a descriptor vector, that enables us to evaluate the similarity between different parts of the scene efficiently. We calculate the descriptor vector of a features at a certain position in the scan according to the procedure described in our previous work [9]. The general idea is, to extract a local interpolated range image patch from a view point lying along the normal of an interest point. This constrains 5 of the 6 degrees of freedom of the relative transformation between the two range images. We resolve the remaining degree of freedom (the rotation around this normal) by orienting the patch along the z-axis in the world, i.e., the simulated viewers orientation is along the normal and upright in the world. Using these conditions, each feature encodes a complete 6DOF transformation describing its pose in a scan. The feature descriptor covers a fixed 3D distance around the point it was extracted from. To match two of these features against each other, we treat the range image patches as 1D vectors and calculate the Euclidean distance between them. A low distance implies a high similarity between the surfaces the features describe. See Figure 3 for an example. To construct a model M given an alphabet A, we need to determine the assignments mi = hidi , Ti i between parts of the original scene and our alphabet words (see Sec. III). We do this by finding the alphabet word that has the lowest descriptor distance for every position in the scene where we extracted a feature. The transformation Ti can directly be extracted using the transformations associated with the features as Ti = Ta−1 · Ts , where Ta is the transformation
Fig. 3. This figure visualizes the descriptor distances for a corner feature (top) and a planar feature (bottom). On the left is the original point cloud with a quadratic patch marking the position and size of the extracted feature, on the right the descriptor distances to every point in the scene are visualized. Dark points meaning a low descriptor distance and bright points meaning a high descriptor distance. One can see, that the corner of the chair in the top row has only a few similar places in the scene, whereas the flat feature from the floor in the bottom example is similar to the majority of the scene.
associated with the feature from the alphabet and Ts is the transformation associated with the feature from the scene. D. Reducing the Instances of Symbols in the Model Since words can have an arbitrary overlap we can reduce the number of instances of words in the model, while preserving the likelihood value. Note that this procedure does not affect the alphabet A, but the number of instances of words used to reconstruct the scene |M|. To this end we attempt to remove the redundant instances of words in the model sequentially. We analyze one word s at a time, and we consider all occurrences of that word in the model. The order at which we process the words is given by the number of occurrences of each word in the model. For each occurrence of the word s in the model we measure the change in the likelihood when removing it from the scene. If this value does not decrease, the occurrence is redundant and we remove it from the model. IV. E XPERIMENTS In this section we present experiments to evaluate the performances of our approach. We apply our approach to data obtained in different environments and we measure the following quantities: • the number of words in the alphabet |A|. • the number of word occurrences in the model |M|. • the compression rate, i.e., the ratio between the memory consumption of the model generated by our approach and the memory consumption of the original data. We use a standard binary representation of the data, meaning every floating point value takes 4 bytes of memory. Each 3D point thereby takes 12 bytes, each 6DOF transformation takes 24 bytes, and a reference to a word in the alphabet takes 4 bytes. • the number of inliers, i.e., the data points that are correctly matched by the model.
the number of outliers which are the points in the reconstructed model that are not contained in the original scene.
The number of inliers and outliers is calculated based on nearest neighbor queries using a kd-tree. A point is considered to have a correct correspondence if a neighbor is in the distance of σdi . Note that in our experiments the fraction of outliers was never approaching zero even in situations where the reconstructed scene exhibited a high accuracy. The reason for this lies in the predictive behavior of the words, that can be partially matched with the scene and complete parts of the environment that are not fully observable. The first experiment deals with the reconstruction of an indoor scene. Then we investigate how an alphabet learned on one scene can be applied to reconstruct a second scene. Finally, we present results obtained with large in- and outdoor data sets. A. Scene Compression In this experiment we want to measure the accuracy of a model obtained in an indoor scene. The input data correspond to a scene in which a person is standing in a corridor and in front of the robot (see Figure 4a. After 500 iterations our method converged to a model containing 70 words. Figure 4b shows the evolution of the BIC. For illustration purposes, Figures 4c and 4d show two different models reconstructed with 10 and 70 words respectively. We chose a value of δ = 10 cm in this experiment, meaning our alphabet words covered spheres with a diameter of 20 cm. The resulting size of the model is 227,392 bytes which, given an initial point cloud of size 640,896 bytes, corresponds to a compression rate of about 35%. The reconstructed point cloud of the final alphabet with size 70 covers 95% of the input point cloud and yields 7% outliers according to the previously declared point cloud evaluation method. See Table I for more details. The resolution of the reconstruction shows a more uniform point resolution than the original point cloud in Figure 4a. This is caused by the fact that a word encodes a surface prototype and every instance of a word in the scene uses this prototype for reconstruction. This introduces higher resolutions at more distant surfaces in this example. B. Scene Rebuilding In a second experiment we evaluated how well an alphabet learned on a given scene can be applied to describe different scenes. To this end we used the alphabet acquired during the previous experiment described in Section IV-A, and we reconstructed a new scene acquired in the same building. To reconstruct the scene we generated a model M by using the known alphabet and the method explained at the end of Section III-C. Based on this model we then reconstructed the input scene and compared it to the original input. Figure 5 shows the original and the reconstructed input. The left picture shows the same person as in the first scene in another location. The resulting model has 5263 instances and the reconstruction has 89% inliers and 15% outliers.
score 10
-7
•
53 52 51 50 49 48 47 46 45 44 43
BIC
10
20
30 40 50 alphabet size
(a)
(b)
(c)
(d)
60
70
Fig. 4. This figure shows (a) the original point cloud, (b) the evolution of the BIC during the learning process, (c) point cloud reconstructed based on an alphabet of size 10 and (d) based on the final alphabet with size 70. The planar corridor is already well explained with an alphabet of size 10. However, the regions enclosed in the black boxes in (c) and (d) indicate the improved accuracy obtained with an increasing number of words.
Fig. 5. Point cloud of the second scene (left) and the reconstructed point cloud using only words from the alphabet extracted from the first scene (right). As can be seen, our approach yields highly accurate reconstructions even in such situations.
C. Performance on Larger Data Sets The advantages of our representation are particularly evident on large data sets, where the size of the alphabet is bounded by the repetitiveness of the environment. To demonstrate this, we recorded an indoor data set in the main corridor of building 79 on our campus. The data set consists of 31 three dimensional range scans. Figure 6 shows the reconstructed point cloud and a plot of the occurrence frequencies for all words. Whereas the points that originate from the most frequent word are colored in yellow, the points of the remaining words are colored in blue. The yellow points cover most of the scene but the occurrence count for the most frequent word is not proportional to the observed coverage. This is caused by the fact that words can describe the surface with a different amount of points and that words can overlap. Redundant information of overlapping words is not included in the point cloud reconstruction. As second data set we chose a portion of a publicly available 360◦ outdoor data set [1] that was acquired on our campus. In the outdoor setting we chose a word radius δ of 0.25 m. The coverage is lower than in the indoor setting,
4500
Symbol instances in map
#instances in scene
4000 3500 3000 2500 2000 1500 1000 500 0 0
20
40
60 symbols
80
100
120
Fig. 6. Map generated from the corridor data set. Whereas the dominant planar word in the alphabet is colored in yellow the remaining words are colored in blue. The instance occurrences per word are shown in the right picture. The occurrence frequency does not directly reflect the percentage of the covered area since the count of points for a word can be different and words may overlap. TABLE I E XPERIMENTAL STATISTICS Data set Single scene IV-A Corridor building 79 360◦ outdoor
alphabet size 70 114 410
word radius δ 0.1 m 0.1 m 0.25 m
word occurrences 6337 123930 115995
compression rate 35.5% 15.5% 20.6
comp. rate (gzip) 33.3% 19.8 % 20.2%
inliers 95.2% 98.1% 87.2%
outliers 7.3% 10.4% 8.2%
runtime 7 min 66 min 12.5 h
approach is to learn a set of repetitive patterns in 3D range data and to use these patterns for approximating the entire point cloud. To choose the optimal number of words, we apply the Bayesian Information Criterion. Experimental results demonstrate that our approach is able to compute accurate models of complex, three-dimensional in- and outdoor scenes. In future work we plan to improve the procedure for sampling patterns by employing an informed search strategy. Additionally, words with a variable scale might improve the compression substantially. Apart from that, we plan to utilize the learned models for additional applications including object recognition, place labeling, and unsupervised learning of object classes. R EFERENCES
Fig. 7. Point cloud reconstructed from the 3D outdoor data set. The model covers the observed environment by 87%.
which can be explained by the fact that the outdoor data has more low resolution regions where no words can be extracted. The resulting statistics are shown in Table I. Note that the compression rate is computed using the sparsified original point clouds. Additionally, we give the compression rate for the case, that both, the original point cloud and our model were compressed using the standard file compression method gzip afterwards. The compression on the raw data is about 85% in both cases and leads only to a minor change of the compression rate. Our experiments suggest that typical real world scenes can accurately be described by a very small number of reoccurring words. While the run time for selecting an alphabet is not yet feasible for on-line applications, a previously learned alphabet might be sufficient for many applications. V. C ONCLUSIONS In this paper we presented an approach for learning compact models of 3D environments. The key idea of our
[1] Dataset of 360◦ 3D scans of the Faculty of Engineering, University of Freiburg, Germany. http://ais.informatik.uni-freiburg.de/projects/datasets/fr360. [2] Paul J. Besl and Neil D. McKay. A method for registration of 3-d shapes. IEEE Transactions on Pattern Analysis and Machine Intelligence, 14(2):239–256, February 1992. [3] P. de la Puente, D. Rodriguez-Losada, A. Valero, and F. Matia. 3D Feature Based Mapping Towards Mobile Robots Enhanced Performance in Rescue Missions. In Proc. IEEE International Conference on Intelligent Robots and Systems (IROS09), 2009. [4] Nathaniel Fairfield, George A. Kantor, and David Wettergreen. Realtime slam with octree evidence grids for exploration in underwater tunnels. Journal of Field Robotics, 2007. [5] B. Limketkai, L. Liao, and D. Fox. Relational object maps for mobile robots. In International Joint Conference on Artificial Intelligence, volume 19, page 1471. Citeseer, 2005. [6] M.R. Nelson. LZW data compression. Dr. Dobb’s Journal, 14(10):36, 1989. [7] A. N¨uchter, K. Lingemann, J. Hertzberg, and H. Surmann. 6d SLAM with approximate data association. In Proc. of the 12th Int. Conference on Advanced Robotics (ICAR), pages 242–249, 2005. [8] B. Steder, G. Grisetti, and W. Burgard. Robust place recognition for 3D range data based on point features. In Proc. of the IEEE Int. Conf. on Robotics & Automation (ICRA), 2010. TO APPEAR. [9] B. Steder, G. Grisetti, M. Van Loock, and W. Burgard. Robust online model-based object detection from range images. In Proc. of the Int. Conf. on Intelligent Robots and Systems (IROS), 2009. [10] R. Triebel, P. Pfaff, and W. Burgard. Multi-level surface maps for outdoor terrain mapping and loop closing. In Proc. of the Int. Conf. on Intelligent Robots and Systems (IROS), Beijing, China, 2006.