Unsupervised spectral pattern recognition by SOM for site effects estimation. Roberto Carniel. 1. , Luca Barbui. 1,2. 1. Laboratorio di misure e trattamento dei ...
Unsupervised spectral pattern recognition by SOM for site effects estimation 1
1,2
Roberto Carniel , Luca Barbui
1. Laboratorio di misure e trattamento dei segnali, DIEA, Università degli Studi di Udine, via delle Scienze, 208, 33100 Udine, Italy 2. Dipartimento di Georisorse e Territorio, DIGE, Università degli Studi di Udine, via del Cotonificio, 114, 33100 Udine, Italy
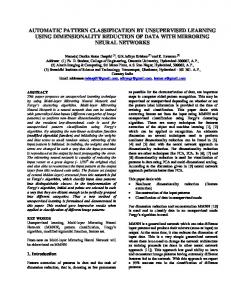
Introduction and objectives This work aims to present a few enhancements to our previous work [1] that introduced a post-processing application of a kind of artificial neural network called Self-Organizing Map [3] (SOM architecture in fig.1) to improve the HVSR technique. Applying the SOM procedure at several seismic tremor traces some problems and considerations have arisen about data pre-processing, SOM learning process and SOM results interpretation. The National University of Salta (Argentina) is carrying out a project of microzonation of the city of Salta. To demonstrate how the SOM algorithm works, the procedure has been applied to the short and highly noisy seismic tremor acquisitions of Salta city, with the objective of an easier and more reliable location of the H/V function’s peak.
clusterization. With regard to topological properties, flat maps have the disadvantage that neurons along their edges do not have the same number of neighbours as the others. This implies a nonhomogeneous training process. The solution is to remove the edges using a toroidal map. The last improvement concerns the field of results interpretation. Once the training process is complete and the data have been arranged onto the map, the analysis of clusters content starts. Each cluster is generally made up of more than one neuron, then the first step is to identify clusters. A cluster recognition algorithm has been used. This algorithm belongs to the family of the hierarchical clustering algorithms and uses the weighted cross-correlation to calculate the similarity value of the code vectors of each couple of neurons, obtaining a dendrogram such as the one in fig.6. At any threshold similarity value corresponds a number of clusters detected onto the map (fig.7).
Discussion In order to illustrate the procedure, we present the full analysis leading to the estimation of the resonance frequency from a single station recording in Salta. In fig.4 and 5 the graphs show the mean, the median and the standard deviation of the H/V function in EW and NS direction respectively. The proposed analysis procedure allows to investigate the spectrogram content. Fig.8, 10 and 11 show the mean and the median spectrum for each one of the three largest clusters in the map trained with the H/V in EW
SOM application to HVSR In order to estimate the amplitude spectrum (spectrograms in EW and NS direction in fig.2 and 3 respectively), the classic FFT algorithm has been replaced by the Welch’s method [6] implementation [2] that allowed to damp the noise effects, reaching also a good balance between time and frequency resolution (evolfft function, RSEIS package, [5]). Moreover Konno-Ohmachi smoothing function [4] has been implemented to avoid possible problems that arise when the H/V ratios of fundamental-mode Rayleigh waves become infinite. About the SOM learning process, the discriminant function is now based on a weighted cross-correlation index instead of the usual euclidean distance. This enhancement allows to consider the spectral shape instead of punctual H/V function values. Moreover, during the SOM training process, a proper choice of the frequency range allows to compare patterns in the range of interest, optimizing the map organization and obtaining a more meaningful data
References [1] R. Carniel, L. Barbui, P. Malisan. Improvement of HVSR technique by Self Organizing Map (SOM) analysis. SDEE, 29:1097-1101, 2009; [2] J.M. Lees. Seismic Time Series Analysis Tools, RSEIS package; R software;
direction. Fig.9 shows data distribution over the three principal clusters. The results of the same analysis are presented also for the largest cluster in the NS direction (fig.12 and 13). As fig.8 and 12 show, the largest cluster in both directions is characterized by a H/V peak at about 4.9Hz. It’s reasonable then to suppose that this is the fundamental resonance frequency at that single recording point.
[3] T. Kohonen. Self - organised formation of topologically correct feature map. Biological Cybernetics, 43:56-69, 1982; [4] K. Konno, T. Ohmachi. Ground-motion characteristics estimated from spectral ratio between horizontal and vertical components of microtremor. BSSA, 88:228-241, 1998; [5] R Development Core Team. R: A Language and Environment for Statistical Computing. R Foundation, Austria. ISBN: 3-900051-07-0. www.R-project.org; [6] P.D. Welch. The use of fast fourier transform for the estimation of power spectra: a method based on time averaging over short, modified periodograms. IEEE, 15:70-73, 1967.