Usability Evaluation of Multi-Device/Platform User Interfaces Generated by Model-Driven Engineering 1
1,2
1
Nathalie Aquino , Jean Vanderdonckt , Nelly Condori-Fernández , Óscar Dieste3, Óscar Pastor1 1
Centro de Investigación en Métodos de Producción de Software, Universidad Politécnica de Valencia, Camino de Vera s/n, 46022 Valencia, Spain – Tel.: +34 96 387 70 07 Ext. 83534 2 Université catholique de Louvain, Louvain School of Management (LSM), Place des Doyens, 1 – B-1348, Louvain-la-Neuve, Belgium – Tel.: +32 010/47 85 25 3 Facultad de Informática, Universidad Politécnica de Madrid, Campus de Montegancedo, 28660 Boadilla del Monte, Spain – Tel.: +34 91 336 50 11
{naquino, nelly, opastor}@pros.upv.es,
[email protected],
[email protected] ABSTRACT Nowadays several Computer-Aided Software Engineering environments exploit Model-Driven Engineering (MDE) techniques in order to generate a single user interface for a given computing platform or multi-platform user interfaces for several computing platforms simultaneously. Therefore, there is a need to assess the usability of those generated user interfaces, either taken in isolation or compared to each other. This paper describes an MDE approach that generates multi-platform graphical user interfaces (e.g., desktop, web) that will be subject to an exploratory controlled experiment. The usability of user interfaces generated for the two mentioned platforms and used on multiple display devices (i.e., standard size, large, and small screens) has been examined in terms of satisfaction, effectiveness and efficiency. An experiment with a factorial design for repeated measures was conducted for 31 participants, i.e., postgraduate students and professors selected by convenience sampling. The data were collected with the help of questionnaires and forms and were analyzed using parametric and non-parametric tests such as ANOVA with repeated measures and Friedman’s test, respectively. Efficiency was significantly better in large screens than in small ones as well as in the desktop platform rather than in the web platform, with a confidence level of 95%. The experiment also suggests that satisfaction tends to be better in standard size screens than in small ones. The results suggest that the tested MDE approach should incorporate enhancements in its multi-device/platform user interface generation process in order to improve its generated usability.
Categories and Subject Descriptors D.2.2 [Software Engineering]: Software/Program Verification Statistical methods, Validation. Metrics - Performance measures, Product metrics. Design Tools and Techniques - Object-oriented design methods, User interfaces. H.5.2 [Information Interfaces and Presentation]: User Interfaces – Evaluation/methodology, Graphical user interfaces (GUI).
Permission to make digital or hard copies of all or part of this work for personal or classroom use is granted without fee provided that copies are not made or distributed for profit or commercial advantage and that copies bear this notice and the full citation on the first page. To copy otherwise, or republish, to post on servers or to redistribute to lists, requires prior specific permission and/or a fee. ESEM’10, September 16–17, 2010, Bolzano-Bozen, Italy. Copyright 2010 ACM 978-1-4503-0039-01/10/09…$10.00.
General Terms Measurement, Performance, Experimentation, Human Factors.
Keywords Usability evaluation, model-driven engineering, multi-device interface, multi-platform interface, interaction with small and large screens, satisfaction, effectiveness, efficiency.
1. INTRODUCTION Nowadays, multiple computing platforms (e.g., desktops, laptops, palmtops, handhelds) and display devices (e.g., smart phones, wall screens) are available on the market and a lot of them are massively used. This wider availability of platforms and devices does not necessarily imply that the quality of interactive applications remains the same on these platforms and devices. Different factors may be affected by running the same interactive application on different platforms/devices: usability [1], portability [21], reusability [19], task completion time [16], development time [5], screen real estate [6, 16], among others. Therefore, there is a need to investigate what variables may positively or negatively influence the global quality of such user interfaces. This need becomes even more crucial when different user interfaces are produced for the different platforms/devices while taking into account constraints imposed by these platforms/devices (e.g., limited screen resolution, restricted widget set, reduced set of interaction capabilities, limited bandwidth). Model-Driven Engineering (MDE) could be used to effectively develop appropriate multi-platform user interfaces for various platforms/devices as used in different User Interface Development Environments such as UIML [9], UsiXML [15], TERESA [19], JUST-UI [18], and OO-Method [20]. These approaches usually comprise high level models that represent interactive tasks in a way that is independent from platforms and interaction modalities (e.g., character, graphical, vocal), as well as other lower level models that add the relevant details about platforms, devices, modalities, users, etc. From these models, model-to-model and model-to-code transformations could automatically generate the final user interfaces for different platforms/devices by applying appropriate transformations [6, 19]. However, only some MDE approaches (such as OO-Method) have related tools (in this case OLIVANOVA, a commercial tool) that exhibit enough automatic generation capabilities to become credible [21].
When it comes to automatically generating user interfaces for the same interactive application but for different computing platforms and/or devices, the resulting user interfaces may pose several usability problems [1]. Usability is a very important aspect of quality [10, 11], especially in the case of interactive applications. Therefore, it would be very interesting to know whether or not the usability of the resulting interfaces is the same on different platforms and devices. If the usability is better in some situations than in others, this information could help software companies that use MDE to recognize aspects of user interface models that need to be enhanced or to identify required modifications in transformation processes. This information is also useful for application users since it allows them to choose the best combination of platform and device that is available to them in order to interact with a software application. This paper presents an exploratory usability evaluation that has been carried out in an experimental controlled context. The aim of the experiment was to compare the usability perceived by users when interacting with multi-platform graphical user interfaces generated with the OO-Method/OLIVANOVA technology in different devices. User interfaces were generated in C# for .NET platform and JavaServer Faces for Java platform. Three different devices were used with small, standard, and large size screens. As ISO 9241-11 [10] suggests, usability was measured in terms of user satisfaction, effectiveness, and efficiency. The remainder of the paper is structured as follows: Section 2 presents background information about usability, MDE of user interfaces, and the OO-Method/OLIVANOVA technology. Section 3 presents related work in the area of usability evaluations of multidevice/platform user interfaces. Section 4 presents the experiment planning. Section 5 discusses the validity of the experiment and acknowledges potential threats. Section 6 presents data analysis and interpretation of results. Finally, Section 7 presents conclusions and some future avenues of this work.
2.2 Model-driven engineering of user interfaces MDE of user interfaces implies the definition of user interface models of high abstraction from which other user interface models of lower abstraction are obtained successively through model-tomodel transformations until the source code of the user interface is reached through a model-to-code transformation. Model-Driven Architecture (MDA) [17] is the best known initiative for MDE. OO-Method [20] is a software development method that is MDAcompliant. It involves models of the future interactive system at different levels of abstraction (Computation Independent Model or CIM, Platform Independent Model or PIM, and Platform Specific Model or PSM [17]) and provides a transformation mechanism among them. In the OO-Method development process, a Requirements Model that is equivalent to the CIM level of MDA is defined. From this Requirements Model, a Conceptual Model [20] that is equivalent to the PIM level of MDA is derived. This Conceptual Model specifies four system views: 1) the Object Model, which specifies the static properties of the interactive application by defining the classes and their relationships; 2) the Dynamic Model, which controls the application objects by defining their life cycle and interactions; 3) the Functional Model, which describes the semantics of object’s state changes; and 4) the Presentation Model, which specifies the user interface. Once the Conceptual Model is achieved, it is submitted to model compilation. For different possible target computing platforms (C# or ASP running on .NET or .NET 2.0; EJB, JSP, or JavaServer Faces running on Java), the source code of a fully functional application is automatically generated and structured according to a three-tiered architecture: interface, application, and persistence. OO-Method is supported by a commercial software suite named OLIVANOVA that was developed by CARE Technologies (http://www.care-t.com).
2. BACKGROUND 2.1 Usability There is a series of international standards for usability. These standards have been categorised [3] as primarily concerned with: 1) the quality of the product in use; 2) the quality of the product; 3) the quality of the process used to develop the product; and 4) the capability of an organisation to apply user centred design. Since the aim of this work is to compare the usability perceived by users when using multi-platform user interfaces in different devices, the international standard ISO 9241-11 [10], which is categorised in the first mentioned category, has been selected. ISO 9241-11 provides guidance on usability and defines it as the extent to which a product can be used by specified users to achieve specified goals with effectiveness, efficiency and satisfaction in a specified context of use. Furthermore, effectiveness is defined as the accuracy and completeness with which users achieve specified goals. Efficiency relates to the resources expended in relation to the accuracy and completeness with which users achieve goals. Satisfaction is defined as freedom from discomfort, and positive attitudes towards the use of the product.
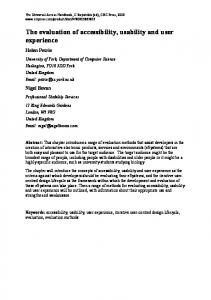
Figure 1. The OO-Method Presentation Model decomposition
In this work, we focus on details about the Presentation Model. Figure 1 presents the Presentation Model decomposition [18]. The interaction units in the second level represent the main interactive operations that can be performed on the domain objects. There are four interaction units: 1) the Service Interaction Unit (SIU), which allows the modification of objects, their attributes, and relationships; 2) the Population Interaction Unit (PIU), which shows a group of similar objects; 3) the Instance Interaction Unit (IIU), which shows a single object at a time; and 4) the Master/Detail Interaction Unit (MDIU), which shows a hierarchical view of relationships among objects. The next level of decomposition, the third one, consists of restricting and specifying the behaviour of each interaction unit using elementary patterns. For example, if a PIU is being specified, then five elementary patterns could be attached to it: 1) the Filter pattern filters a set of objects to display only the needed ones; 2) the Order Criterion pattern specifies the order in which the objects will be shown; 3) the Display Set pattern restricts which attributes of the objects are going to be presented; 4) the Navigation pattern specifies navigation among objects; and 5) the Action pattern specifies functions that can be triggered from a selected object.
interfaces that were automatically produced by MDE techniques, but they did not consider multi-device/platform user interfaces.
From the explanation of the OO-Method Presentation Model decomposition, the SIU and PIU can be considered to be the most relevant interaction units of the approach since the MDIU is a composition of other interaction units and the IIU is a special case of a PIU in which just one object at a time is shown. Therefore, the SIU and PIU were selected for this experiment.
The formulated hypotheses are the following: Null hypothesis 1, H10: when using interfaces automatically generated from PIUs, the user satisfaction is the same for different platforms and devices.
3. RELATED WORK Many studies have been done regarding usability evaluation of graphical user interfaces. However, most of these works have been carried out independently of each other, taking into account just one platform and/or device at a time and considering different hypotheses, variables, contexts, designs, procedures and techniques for analysis. Therefore, it is very difficult to make comparisons among these studies. In this work, we attempt to evaluate the usability of graphical user interfaces for different platforms and devices but following the same experimental design, experimental procedure, and analysis techniques in order to be able to compare the usability in the different devices and platforms. Furthermore, we focus on graphical user interfaces developed by MDE. To our knowledge, there are not many works that consider this comparative perspective. However, we know that Chesta et al. [5] evaluated a multi-platform user interface generated by TERESA [19] according to several criteria: tool interface (intuitiveness, learnability), tool functionalities (completeness, developer satisfaction), final product obtained by employing the tool (user satisfaction, maintainability and portability), and approach cost/effectiveness (development efficiency, integrability). Their results suggest that the usage of the MDE approach improved some of these metrics compared to a manual approach where the user interface is manually produced. Two applications (i.e., an electronic desk and an electronic agenda) were considered. This preliminary study identified the need for further research since mainly qualitative measures were investigated. McKay et al. [16] demonstrated that properly transforming a web page taking into account constraints imposed by the target platform may significantly influence the resulting usability as opposed to a web page without any transformation. Abrahão et al. [1] conducted an experimental study testing the usability of user
4. EXPERIMENT PLANNING1 Following the template proposed by the Goal/Question/Metric method [2], the goal of the experiment presented in this paper can be stated as follows: Analyze multi-device/platform graphical user interfaces generated by MDE for the purpose of evaluating their usability with respect to the user satisfaction, effectiveness, and efficiency, from the point of view of the researchers and software companies who develop tools for MDE of user interfaces, in the context of computer science postgraduate students and professors using user interfaces of an interactive application. The application was developed with OO-Method/OLIVANOVA. The user interfaces were derived from a SIU and a PIU interaction units and were generated for two different platforms (i.e., C# running on .NET and JavaServer Faces running on Java) and used in three different devices (i.e., small, standard, and large screens).
4.1 Hypotheses
Alternative hypothesis 1, H11: when using interfaces automatically generated from PIUs, the user satisfaction is not the same for different platforms and devices. Null hypothesis 2, H20: when using interfaces automatically generated from PIUs, the user effectiveness is the same for different platforms and devices. Null hypothesis 3, H30: when using interfaces automatically generated from PIUs, the user efficiency is the same for different platforms and devices. Since we were interested in knowing, on one hand, the usability results of user interfaces generated from SIU, and on the other hand, the usability results of user interfaces generated from PIU, each null hypothesis includes a condition about the used interaction unit. For reasons of space, we have listed here the null hypotheses related to PIUs only. There are three more equivalent null hypotheses for SIUs. We also explicitly state just the alternative hypothesis 1, H11. There are two more equivalent alternative hypotheses for PIUs, and three for SIUs.
4.2 Variables Response variables. In this experiment, response variables were user satisfaction, effectiveness, and efficiency. Satisfaction was measured with respect to the user’s perceptions of system usefulness, information quality, interface quality, and overall satisfaction. Overall satisfaction is an aggregation of the three other perceptions. All these measures were derived from answers to the Computer System Usability Questionnaire (CSUQ) [13], so they are indirect measures. Answers to CSUQ were expressed using a 7-point Likert scale [14] in which 1 represents the best perception score (strongly agree) and 7 represents the worst perception score (strongly disagree). 1
Sections 4, 5, and 6 have been structured according to [22].
Effectiveness was measured by task completion percentage, which represents the percentage at which a task has been correctly carried out. This metric is related to a ratio scale, and it is a direct measure. Efficiency was measured by task completion percentage in relation to the time expended doing a task. This metric is related to a ratio scale, and it is an indirect measure. Factors. The variables that were intentionally varied during the experimentation were: device (small, standard, and large size screens); platform (C# running on .NET and JavaServer Faces running on Java); and interaction unit (SIU and PIU). All of these are related to the nominal scale.
4.3 Experimental context Experimental subjects. The set of experimental subjects was selected by convenience sampling, i.e., the nearest convenient persons were selected as subjects. Computer science postgraduate students and professors from the Universidad Politécnica de Valencia, Spain were invited to participate in the experiment. Participation was voluntary and subjects did not receive incentives. Thirty-one people participated in the experiment. Participation was anonymous (aliases were used instead of names). The subjects did not receive training. A demographic questionnaire was applied for the purpose of characterizing subjects according to age, gender, study level, and experience with the different devices involved and with the use of applications generated with OLIVANOVA. All subjects used standard size screens previously to the experiment, 42% had experience using large screens, and 39% had experience using devices with small screens. Furthermore, 81% of the subjects had experience in the domain of the application used in the experiment, and 42% had experience using applications generated with OLIVANOVA. However, in this paper, we do not analyze if these demographic differences affect the perception of usability in the different devices and platforms. Objects of study. The objects studied were multi-device/platform graphical user interfaces generated by MDE. The experiment was conducted using an Expenses Report application that allows the expenses of the employees of an organization to be managed. The Expenses Report application was developed using the OOMethod/OLIVANOVA technology. Two specific user interfaces of the Expenses Report application were selected to be used in the experiment. One of them was derived from a SIU of the OOMethod Presentation Model of the Expenses Report application, and the other one was derived from a PIU of the same model. The user interface derived from a SIU allows new expense registries to be added in the Expenses Report application, while the one derived from a PIU allows the list of expense registries to be displayed. The Expenses Report application was generated for two platforms: C# running on .NET (desktop platform) and JavaServer Faces running on Java (web platform). Therefore, there were four user interfaces to be evaluated. Also, there were three different set-ups of devices in which the user interfaces were evaluated: 1) an ultra-mobile PC (800MHz, 1GB RAM) with a small touch screen (7’’, resolution: 800x480) and stylus; 2) a PC (1GHz, 1GB RAM) connected to a standard size screen (19’’, resolution: 1280x1024) with mouse and keyboard; and 3) a PC (1GHz, 1GB RAM) connected to a large screen TV (32’’, resolution: 1024x768) with mouse and keyboard. The 3 PCs were running Microsoft Windows XP as operating
system (Tablet PC and Professional editions) and Microsoft .NET Framework 2.0 as the platform for the desktop version of the Expenses Report application. The web version of the Expenses Report application was installed in a server with characteristics similar to those of the three PCs described above. JBoss V4.2 was used as application server. The subjects evaluated the web application using Internet Explorer V6 or higher. A link to the web version of the Expenses Report application as well as more information and pictures of the three set-ups of devices and screenshots of the user interfaces in the different screen sizes can be found at: http://www.pros.upv.es/users/naquino/mdp-usabilityeval/.
4.4 Experiment design The selected experimental design corresponds to a factorial 3x2x2 design with repeated measures. This design has also been termed "blocked subject-object study" [22], as it implies that subjects work on more than one object. As Table 1 shows, each subject evaluated two user interfaces of the Expenses Report application, the one derived from SIU and the one derived from PIU. Each of these interfaces were evaluated in their two platform versions (i.e., desktop and web) and each of these four combinations were evaluated in the three set-ups of devices (i.e., with a small, a standard, and a large size screen). The order in which subjects tested the different combinations was randomized. Table 1. Factorial 3x2x2 design with repeated measures Small Platform Desktop Web IU IU S P S P All
All
All
All
Device Standard Large Platform Platform Desktop Web Desktop Web IU IU IU IU S P S P S P S P Subjects All All All All All All All All IU = interaction unit; S=SIU; P=PIU
Twelve different tasks, 6 for PIU and 6 for SIU, were prepared so that subjects used a different task for each of the 12 combinations of device, platform, and interaction unit. Although the 6 PIU tasks were different, they were similar regarding complexity. Also, the 6 SIU tasks were similar in complexity. The 12 tasks can be found at http://www.pros.upv.es/users/naquino/mdp-usability-eval/. The assignment of which task to perform in each combination of device, platform, and interaction unit was done randomly.
4.5 Experimental procedure The empirical study was initiated with a short presentation in which general information and instructions were given. Then, a demographic questionnaire was applied. Afterwards, following a guideline that specified what to do and which objects to use, the subjects interacted with 12 user interfaces (3 devices x 2 platforms x 2 interaction units), carrying out a different task in each of them. For each task, the guideline presented some questions to the subjects. In order to answer these questions, the subjects had to interact with the application. The task completion percentage was derived from answers to these questions. These answers were corrected and a completion percentage was assigned to each task carried out by each subject according to their answers. The guideline also requested subjects to write down the time at which they started and completed each task, so efficiency was derived using these start and completion times. Furthermore, the guideline presented a CSUQ questionnaire to be filled out after completion of each task. Following the indications given by the designers of
CSUQ [13], the 19 numerical answers of the CSUQ were upgraded from the Likert scale to the interval scale. Then, the four perceptions of satisfaction (system usefulness, information quality, interface quality, and overall satisfaction) were obtained applying the rules specified in [13].
instrumentation as well as all tasks and objects of study where pre-validated by two persons. Furthermore, since questionnaires and guidelines were provided in paper form, the transcription of data into spreadsheets and the statistical analysis tool was doublechecked.
Each subject spent approximately two hours to complete the experiment. Since only one ultra-mobile PC and one TV were available, the experiment was conducted in groups of at most three subjects at a time, on different days. Each subject started with one device and when the four evaluations corresponding to the device were completed, the subject changed the device with another subject. The specific day and hour in which each subject carried out the experiment was defined according to his/her availability (a calendar was previously defined). The applied demographic questionnaire and the guidelines can be found at: http://www.pros.upv.es/users/naquino/mdp-usability-eval/.
Maturation. This refers to the effect that subjects react differently as time passes. With the purpose of reducing the learning effect during the course of the experiment, different tasks, but with similar complexity, were proposed. In addition, to diminish negative effects in the subjects (tiredness or boredom), a five-minutes break was given to the participants at each change of device.
5. VALIDITY EVALUATION: THREATS In [22], various types of threats that could affect the results of an experiment are listed and explained. This section discusses some of these threats focusing on those that could affect the results of this experiment. We also comment on the measures that we took to avoid or to alleviate these threats.
5.1 Conclusion validity Threats to conclusion validity are concerned with issues that affect the ability to draw the correct conclusion about relations between the treatment and the outcome of an experiment. Reliability of measures. The validity of an experiment is highly dependent on the reliability of the measures. In general, objective measures are more reliable than subjective measures. In order to reduce this threat, we used the CSUQ questionnaire for the subjective satisfaction measure. CSUQ has excellent psychometric reliability properties that have been reported in [13]. However, in this experiment, the precision of efficiency may have been affected since the task completion time was measured manually by users using the computer clock. Reliability of the application of treatments to subjects. The application of treatments to subjects should be as standard as possible over different subjects and occasions. This could have been affected since evaluations were carried out on different occasions. To insure maximum similarity, a standard procedure was designed to be equally applied by the experimenter in each occasion. In addition, as subjects’ perception could have been affected by order and time of evaluation, the assignment of devices, platforms, and tasks was carried out randomly with the purpose of diminishing this threat. Random heterogeneity of subjects. If a group is very heterogeneous, there is a risk that the variation due to individual differences is larger than due to the treatment. This might have affected the experiment results since the subjects had different levels of experience in using the different devices.
5.2 Internal validity Threats to internal validity concern issues that may indicate a causal relationship even though there is none. Instrumentation. This refers to the effect caused by the instruments used in the experiment. If these are badly designed, the experiment is affected negatively. To minimize this threat, all the
5.3 Construct validity Threats to construct validity refer to the extent to which the experiment setting actually reflects the construct under study. The experiment was conducted using a representative application (Expenses Report), which was implemented by the developers of the OLIVANOVA tool themselves, i.e., CARE Technologies. This application is used by CARE Technologies in its training courses about the tool. Therefore, interfaces were automatically derived from conceptual models validated semantic and syntactically by the analysts of the CARE Technologies company.
5.4 External validity Threats to external validity concern the ability to generalize experiment results outside the experiment setting. Interaction of selection and treatment. This is the effect of not having a representative population from which to generalize results of the experiment. In our case, subjects with different levels of experience in using applications generated with OLIVANOVA and the different devices participated in the experiment, but all of them had a background in computer science. More experiments with a greater heterogeneity of subjects are necessary to reconfirm the results obtained. Interaction of setting and treatment. This is the effect of not having representative material. In the experiment, we thoughtfully selected a representative application domain. However, more empirical studies with other domains could also be necessary. Regarding the selection of the OO-Method/OLIVANOVA approach, we consider it to be representative of other MDE approaches for the development of user interfaces since it has been patented (http://www.faqs.org/patents/app/20080275910) and is currently being used in commercial and industrial environments. In any case, it will be very interesting to replicate this experiment with other MDE approaches for the development of user interfaces.
6. ANALYSIS AND INTERPRETATION OF RESULTS Statistical analysis has been carried out using the Statistical Package for the Social Sciences (SPSS) V16.0, at a confidence level of 95% (α=0.05). This section presents the analysis and interpretation of results related to PIU (results related to SIU are not presented because of space limitations, but they are available at http://www.pros.upv.es/users/naquino/mdp-usability-eval/). As 31 subjects interacted with 6 user interfaces related to PIU, 31 repeated measures were available to be analyzed. Each measure of satisfaction, effectiveness and efficiency was repeated 6 times (2 platforms x 3 devices). This resulted in 6 sub-variables for each
response variable (one sub-variable for small screen and web; another one for small screen and desktop; and four more for standard screen and web; standard screen and desktop; large screen and web; and, large screen and desktop, respectively).
6.1 Analyzing satisfaction First of all, the 24 sub-variables related to system usefulness, information quality, interface quality and overall satisfaction were explored to identify outliers. 24 box plots were employed for this purpose, one for each sub-variable. The 25 percentile is considered the bottom of a box plot. The 75 percentile is its top. The length of the box plot is the difference between the top and the bottom. According to [7], all values that are more than 1.5 box lengths away from the top, as well as all values that are more than 1.5 box lengths away from the bottom, can be considered outliers. Subject R12P1 was an outlier in 2 box plots related to information quality, in 3 box plots related to interface quality, and in 3 box plots related to overall satisfaction. In all these cases, R12P1 gave very high scores. Therefore, this subject was discarded from all analysis related to satisfaction. Hence, system usefulness, information quality, interface quality, and overall satisfaction were analyzed considering the 30 remaining subjects.
Table 3 presents the Mauchly sphericity test for the ANOVA with repeated measures related to overall satisfaction. Since the critical level (Sig.) associated to the Mauchly W is < 0.05 for the interaction effect (device x platform), the sphericity assumption is rejected. Table 3. The Mauchly sphericity test for overall satisfaction Within subjects effect Device Platform Device x Platform
M-W
0.97 1.00
App. ChiSquare 0.98 0.00
2.00 0.00
0.61
0.97 1.00
1.00 1.00
0.50 1.00
0.77
7.16
2.00
0.03
0.82
0.86
0.50
Table 2 presents the descriptive statistics for overall satisfaction. A low value in the mean column implies a good perception of overall satisfaction, while a high value implies a bad perception.
Platform
Effect
Table 2. Descriptive statistics for overall satisfaction
Standard
Large
Total
Epsilon HF
LB
Table 4. Multivariate tests for overall satisfaction Device
Mean 3.48 3.22 3.35 3.12 2.99 3.05 3.18 2.97 3.08 3.26 3.06
GG
In this situation, the multivariate tests presented in Table 4 are appropriate to determine the effect of device and platform on overall satisfaction. As Table 4 shows, the device, the platform, nor their interaction have a significant effect on the perceptions of overall satisfaction. However, it can be observed that for all multivariate tests (Pillai, Wilks, Hotelling and Roy), the significance level of the device is 0.08. Even though this does not mark a significant difference, we could consider that perceptions of overall satisfaction tend to be different for different devices.
Since overall satisfaction is an aggregation of the three other satisfaction measures, we relate the analysis of overall satisfaction to the test of H10.
Platform Web Desktop Total Web Desktop Total Web Desktop Total Web Desktop
Sig.
GG=Greenhouse-Geisser; HF=Huynh-Feldt; LB=lower-bound
6.1.1 Overall satisfaction
Device Small
df
N 30 30 60 30 30 60 30 30 60 90 90
Std. Deviation 1.49 1.35 1.42 1.39 1.12 1.26 1.19 1.35 1.27 1.36 1.27
A one-sample Kolmogorov-Smirnov test was performed for each of the 6 sub-variables related to overall satisfaction. Since all pvalues were greater than 0.05, all sub-variables resulted in having normal distributions. Therefore, a parametric test, ANOVA with repeated measures, was used to determine if the factors (device and platform) have an effect on overall satisfaction. Sphericity is an assumption of ANOVAs with repeated measures factors. Sphericity relates to the equality of the variances of the differences between levels of the repeated measures factor. Sphericity requires the variances for each set of difference scores to be equal. The Mauchly sphericity test [12] can be used to verify sphericity. When the significance level of the Mauchly test is < 0.05, then sphericity cannot be assumed. When the sphericity condition is not met, multivariate tests such as Pillai, Wilks, Hotelling or Roy [4] are appropriate to determine the effect of factors on response variables. Furthermore, univariate tests that apply corrections such as Greenhouse-Geisser, Huynh-Feldt, or lowerbound are also appropriate. When the sphericity condition is met, a univariate test that assumes sphericity must be used.
Device x Platform
Pillai Wilks Hotelling Roy Pillai Wilks Hotelling Roy Pillai Wilks Hotelling Roy
Value 0.17 0.83 0.20 0.20 0.08 0.92 0.09 0.09 0.02 0.98 0.02 0.02
F 2.78 2.78 2.78 2.78 2.59 2.59 2.59 2.59 0.23 0.23 0.23 0.23
Hyp. df 2.00 2.00 2.00 2.00 1.00 1.00 1.00 1.00 2.00 2.00 2.00 2.00
Error df 28.00 28.00 28.00 28.00 29.00 29.00 29.00 29.00 28.00 28.00 28.00 28.00
Sig. 0.08 0.08 0.08 0.08 0.12 0.12 0.12 0.12 0.79 0.79 0.79 0.79
Table 5. Univariate tests for overall satisfaction Source Device
Error (Device)
Platform
Error (Platform)
Device x Platform
Error (Device x Platform)
SA GG HF LB SA GG HF LB SA GG HF LB SA GG HF LB SA GG HF LB SA GG HF LB
Type III Sum df Mean F Sig. of Squares Square 3.31 2.00 1.65 2.62 0.08 3.31 1.93 1.71 2.62 0.08 3.31 2.00 1.65 2.62 0.08 3.31 1.00 3.31 2.62 0.12 36.59 58.00 0.63 36.59 56.06 0.65 36.59 58.00 0.63 36.59 29.00 1.26 1.81 1.00 1.81 2.59 0.12 1.81 1.00 1.81 2.59 0.12 1.81 1.00 1.81 2.59 0.12 1.81 1.00 1.81 2.59 0.12 20.28 29.00 0.70 20.28 29.00 0.70 20.28 29.00 0.70 20.28 29.00 0.70 0.12 2.00 0.06 0.13 0.87 0.12 1.63 0.07 0.13 0.83 0.12 1.72 0.07 0.13 0.84 0.12 1.00 0.12 0.13 0.72 26.14 58.00 0.45 26.14 47.32 0.55 26.14 49.75 0.53 26.14 29.00 0.90 SA=sphericity assumed; GG=Greenhouse-Geisser; HF=Huynh-Feldt; LB=lower-bound
Since the sphericity assumption was rejected, univariate tests that apply corrections are also appropriate to be used to check whether or not factors affect overall satisfaction. These univariate tests with corrections are presented in rows GG (Greenhouse-Geisser correction), HF (Huynh-Feldt correction), and LB (lower-bound correction) of Table 5. GG and HF tests also suggest that different devices tend to affect overall satisfaction, with a significance of 0.08. Since we identified a small tendency to have a difference in the perceptions of overall satisfaction in the different devices, and there were three devices involved in the analysis, we were interested in determining where those differences appear. Therefore, the option named Estimated Marginal Means in the SPSS procedure for ANOVA with repeated measures was employed to compare the main effects of the different devices, using Bonferroni as the confidence interval adjustment. As Table 6 indicates, there are no significant differences between the three pairs of devices. However, since the significance level in the comparisons between small and standard screen is 0.09, we could consider that perceptions of overall satisfaction tend to be different when using small or standard screens. Table 6. Paired comparisons between devices (I) Device
Small Standard Large
(J) Device
Standard Large Small Large Small Standard
Difference between means (I-J)
Std. Error
Confidence interval 90% for the difference LB UB 0.30 0.13 0.09 0.01 0.59 0.27 0.16 0.26 -0.07 0.62 -0.30 0.13 0.09 -0.59 -0.01 -0.03 0.15 1.00 -0.35 0.30 -0.27 0.16 0.26 -0.62 0.07 0.03 0.15 1.00 -0.30 0.35 Adjustment for multiple comparisons: Bonferroni
tests were carried out to determine if device and platform have a significant effect on the three perceptions. In none of the three cases did we find significant differences. However, as for overall satisfaction, we were able to identify a possible tendency in which system usefulness is perceived differently in small and standard screens (with a significance of 0.06). As Table 7 shows, the mean for system usefulness was 3.18 with the small screen, and 2.81 with the standard screen. Again in this case, the difference was not large, but we could say that subjects tend to perceive slight differences in system usefulness when working with small and standard screens and that these perceptions tend to be better with the standard screen. Table 7. Descriptive statistics for system usefulness Device Small
Standard
Large
Total
Sig.
6.1.2 System usefulness, information quality, and interface quality Since overall satisfaction is an aggregation of the perceptions of system usefulness, information quality, and interface quality, these measures were also analyzed. Table 7, Table 8, and Table 9 present their descriptive statistics, respectively. A low value in the mean column implies a good perception, while a high value implies a bad perception. In the three cases, one-sample Kolmogorov-Smirnov tests were performed for each involved sub-variables. All of them resulted in having normal distributions, so ANOVA with repeated measures
Mean 3.30 3.06 3.18 2.90 2.71 2.81 2.94 2.81 2.87 3.05 2.86
N 30 30 60 30 30 60 30 30 60 90 90
Std. Deviation 1.50 1.36 1.43 1.53 1.18 1.36 1.16 1.41 1.28 1.40 1.31
Table 8. Descriptive statistics for information quality Device Small
Standard
Large
LB=lower-bound; UB=upper-bound
According to the analysis that was carried out for overall satisfaction, H10 cannot be rejected. In other words, when using interfaces automatically generated from PIUs, the overall satisfaction was not significantly different in the diverse devices and platforms. However, we were able to identify a possible tendency in which overall satisfaction is perceived differently in small and standard screens. As Table 2 shows, the mean for overall satisfaction was 3.35 with the small screen, and 3.05 with the standard screen. Both means are very near the value 3 of the 7-point Likert scale. The value 3 means that subjects weakly agree with a good perception of overall satisfaction. Therefore, according to the results, we could say that subjects tend to perceive very slight differences in overall satisfaction when working with small and standard size screens and that these perceptions tend to be better with the standard screen.
Platform Web Desktop Total Web Desktop Total Web Desktop Total Web Desktop
Total
Platform Web Desktop Total Web Desktop Total Web Desktop Total Web Desktop
Mean 3.58 3.32 3.45 3.33 3.29 3.31 3.38 3.05 3.22 3.43 3.22
N 30 30 60 30 30 60 30 30 60 90 90
Std. Deviation 1.53 1.43 1.47 1.40 1.23 1.31 1.35 1.33 1.34 1.41 1.32
Table 9. Descriptive statistics for interface quality Device Small
Standard
Large
Total
Platform Web Desktop Total Web Desktop Total Web Desktop Total Web Desktop
Mean 3,74 3,33 3,54 3,31 3,20 3,25 3,31 3,22 3,27 3,45 3,25
N 30 30 60 30 30 60 30 30 60 90 90
Std. Deviation 1,74 1,44 1,60 1,46 1,24 1,35 1,51 1,62 1,55 1,57 1,43
6.2 Analyzing effectiveness Since effectiveness was measured by task completion percentage, the analysis of this response variable is related to the test of H20. The 6 sub-variables related to task completion percentage were explored to identify outliers. Six box plots were employed for this purpose, one for each sub-variable. Several subjects, 12, were identified as outliers. All these 12 subjects reported task completion percentages that were more than 1.5 box lengths away from the bottom of box plots (i.e. they reported very low task completion percentages). First, we analyzed task completion percentages discarding the 12 outliers, so 19 subjects were considered. Later, in order to compare results, we also analyzed task completion percentages without discarding outliers, so the 31 subjects were
considered. Table 10 presents the descriptive statistics for task completion percentage having discarded outliers. Table 10. Descriptive statistics for task completion percentage Device Small
Standard
Large
Total
Platform Web Desktop Total Web Desktop Total Web Desktop Total Web Desktop
Mean 87.72 92.98 90.35 87.72 85.96 86.84 100.00 87.72 93.86 91.81 88.89
N 19 19 38 19 19 38 19 19 38 57 57
Std. Deviation 22.80 13.96 18.84 19.91 23.08 21.28 0.00 19.91 15.22 18.13 19.25
One-sample Kolmogorov-Smirnov tests were performed for each of the sub-variables related to task completion percentage. Since all p-values were lower than 0.05, none of the sub-variables resulted in having a normal distribution. Therefore, the Friedman non-parametric test was used to determine if the factors (device and platform) have an effect on task completion percentage. The Friedman test results were the following: Chi-square = 8.11; df = 5; and Asymp. Sig. = 0.15. Therefore, device and platform do not have a significant effect on task completion percentage. As previously mentioned, we performed a similar analysis without discarding outliers in order to compare results. As in the previous case, sub-variables were not normally distributed, and a Friedman test was performed to verify the effects of device and platform. No significant differences were identified. According to the analysis that was carried out for task completion percentage, which is the measure used in this experiment for effectiveness, H20 cannot be rejected. In other words, when using interfaces automatically generated from PIUs, the task completion percentage, and hence, the effectiveness, were not significantly different in diverse devices and platforms. As Table 10 shows, in general, means of task completion percentage were high for all devices, platforms and combinations of them.
6.3 Analyzing efficiency The analysis of efficiency is related to the test of H30. The 6 sub-variables related to efficiency were explored to identify outliers. Six box plots were employed for this purpose, one for each sub-variable. Several subjects, 5, were identified as outliers. All these 5 subjects reported efficiency values that were more than 1.5 box lengths away from the top of box plots (i.e., they reported very high efficiency values). First, we analyzed efficiency discarding the 5 outliers, so 26 subjects were considered. Later, in order to compare results, we also analyzed efficiency without discarding outliers, so the 31 subjects were considered. Table 11 presents the descriptive statistics for efficiency having discarded outliers. A one-sample Kolmogorov-Smirnov test was performed for each of the sub-variables related to efficiency. Since all p-values were greater than 0.05, all sub-variables resulted in having normal distributions. Therefore, a parametric test, ANOVA with repeated measures, was used to determine if the factors (device and platform) have an effect on efficiency. Table 12 presents the Mauchly sphericity test for the ANOVA with repeated measures related to efficiency. Since the critical level (Sig.) associated to the Mauchly W is > 0.05 in all cases, the sphericity assumption cannot be rejected.
Table 11. Descriptive statistics for efficiency Device Small
Platform Web Desktop Total Web Desktop Total Web Desktop Total Web Desktop
Standard
Large
Total
Mean 0.40 0.60 0.50 0.58 0.67 0.62 0.70 0.72 0.71 0.56 0.66
N 26 26 52 26 26 52 26 26 52 78 78
Std. Deviation 0.24 0.23 0.26 0.29 0.35 0.32 0.28 0.30 0.29 0.30 0.30
Table 12. The Mauchly sphericity test for efficiency Within subjects effect Device Platform Device x Platform
M-W 0.98 1.00
App. ChiSquare 0.56 0.00
df
Sig.
2.00 0.00
0.76
GG 0.98 1.00
0.95
1.17
2.00
0.56
0.95
Epsilon HF LB 1.00 0.50 1.00 1.00 1.00
0.50
GG=Greenhouse-Geisser; HF=Huynh-Feldt; LB=lower-bound
Since the sphericity condition is met, a univariate test that assumes sphericity must be used. The univariate tests presented in rows SA (sphericity assumed) of Table 13 are appropriate, and they indicate that device and platform have a significant effect on the means of efficiency. However, the interaction of device and platform does not have a significant effect. Table 13. Univariate tests for efficiency Source Device
Error (Device)
Platform
Error (Platform)
Device x Platform
Error (Device x Platform)
SA GG HF LB SA GG HF LB SA GG HF LB SA GG HF LB SA GG HF LB SA GG HF LB
Type III Sum df Mean F Sig. of Squares Square 1.15 2.00 0.58 6.42 0.00 1.15 1.95 0.59 6.42 0.00 1.15 2.00 0.58 6.42 0.00 1.15 1.00 1.15 6.42 0.02 4.48 50.00 0.09 4.48 48.87 0.09 4.48 50.00 0.09 4.48 25.00 0.18 0.42 1.00 0.42 8.27 0.01 0.42 1.00 0.42 8.27 0.01 0.42 1.00 0.42 8.27 0.01 0.42 1.00 0.42 8.27 0.01 1.28 25.00 0.05 1.28 25.00 0.05 1.28 25.00 0.05 1.28 25.00 0.05 0.24 2.00 0.12 1.71 0.19 0.24 1.91 0.12 1.71 0.19 0.24 2.00 0.12 1.71 0.19 0.24 1.00 0.24 1.71 0.20 3.46 50.00 0.07 3.46 47.72 0.07 3.46 50.00 0.07 3.46 25.00 0.14 SA=sphericity assumed; GG=Greenhouse-Geisser; HF=Huynh-Feldt; LB=lower-bound
Since we identified a significant difference regarding device, and there were three devices involved in the analysis, we were interested in determining where those differences appear. Therefore, the option named Estimated Marginal Means in the SPSS procedure for ANOVA with repeated measures was employed to compare the main effects of the different devices, using Bonferroni as the confidence interval adjustment. As Table 14 shows, there is a significant difference between the means of efficiency when using a small screen and a large size screen. There is no significant difference between a small and a standard screen, nor between a standard size and a large screen. Furthermore, since only two
platforms are involved in the analysis, it was not necessary to perform more comparisons in this case. Table 14. Paired comparisons for device (I) Device
Small Standard Large
(J) Device
Standard Large Small Large Small Standard
Difference between means (I-J)
Std. Error
Sig.
Confidence interval 90% for the difference LB UB -0.12 0.06 0.14 -0.27 0.03 -0.21 0.06 0.00 -0.35 -0.07 0.12 0.06 0.14 -0.03 0.27 -0.09 0.06 0.51 -0.25 0.07 0.21 0.06 0.00 0.07 0.35 0.09 0.06 0.51 -0.07 0.25 Adjustment for multiple comparisons: Bonferroni LB=lower-bound; UB=upper-bound
According to the analysis that was carried out for efficiency, H30 can be rejected. This is because, when using interfaces automatically derived from PIUs, the efficiency was significantly different for the small and large screens as well as for the web and desktop platforms. As Table 11 shows, the mean for efficiency was 0.50 with the small screen, and 0.71 with the large screen. Therefore, efficiency was significantly better with the large screen. Furthermore, the mean for efficiency was 0.56 with the web platform, and 0.66 with the desktop platform. Therefore, efficiency was significantly better with the desktop platform. As previously mentioned, we performed a similar analysis without discarding outliers in order to compare results. In this case, subvariables were not normally distributed, so the non-parametric Friedman test was used to verify the effects of device and platform. The test results were significant. Then, taking into account that in this case data were not normally distributed, the nonparametric Wilcoxon signed-rank tests were applied to the 15 possible combinations that result from the 6 sub-variables related to efficiency in order to identify where differences occur. In all these cases, a Bonferroni correction to control the error rate was used, so the considered alpha level was 0.003 (0.05/6). Under these conditions, it was discovered that using the standard size screen or the large one with the web or desktop platforms was significantly better than using the small screen with the web platform. In a similar way, using the standard size screen or the large one with the web or desktop platforms was better than using the small screen with the desktop platform. However, in this case, the differences were not significant. These results confirm that the small screen obtains the lowest results regarding efficiency, and that H30 can be rejected.
6.4 Discussion about results Our main results regarding user interfaces generated from PIUs are the following: overall satisfaction and system usefulness tend to be better for standard size screens than for small ones; efficiency is better for large screens than for small ones and for the desktop platform rather than for the web one; and information quality, interface quality, and effectiveness were not affected by the use of different sized devices or platforms. Currently the OO-Method Presentation Model allows a user interface to be specified in a way that is independent from platforms and devices (the approach does not include explicit platform or device models) and the transformation logic is internally defined in the OLIVANOVA tool, which generates the user interface code. Therefore, we consider that the tendency to have better results for standard or large screens and for the desktop platform is related to
the fact that the OO-Method/OLIVANOVA approach is mainly used to develop organizational information systems [20]. Consequently, its internal transformation logic is more suitable for desktop platforms and standard size screens, which are the options most commonly used in organizational environments. We also consider that the device with the small screen obtained the worst results regarding overall satisfaction, perception of system usefulness, and efficiency because the kinds of user interfaces that people are used to using in small devices are different from the types of user interfaces generated with OLIVANOVA. Normally, user interfaces used in small devices are developed manually, specifically for that type of platform, using particular types of layouts, widgets, and icons. Therefore, the OOMethod/OLIVANOVA approach should incorporate enhancements in order to generate multi-device/platform user interfaces from models. It surprised us somewhat that the results for the perception of interface quality were similar in the different devices and platforms. We expected to see a difference at least with regard to the small device. Perhaps the novel experience of interacting with user interfaces generated with OLIVANOVA in small devices influenced people to have a similar perception than when using the other devices. We were not surprised that the perception of information quality was not affected by the different devices and platforms since the information that was presented in all the user interfaces was the same. Furthermore, since effectiveness was not affected by the different devices or platforms, it stands to reason that the ability of a person to complete a task might be independent of devices and platforms.
7. CONCLUSION AND FUTURE WORK This paper has presented an exploratory usability evaluation of multi-device/platform graphical user interfaces generated by MDE. Usability has been measured in terms of satisfaction, effectiveness, and efficiency. Our evaluation included user interfaces generated using the OLIVANOVA tool from interaction units of the OO-Method Presentation Model. The user interfaces were generated for web and desktop platforms and were evaluated using small, standard, and large size screens. Furthermore, user interfaces were evaluated by computer science postgraduate students and professors. Efficiency was affected by different devices and also by different platforms. Overall satisfaction and the perception of system usefulness tend to be affected by different devices. The perceptions of information quality and interface quality as well as the effectiveness were not affected by devices or platforms. In general, the standard size screen and the desktop platform obtained better results. These results suggest that the OOMethod/OLIVANOVA technology should take into consideration the incorporation of enhancements in its multi-device/platform user interface generation process in order to improve the usability of the user interfaces for the various platforms and devices, especially for small screens and web platforms. As future related works, we are planning to analyze whether or not the learning effects that resulted from repeated evaluations has affected the results of our experiment. We should also perform more analyses in order to determine whether the obtained results can be totally attached to the MDE development process or if they are partially or totally caused by the devices themselves or by the experience of the users with those devices. It could also be interesting to repeat this experiment with a wider variety of subjects
and with different MDE approaches for the development of user interfaces in order to see if the results are the same. Finally, we are also interested in performing a qualitative analysis from the answers to open questions of this experiment. For this purpose, we plan to use the Grounded Theory Method [8]. We think this qualitative analysis will be useful to better understand the causes of the results that we obtained in this experiment. Then we will be able to propose specific improvements in the user interface generation process of OO-Method/OLIVANOVA.
[10] International Organization for Standardization. ISO 9241-11: Ergonomic requirements for office work with visual display terminals (VDTs) – Part 9: Guidance on usability, 1998.
8. ACKNOWLEDGMENTS
[13] J. R. Lewis. IBM computer usability satisfaction questionnaires: psychometric evaluation and instructions for use. Int. J. Hum.-Comput. Interact., 7(1):57–78, 1995.
This work has been developed with the support of MICINN under the project SESAMO TIN2007-62894 and co-financed with ERDF, ITEA2 Call 3 UsiXML project under reference 20080026, MITYC under the project MyMobileWeb TSI-020301-2009-014, and GVA under grant BFPI/2008/209. The authors would also like to thank Ignacio Panach and Sergio España for collaborating as observers in the experiment, Liney Manjarrés for her helpful advices on statistical analysis, and especially all experiment participants.
9. REFERENCES [1] S. Abrahão, E. Iborra, and J. Vanderdonckt. Usability Evaluation of User Interfaces Generated with a Model-Driven Architecture Tool. In E. Law, E. Hvannberg, and G. Cockton, editors, Maturing Usability: Quality in Software, Interaction and Value, volume 10 of HCI Series, pages 3–32. Springer, London, 2008. [2] V. R. Basili, G. Caldiera, and H. D. Rombach. The Goal Question Metric Approach. In Encyclopedia of Software Engineering. John Wiley, 1994. [3] N. Bevan. International standards for HCI and usability. Int. J. Hum.-Comput. Stud., 55(4):533–552, 2001. [4] R. D. Bock. Multivariate Statistical Methods in Behavioural Research. McGraw-Hil, New York, 1975. [5] C. Chesta, F. Paternò, and C. Santoro. Methods and Tools for Designing and Developing Usable Multi-Platform Interactive Applications. PsychNology Journal 2, 1:123–139, 2004. [6] J. Eisenstein, J. Vanderdonckt, and A. Puerta. Applying model-based techniques to the development of UIs for mobile computers. In IUI '01: Proceedings of the 6th International Conference on Intelligent User Interfaces, pages 69–76. ACM Press, New York, NY, USA, January 14-17, 2001. [7] N. E. Fenton and S. L. Pfleeger. Software Metrics: A Rigorous and Practical Approach. PWS Publishing Co., Boston, MA, USA, 1998. [8] B. Glaser and A. Strauss. The Discovery of Grounded Theory: Strategies for Qualitative Research. Aldine Transaction, 1967. [9] J. Helms, K. Luyten, J. Vermeulen, M. Abrams, and J. Vanderdonckt. Human-Centered Engineering with the User Interface Markup Language. In A. Seffah, J. Vanderdonckt, and M. Desmarais, editors, Human-Centered Software Engineering, volume 7 of HCI Series, pages 141–173. Springer, London, 2009.
[11] International Organization for Standardization. ISO/IEC 9126-1:2001 Software engineering – Product quality – Part 1: Quality model, 2001. [12] R. E. Kirk. Experimental design: procedures for the behavioural sciences. Brooks/Cole, Pacific Grove, Calif., 2nd edition, 1982.
[14] R. Likert. A technique for the measurement of attitudes. Archives of Psychology, 22(140):1–55, 1932. [15] Q. Limbourg, J. Vanderdonckt, B. Michotte, L. Bouillon, and V. López-Jaquero. USIXML: A Language Supporting Multi-path Development of User Interfaces. In R. Bastide, P. A. Palanque, and J. Roth, editors, Proc. of 9th IFIP Working Conference on Engineering for Human-Computer Interaction jointly with 11th Int. Workshop on Design, Specification, and Verification of Interactive Systems, EHCI-DSVIS 2004 (Hamburg, July 11-13, 2004), volume 3425 of Lecture Notes in Computer Science, pages 200– 220. Springer-Verlag, Berlin, 2005. [16] B. MacKay, C. R. Watters, and J. Duffy. Web page transformation when switching devices. In Mobile Human-Computer Interaction - Mobile HCI 2004, 6th International Symposium, Glasgow, UK, September 13-16, 2004, volume 3160 of Lecture Notes in Computer Science, pages 228–239. Springer, 2004. [17] S. J. Mellor, S. Kendall, A. Uhl, and D. Weise. MDA Distilled: Principles of Model-Driven Architecture. Addison Wesley Longman Publishing Co., Inc., Redwood City, CA, USA, 2004. [18] P. J. Molina, S. Meliá, and O. Pastor. Just-UI : A User Interface Specification Model. In C. Kolski and J. Vanderdonckt, editors, Computer-Aided Design of User Interfaces III, Proc. of the 4th Int. Conf. on Computer-Aided Design of User Interfaces, CADUI 2002, (Valenciennes, France, May 15-17, 2002), pages 63– 74. Kluwer, 2002. [19] G. Mori, F. Paternò, and C. Santoro. Design and Development of Multidevice User Interfaces through Multiple Logical Descriptions. IEEE Trans. Software Eng., 30(8):507–520, 2004. [20] O. Pastor and J. C. Molina. Model-Driven Architecture in Practice: A Software Production Environment Based on Conceptual Modeling. Springer-Verlag New York, Inc., Secaucus, NJ, USA, 2007. [21] J. Vanderdonckt. Model-Driven Engineering of User Interfaces: Promises, Successes, and Failures. In S. Buraga and I. Juvina, editors, Proc. of 5th Annual Romanian Conf. on Human-Computer Interaction ROCHI'2008, (Iasi, 18-19 September 2008), pages 1–10. Matrix ROM, Bucarest, 2008. [22] C. Wohlin, P. Runeson, M. Host, M. C. Ohlsson, B. Regnell, and A. Wesslén. Experimentation in Software Engineering: An Introduction, volume 6 of International Series in Software Engineering. Springer, 2000.