Usability testing of interactive multimedia services Ebba Thora Hvannberg University of Iceland Hjardarhagi 2-6 IS-107 Reykjavik Iceland Telephone: (354) 525 4702
[email protected] Marta Kristin Larusdottir EJS ehf. Grensasvegi 10 IS-108 Reykjavik Iceland Telephone: (354) 563 3000
[email protected]
ABSTRACT Interactive mu ltimedia services, such as video-on-demand offered to the public at home need to be tested carefully for usability. The environment as well as users is heterogeneous and they use different input and output devices than with a personal computer. User Interface designers need to learn more about the users, their environment and the hindrances they encounter. Two service trials were conducted where thirty families had access to video-on-demand, news-on-demand and worldwide web services for three months. The users had access to the services via a set-top-box connected to a television or via a personal computer. The paper describes how three methods: logging, thinking-aloud and questionnaires were applied as well as their results. Finally, the experiences from using the methods are discussed.
Keywords Usability tests, interactive services, multimedia, home, high-speed network, thinkingaloud, access logs, interviews.
1.
INTRODUCTION
Two user trials of multimedia interactive services over a high-speed network to residential users were carried out in the AMUSE (Advanced Multimedia Services for Residential Users) project (AMUSE Final report, 1998). Ten homes participated in the first trial 1997 and twenty homes in the second trial 1998. In the first trial all users
NordiCHI 2000
were equipped with a set-top-box that was connected to a TV and linked to a high-speed network. The user controls the set-top-box with a remote control and/or an infrared keyboard. In the second trial half the users had a set-top-box and the other half received a network card and a video playing card that was installed in their own personal computers. The clients were connected to a central video server via a high-speed network. Each trial
lasted three months. The services that were offered were video-on-demand, news-on-demand and web browsing. Before, during and after the trials usability tests were carried out.
2.3
Media Usage
On average, people watched television 2.4 hours a day. Two families rented video several times a week, 4 several times a month, 2 seldom and 3 never.
In this paper we will describe the methodology that was used, our experience from the tests and the results. The results of the first trial are covered in individual sections on each of the services. A summary of the results of the second trial is given in a separate section.
Icelandic TV stations
2 privately owned through subscription, one public
During development of the services we used heuristic evaluation for the user interface. Several service experiments were carried out during the trial. Usage data through logging was collected. Each home was interviewed twice, once in the beginning of the trial, and once in the end. The users were observed while using the interactive services for one hour and asked to think aloud while doing so.
International TV stations from Europe mostly
By subscription via microwave CNN, NBC, SKY, TNT, MTV, Eurosport, Cartoon Network, BBC prime
Radio stations
2 public, 5 privately owned
Movie theatres
Many
Video rentals
Many
News papers
3
Cable TV
NO
Internet
25% of households have access to Internet
The second section of the paper describes the demography of the users and the media landscape in Iceland. The third one sets the goals of the tests and describes the methodology that we used. Subsequent sections are devoted to the results of the usability testing of the services offered. The seventh section summarises the results of the second trial. In the eighth section we summarise our experiences and discuss how it can benefit others.
Table 1: Media context
2.4
2.
CONTEXT
In order to describe the context of the first trial, we present the demography of the users and the media that was offered in Iceland, at the time of the experiment. The population of Reykjavik, the capital district of Iceland, is around 150.000. Table 1 shows the media available for the users. The users of the trials were selected based on age, media usage, PC and Internet usage. The demography of the users in the first trial was as follows: 2.1
Demography of Participants
The average age was 37, 7 men and 6 women. Average family size was 2.5. We asked one member of each family to participate in the usability tests but of course other family members were free to use the services. 2.2
Computer and Internet Usage
Seven families had a computer at home and three did not. Four families had connections to Internet.
NordiCHI 2000
Content of Interest
When asked what type of content people were interested in, news got most points, movies and TV series next and documentaries were put in the third place. 2.5
Expected Usage
When asked about expected usage, video-on-demand landed in first place, followed by news-on-demand and WWW browsing had least expected popularity. Seven persons expected to use the available services much, 2 average and 1 expected little usage. 2.6
Expectations
All users had high expectations for interactive television regarding accessibility, new information, and ease of use. Most thought it would be good for society and it would be easy to watch commercials. Half of the users interviewed thought on-demand services would be expensive in a commercial situation and the information provided would be complete.
3.
TESTING METHODOLOGIES
As with any usability testing we needed to decide what type of tests were most appropriate for this context and the questions we wanted the trial to answer. We have already described the context, and we were mainly looking for answers to the following questions: ?? How much will participants use the interactive services? ?? Will users appreciate the interactivity of the services, e.g. the ability to select individual news segments and to select their own movies? ?? How successful are users in carrying out the tasks of interactive services, such as browse the WWW or select a movie? Will it be easy for them to navigate the interface? ?? Input: Since the set-top-box with its remote keyboard or a remote control is a new type of input device, we wanted to see if users had trouble using it. ?? Output: Does the output have sufficient quality i.e. What is the video quality of the movie? Is the text on web pages big enough? ?? Do the users like the content offered, i.e. the selection of movies or news programmes? What characterises the users' environment is that users are at home using new types of services with new types of input devices and in some cases a form of output that they had not used before. The home environment is also heterogeneous: e.g. some have small televisions other larger and users watch the television from different distances which may affect their perception of the user interface. In order to answer the above questions, we decided to use three methods: access logs, questionnaires and the thinking-aloud method. Furthermore, heuristic evaluation was used at the design stage of the user interface to improve the user interface before delivery. (Nielsen, 1994) We decided to collect access logs to understand the usage. We designed the access logs according to the capabilities of the video server. We knew beforehand that it is not a marketing trial and therefore were not able to use the results as a basis for whether the services would be profitable. Access logs were retrieved from the
NordiCHI 2000
video server and the WWW proxy server and HTTP server. Users were interviewed before the trial to hear about their expectations and after the trial to gather their experiences and to see whether they were willing to pay for the services. The interviews were in a form of questionnaires. We designed the questionnaires to answer questions about people's media usage, their experiences, what type of content they had liked or missed. The third method we applied was the thinking-aloud method (Gomoll, 1990), i.e. we observed the user at home while he or she carried out predefined tasks. The users were asked to think aloud, that is say what they were thinking while performing the tasks. Meanwhile, usability problems were recorded. The observation was carefully designed, with tasks selected and piloted. A form was designed to record the problems. The total number of tasks was 15 for the three different services. The thinking-aloud method was done at the users' home and we spent about one hour in each home and scheduled the visits beforehand. One person placed the tasks and another one recorded the problems. The problems were classified into catastrophic, severe and cosmetic. Catastrophic means that the problem had so much impact on the user that he could not complete the task in a proper way nor had great difficulties in completing it. A problem was severe if it had so much influence on the user that he got irritated, and the time to complete the task was much longer than expected. When the problem was cosmetic it had only minor influence on the user. Before the trials we invited the participants to a meeting where we explained the services. There was no other training except a brief overview when the equipment was installed. We gave the participants a handbook and a problem sheet to record comments or errors. No one used it to record problems. We also had a help-line through telephone and e-mail, but it was not used much. The next three sections describe the results of the usability tests for each of the services. The sections are organised around the description of the service, and results from the first trial: its recorded usage, the observed usability problems, the results of the questionnaires and finally there is a brief discussion on the findings.
Usage
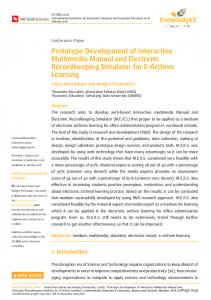
The video-on-demand service was the most popular one. In figure 2 we see the average daily watching of movies in hours and minutes. The homes are numbered STB1, STB2 etc. The numbers do not tell us how many movies are watched. However, if we assume that people watch whole movies and not small segments of movies, we see that on average 2 families watch almost 1 movie per day, 5 watch 1 to 3 movies a week and 3 almost don’t watch. The people living in home number 1 were on holiday for most of the period.
Figure 2: Average daily usage – video-on-demand
Usability
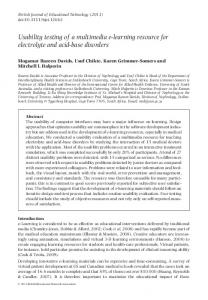
Most of the users found the service easy to use and most of the problems were related to long response time during navigation and selection. We also noted the importance of having as few screens as possible. For example, users would like to have seen the detail information about a movie on the same screen as the selected title. Additionally users had difficulty in finding the rating of the movie. For the 10 users we observed, we found 30 usability problems when doing the tasks for the video-on-demand service. Some of those also apply to other services but most are focused on this particular service. Seven of the usability problems were catastrophic, thirteen were severe and ten were cosmetic. Some of the catastrophic errors were really software functionality errors and should have been detected in the functionality-testing phase. Others were catastrophic because the set-top-box froze and had to be restarted. 4.4
Figure 1: Screen from video-on-demand
STB9
STB id.
4.3 4.2
1:30:00 1:15:00 1:00:00 0:45:00 0:30:00 0:15:00 0:00:00
STB7
In the video-on-demand application, users were able to select a movie to watch, pause the playback, continue and stop (see Figure 1). A user could select a movie by title, select all movies of an actor, or select a movie from one of the categories drama, action, children, comedy and erotic. Since only twenty movies were available at any time, two new movies were replaced every day. The user could select a movie from the recently added movies list. When selecting a movie by title or an actor, the user could select it by the first letter in the title and received all titles starting with that letter. Various type of information about the movie was accessible, such as rating, category, length, actors and reviews.
STB5
Application
STB3
daily usage
STB1
4.1
VIDEO-ON-DEMAND Daily usage of Movie [h:m:s]
4.
Questionnaire
During the interviews, all users said that it was easy to learn how to use the service. All except one would pay for the service. During the interview, we received seven comments on the video-on-demand service. The comments indicate that users select simple ways to select a movie, they complain that the interface is too complex that the quality of the picture is not adequate, and that movies are not correctly registered into the database. Most users said that the quality of the video picture was adequate or good, but a few said it was poor. Most people found that the audio was good and most users
NordiCHI 2000
did not see any glitches while the movie was playing. This was valuable for us to hear, since during the testing phase in the laboratory, we had problems with glitches in the movie stream. 4.5
Discussion
The usage of the service was good. By observing the user we received far more comments than by interviewing them. We also noticed usability problems regarding the mouse and problems with offering users the combination of a keyboard and a handheld infrared. Our conclusion is that using the thinking-aloud method gives valuable results especially when there are unforeseen problems in a new environment.
5. 5.1
NEWS-ON-DEMAND Application
News was available from two TV channels. It was recorded and encoded every evening. While encoding the news programmes to MPEG (Moving Picture Expert Group) format, a person marked the beginning and end of every news segment, and noted its title. This information was then loaded into a relational database along with the video itself. This process took one to one and a half hours. Each news programme is in the database for three days and then removed. The user had access to individual news segments, according to date and TV channel. She could also select the news overview that comes at the beginning of every news programme (see Figure 3) The news segments appeared in the user interface with its title. News was also categorised into sport, weather, domestic news, international news and culture.
5.2
Usage
The news-on-demand service was used the least. During 41 days of logging during the first trial, the ten families only watched news for a total of 30 minutes. This amounts to 4,5 seconds per home per day. It is not fair to compare these numbers to the video playing time since the duration of each news segment is very short or one and a half minutes.
5.3
Usability
The usability problems with news-on-demand can be summarised as: ?? Navigation between news segments was slow. ?? Difficulties in navigating between days. Users did not find the icon for it understandable. ?? The user interface had a special category with the overview of the news programme and users often selected that one when asked to watch the first news segment. We see that it was not correct to model the interface according to the current model of news programmes, i.e. into titles of headlines and news segments. It should be organised around the most recent news segment added to the database. Furthermore, news segments should be presented with icons of categories, pictures or text and not text titles. Some users said that the user interface was too complex. There were 39 usability problems recorded: catastrophic, 19 severe and 12 cosmetic problems. 5.4
8
Questionnaire
The users said that they liked the news-on-demand service the least. This is reflected in their answer to the question of paying for the service. Only one third of the users are willing to pay for the service. We were curious to know if users liked the categorisation of news segments. A third of the users liked it. 5.5
Figure 3: Screen from the news -on-demand
NordiCHI 2000
Discussion
According to users' expectations at the beginning of the first trial, they seemed interested in receiving itemised news, so we were a little surprised by the low usage. There are several explanations for this. First, the response time was rather slow. Second, the news was put on the server too late, i.e. in general one and a half to two hours after the completion of the broadcast. Third some people indicated to us that they did not want this
much interactivity and they preferred a simpler user interface. Finally, we think that the service has to come from a newsroom, where for example the main news is highlighted as it is done in a newspaper. A simple list of news items is uninteresting.
6. 6.1
WORLD WIDE WEB BROWSING Application
The service is a World Wide Web browser. The manufacturer of the set-top-box provided a browser. This browser had all the regular browsing functions. 6.2
Usage
The WWW usage in the first trial amounted to 11,5 minutes per day per user. This is about one third of the time users spent on video-on-demand which is a clear winner for the first trial. 6.3
Usability
The set-top-box users that had previous experience with a PC preferred to use WWW browsing on the PC platform. The main usability problems with the WWW on the set-top-box were related to small graphics, i.e. icons etc. We were able to control the size of the fonts, which was convenient. In the browser, the user had the option of scrolling the picture vertically or horizontally. Users complained about not having the whole page on the screen and that the function of scrolling vertically was not very visible. Users had to read the help to find out which keyboard or remote button to press. Finally, the performance, i.e. the update and the display of the browser was too slow. The tasks we selected for the WWW observation included visiting a news room, using a search engine and going to a Danish travel web-site to find a restaurant in Copenhagen and visiting the Icelandic Symphony Orchestra. Since web pages have a variety of functionality, it is more difficult to find representative tasks. Since our goal was mainly to find out how suitable it is to use the web on a set-top-box, we were not concerned with the usability of the web pages. We noticed problems with using the search engine, hyperlinks, and web-paths (URLs or Universal Resource Locators). We also noticed that when asking users to go to the Icelandic Symphony Orchestra to find some music piece, they sometimes tried to go to the video-ondemand service and not the web.
NordiCHI 2000
29 usability problems were recorded while observing the users doing the WWW tasks: 6 of the problems were catastrophic, 18 were severe, and 5 were cosmetic. During the trial, we offered e-mail services through hotmail but almost none of the users took advantage of this. As with the WWW browsing it is likely that the users that were already using e-mail preferred to continue to do so at their PCs. The e-mail service was probably too complex for those that had not been introduced to the concept before. Some reported though that they tried it but no one used it regularly. 6.4
Questionnaire
Around 60% of the users said they were willing to pay for the WWW services, so they liked the service that much. 6.5
Discussion
Users that are familiar with using the WWW on a PC continue to prefer that platform. For the set-top-box users, it is more difficult to use the WWW. We noted however, that some users with no PC experience found it an exciting addition. The advantage of the set-top-box is that once you have started the box, all the services are very accessible, i.e. the user does not have the notion of having to start some program and they don't associate it with a computer. The tasks we had included for observation of the WWW service included using a search engine and going to Danish travel web-site to find a restaurant. It was more difficult to find representative tasks for this application than the others. Moreover, since we didn't design the web pages, we were more interested in finding out in general how the users like the web on a set-top-box rather than his/her view of individual pages.
7.
SECOND TRIAL
The second trial took place in 1998. Twenty homes were selected, ten equipped with a set-top-box and ten families had their PCs equipped with a MPEG playing card and a high-speed ADSL network connection. In the second trial, we measured the average video watching to be 35 minutes per day per user. This is comparable to the first trial when the average video watching was 38 minutes per day per user. Video was almost twice as popular with the set-top-box users than with the PC users. This was expected because it is not considered pleasant for movie watchers to sit in front of a monitor to watch a movie and also because the quality
and the response time was much better on the set-topbox than on the personal computer. The set-top-box users think that content is what matters the most and then response time. PC users however put response time first and then content. Both groups of users put the same order on the rest of the attributes: 3) quality of the picture, 4) ease of use and 5) functionality. During the second trial, news was more popular or almost 2 minutes/day/set-top-box. There was considerably less interest with the PC users or only one fifth of this playing time. WWW browsing was more popular during the second trial than in the first trial. Browsing amounted to about 18 minutes/day/user. If we look at requests per day or the amount of data transmitted it is clear that the service is by far more popular amongst the PC users. The eleven PC users downloaded together nearly six times more data than the nine STB users. The PC users together made seven times more requests than the STB users. All of the PC said they found it easy to learn how to use the services. Whereas all the set-top-box users said that they found it easy to learn to use the news and video services, three PC users found it difficult to learn to use the WWW services.
8.
USEFULNESS OF METHODS
Observing the user in their real environment while using the services was very valuable and we found many problems. It is a good method to use in a new heterogeneous environment with new input and output devices. We learned how the users respond and realised how different users can be. It would have been good to observe the users sooner in the development process but then they are not in the real environment of course. We found that by visiting users in their homes and asking them to perform certain tasks gave the users the opportunity to explore and learn about the system. We felt that this was in general a positive experience for the users and also gave them a chance to ask questions about the system and view their opinions. Beforehand, we thought it would be difficult to observe real users totally unrelated to us, but most users were very willing to participate. Before the trial, users had agreed on taking part in the experiment and in return they get exciting new services. Of the 200 letters we sent out for the first trial, we received 30 positive responses, from which we selected ten homes. In our experience testers are often hesitant of finding real users, i.e. someone that is totally unrelated to them.
NordiCHI 2000
There is often a tendency to find a friend, a relative, a colleague or an expert representative of the user. We find that it is too common that people call on experts to test, e.g. a teacher for a student task or a meteorologist for the public who wants to see how the weather is tomorrow. Logging is necessary for any type of service. One has to be very careful though of the type of data to collect. You need to foresee the type of results the collected data will give you. We collected for example data on the day of the week the service was used. It was not very valuable to us but could be if you needed to monitor the network traffic in order to add more computing or network capacity for some days. Moreover, if you were charging for the services, you might want to have different rates for different days. The logs have to be carefully quality checked in order to see whether the log is continuous and whether it is producing correct data. Often the logging capabilities of the services are not adequate. We had hoped to log individual tasks to find out if the user selecting news by categories, or if he is selecting movies by authors, titles or simply the latest movie added to the video server. Adding more meaning to the logs can mean more expensive service development. Finally logs should be added directly or periodically to a database and processed in a data warehouse. The questionnaire was the method that was the most difficult one. In order to receive correct results, the questionnaire has to be placed while the users still have access to the service but not after it has terminated. In the second trial, we did not observe the user but only sent out the questionnaires at the end of the trial. The questions were on a closed form, e.g. yes/no or on a scale. With so few users, it is difficult to generalis e. It is also questionable how much this adds to the other two methods. Some questions, such as which service did you like the most, can be answered with logging. Others, like was it difficult to learn how to use the services are difficult to ask when the user has been using the services for three months. If she ever found it difficult to learn how to use the services, she is likely to have become an expert and have forgotten about the difficulties. Other questions are justifiable, such as questions about response time and content selection. Observing the user would have answered the question about the response time. The advantage of the questionnaire seems to be that they take less time. Of course people have to be reminded of returning them
and you will seldom get a one hundred percent return rate.
interviews and usability tests we found out that the users did not appreciate the interactivity of news on demand, but interactivity of video on demand was more appreciated. In both these cases the users wanted fewer screens to reach their goals.
The questionnaires can answer our questions on the user's attitude towards the services. They can also compare attributes such as cost, functionality and quality of picture. However, with this low number of users, it is difficult to generalise the findings. Logging gives us the usage pattern and the users' preference for the services. Logging is not capable of giving us a detailed view of the services. The thinking-aloud method is better suited for finding usability problems in the interface. The low number of participants is not a disadvantage since a problem found with even one user is one too many.
?? How successful are users in carrying out the tasks of interactive services? Will it be easy for them to navigate the interface? By observing the users doing tasks we saw that the users were fairly successful in carrying out tasks, though there was some serious usability problems in the user interface. The most serious usability problem was that the navigation was slow because of long response time.
The thinking-aloud method combined with logging can also be useful in similar environments such as a handheld telephone, palm pilot, or other devices. We think it would be worth while to develop logging capabilities further to have more meaning and to make the results more accessible in a data warehouse. Questionnaires should be done on-line, short and have a very clear goal.
?? Since the users have not experienced the input devices before and not used the TV as a computer screen, will the have any troubles? By interviewing the users and observin g them we found out that the users learned to use the input devices very quickly and did not report problems with the output, the quality of a video stream was good, and browsing the Web on a TV screen was fairly easy.
9.
CONCLUSION
When we started the experiments we did have some but not extensive experience with usability testing. The literature gives very good guidance on the basic methods. The design of individual tests is difficult in the beginning but improves with practical experience. In this paper we have described our experience of using three methodologies for testing usability of new interactive multimedia services: thinking-aloud, software logging and questionnaires. We have used the case study to evaluate the usefulness, weaknesses and strengths of the methods in this new environment. We have received answers to many of the questions that we set forth in section three. In the following there is a summary of the questions and answers we got in the first trial using all the usability methods. ?? How much will participants use the interactive services? Do the users like the content offered, i.e. the selection of movies or news programmes? By using logging we saw that the use is variable from home to home. Video on demand was the most popular one but news on demand was almost not used. ?? Will users appreciate the interactivity of the services? By combining results from logging,
NordiCHI 2000
In the second trial we used logging and mailed questionnaires to the users but there was not a personal contact with the users in that trial. Our experience was that is was hard to answer the question about the users success doing tasks and troubles about the input and output devices using these methods. Our conclusion is that a combination of two or three methods is valuable since each serves its purpose. The goal of the tests has to be clearly set forward in the beginning and the expectations of the results from each method. It is very important to select the methods carefully according to the questions posed, in order to answer the questions and so that the tests will not overlap.
REFERENCES AMUSE Final report, 1998, Final report for the AMUSE project. (available from the first author) Gomell, K., 1990, Some Techniques for Observing Users, in The Art of Human-Computer Interface Design, Edited by Brenda Laurel, Addison Wesley. Nielsen, J., 1994, Usability Engineering, Morgan Kaufmann publisher.
NordiCHI 2000