Testing the Usability of Interactive Maps in CommonGIS Natalia Andrienko, Gennady Andrienko, Hans Voss, Fatima Bernardo, Joana Hipolito, and Ursula Kretchmer ABSTRACT: The paper reports on an experimental study aimed at assessing the usability of five different interactive tools for exploratory analysis of geographically referenced data implemented in CommonGIS. Usability was assessed in terms of tool learnability, memorability, and user satisfaction. The study provided valuable data concerning the usability of each individual tool; we also derived some conclusions relevant to geovisualization techniques in general. We found that users were, in principle, able to understand and adopt the new ideas of map interactivity and manipulability. However, these ideas needed to be appropriately introduced; people could hardly grasp them just from the appearance of the maps and controls. An introductory demonstration was sufficient to understand the purposes of the interactive tools, and a short training session enabled people to use them. The importance of educating users is a particular challenge for geovisualization tools that are intended to be accessed over the Internet. KEYWORDS: Geographical visualization, interactive maps, usability engineering, usability evaluation, user studies.
H
Introduction
igh degree of user interactivity is a general requirement for maps designed to support “spatial thinking,” i.e., hypothesis generation, data analysis, and decision making (MacEachren 1994; MacEachren and Kraak 1997). Recently, a number of software packages enabling user interaction with map displays have been created. Examples include: • A dynamic link between maps and other types of graphical displays through “brushing;” objects selected in one of the displays are simultaneously highlighted in all of them (MacDougall 1992; Symanzik et al. 1996; Dykes 1997); • Tools for changing, in real time, parameters of conventional cartographic methods, such as Natalia Andrienko, Gennady Andrienko, and Hans Voss are members of the Spatial Decision Support Team, FhG AIS─Fraunhofer Institut Autonome Intelligente Systeme, Schloss Birlinghoven, Sankt-Augustin, D-53754 Germany. [http://www.ais.fraunhofer.de/ SPADE/]. E-mail: {natalia,gennady}
[email protected] aunhofer.de, tel +49-2241-142329, +49-2241-142486, fax +49-2241-142072. Fatima Bernardo and Joana Hipolito are at CNIG─Centro Nacional de Informação Geográfica, Lisbon, Portugal. Ursula Kretchmer is at FhG IGD─Fraunhofer Institut Graphische Datenverarbeitung, Darmstadt, Germany.
classes in a choropleth map (Egbert and Slocum 1992); • Various interactive devices for controlling map animation (e.g., Edsall and Peuquet 1997; Blok et al. 1999; Harrower et al. 2000; Slocum et al. 2000). Interactive techniques and tools can support information exploration and knowledge construction only when users are able to utilize these instruments properly. This problem is addressed in the research agenda of the ICA Commission on Visualization and Virtual Environments: “…users may find [new interactive techniques] difficult to apply, not derive the full benefit from them, or simply not utilize them if we do not consider various cognitive and usability issues” (Slocum et al. 2001, p.61). In particular, the Commission points to the necessity of evaluating methods via usability engineering principles. In this paper we report on the testing of interactive tools implemented in our geovisualization package CommonGIS. Our hope, however, was not only to assess particular tools of CommonGIS but also to derive more general conclusions concerning people’s understanding and adoption of interactive geovisualization techniques. More precisely, we wanted to check to what degree users are able to: • Understand the purposes of geovisualization tools and learn how to use them;
Cartography and Geographic Information Science, Vol. 29, No. 4, 2002, pp.325-342
• Retain the acquired skills after some period of not using them; and • Develop a liking for the tools rather than being afraid of them. We assumed that users would be quite able to master various tools for map manipulation but, possibly, only after receiving some training. Our study mostly confirmed these expectations.
Experimental Studies of Geovisualization Tools Literature on the use of modern geovisualization tools that include interactive and/or dynamic map displays is rather sparse. One of the earliest studies was Koussoulakou and Kraak’s (1992) experiment on the use of animated maps in comparison to static maps for analyzing spatio-temporal data. Koussoulakou and Kraak detected no major difference with respect to the users’ ability to retrieve correct information and perceive temporal trends. However, the response times for animated maps were significantly (over 50 percent) faster than those for static maps. Koussoulakou and Kraak envisioned that the advantages of animated maps over static ones would be even more apparent for data with higher temporal resolution than was used in the experiment. To keep their experiment simple, Koussoulakou and Kraak precluded user interaction with the maps. In contrast, Harrower et al. (2000) assessed interactive devices for controlling map animation. Specifically, they tested their implementation of the so-called “temporal focusing” and “temporal brushing” techniques (first suggested by Monmonier [1990]) in comparison to more traditional VCR-style buttons. The temporal focusing device was used to select time moments or intervals on a linear time scale, while the temporal brushing tool allowed choosing periods within the 24-hour daily cycle, thereby allowing the user to filter out diurnal fluctuations and look for longterm trends. Surprisingly, Harrower et al.’s experiment did not show any superiority of the focusing and brushing tools over traditional controls in supporting pattern and trend detection and promoting hypothesis generation. Many users (6 out of 17) did not understand how to use the temporal focusing tool. While 16 out of the 17 users understood the purpose of temporal brushing, very few of them actually used it for suppressing daily fluctuations in a task involving examining weekly trends. This shows that “understanding the pur-
326
pose of a tool and recognizing when it is useful to solve a problem are two quite different issues” (Harrower et al. 2000, p. 289). It is worth noting that the members of the focus group that helped in refining the user interface of the focusing and brushing tools before the main experiment were more successful in understanding and utilizing the tools than the participants. A plausible explanation is that focus group users could communicate with the experimenters and ask questions. Hence, positive results in a focus group do not guarantee tool usability, and “novel interfaces may not result in improved performance unless sufficient training is provided in how to use them” (Harrower et al. 2000, p. 292). In another experimental study, MacEachren et al. (1998) concurrently tested controls for map animation and other interactive tools for map manipulation, specifically, dynamic classification and dynamic focusing (the latter tool highlights on the map numeric attribute values from a userselected interval). They found that animationrelated controls were used much more actively and successfully than devices for focusing and classification. In our opinion, animation controls might be more user intuitive for two reasons. First, in map animation, real-world time is represented by display time, which is a natural and straightforward correspondence. Second, the animation control devices resembled the buttons of a traditional VCR and had similar functions. Hence, experience in using a VCR could help in mastering the animation tools, whereas no analogous skills existed for the other devices. Classification and focusing tools, however, have different degrees of novelty. Classification itself is familiar to users of traditional maps; only the possibility to change classes dynamically is unusual. In contrast, the focusing tool is novel both with respect to the user interface and the function. The same is true for many other geovisualization tools, such as the ones we developed in CommonGIS. The novelty of such tools requires substantial effort to ensure their usability. Let us now consider to what extent such efforts might be supported by the methods and guidelines of usability engineering (Nilsen 1993). Slocum et al. (2001) point out that “the focus of geovisualization on facilitating work related to illstructured problems may make it difficult to apply standard usability engineering principles” (p. 71). For example, one of the usability engineering practices is to observe potential users working with current software tools before starting design of new ones. In the case of geovisualization tools,
Cartography and Geographic Information Science
the value of such observation would be limited “because there is often no analogous situation using current tools to the kind of data exploration that dynamic geovisualization can enable” (Slocum et al. 2001, p. 68). Another usability engineering practice is involvement of representative users (e.g., focus groups) in the process of software development, so as to detect possible flaws at an early stage of development. In the study by Harrower et al. (2000), this method was ineffective: the successful tool use in a focus group did not translate into a successful tool use in the main test. While the tool developers deduced that users evidently needed more training, we think that even more important than training in using particular tools is general education in geovisualization that would help people more easily adopt new ideas of display dynamism, interactivity, and transformability. The need for education and training seems to contradict the idea of the “intuitive” user interface advocated by Norman (1988) and his followers, i.e., that any object (not only a software program) must be designed so that it does not require explanation as to its use. An often cited example is a door with a flat plate that allows only one activity, pushing, and thus does not require any “Push” sign. The situation with geovisualization tools is quite different due to their relative novelty and demand for unconventional skills. Users typically do not know what operations these tools enable (imagine an individual from Mars who never saw any door before and has no idea that a door can be opened). Even supposing that a tool is designed so that the way of operating it can be guessed from its appearance, this may not help in uncovering the purpose of the tool. Thus, our alien could find out that the door opens but still not guess that this property is used for entering a building. Moreover, even when a user has learned the purpose of a tool, she/he may still be unable to detect situations in which its application is appropriate; remember the observation made by Harrower et al. (2000) concerning the use of the temporal brushing tool. Analogously, it may not occur to our guest from Mars wanting to enter a building that it is necessary to look for a door. Not only do the standard principles and methods of usability engineering have limited applicability to the design of geovisualization tools, but so do the existing guidelines for conducting usability tests which require that “The test tasks should specify precisely what result the user is being asked to produce” (Nielsen 1993, p.185). When assessing the effectiveness of geovisualiza-
Vol. 29, No. 4
tion tools, however, “a clear specification of tasks (and sometimes of users) is often not possible due to the exploratory and interactive nature of geovisualization” (Slocum et al. 2000, p.71). We would like to point out one more difference between typical software usability tests and experiments in geovisualization. While a software developer tests a specific program, a geovisualization researcher often wishes to evaluate a certain technique in general, i.e., as a concept, irrespective of a particular implementation. For example, the objective of Koussoulakou and Kraak (1992) was to evaluate map animation in general rather than a particular software package supporting this technique. However, a “pure” concept cannot be tested for usability and effectiveness. In order to become testable, it needs to be implemented in a software tool, and a researcher will have to test this tool rather than the concept itself. Particulars of the implementation, such as the design of the user interface, performance characteristics, and occasional bugs, may have strong impact on test outcomes, which, therefore, must be interpreted cautiously. In general, positive results provide evidence in favor of the technique (and, in parallel, show that the implementation is good), but negative results do not necessarily imply its failure. In the latter case, it may be appropriate to repeat the test after debugging the software tool, improving its performance, and/or re-designing its user interface. Although for our tests we used particular tools from CommonGIS, our intention was to evaluate the concepts behind these tools and to observe how users might react to the novel ideas of map interactivity and manipulability.
Test Objectives and Organization The project CommonGIS ran from November 1998 till June 2001 and was partly funded by the European Commission (Esprit project N 28983). In the course of the project our system Descartes (Andrienko and Andrienko 1999) was re-implemented and extended and thus renamed to CommonGIS. Some details about the CommonGIS project are necessary to understand the objectives and organization of the test.
The CommonGIS project The project CommonGIS was guided by the motto “GIS for everyone.” Its objective was to devise approaches for making modern map-based exploratory tools accessible to a broad community
327
of potential users. Technically, this objective was attained using the Java technology that allowed users to access the tools over the web. However, tool accessibility also has a strong human component. In the project we strived to ensure that the tools offered could be effectively utilized even by users with little or no expertise in cartography, principles of graphical representation, and geographical information systems. One of the secondary goals was to understand how users could be taught to apply novel geovisualization techniques and be encouraged to use them in appropriate situations. Software development was accomplished in two stages. First, a prototype was created and tested for possible flaws in its general design and user interface. Then we developed the final version of the system, taking into account the results of prototype testing. Although the prototype already included some interactive geovisualization tools, specific tests of these tools took place only after the final version was ready, near the end of the project. This notwithstanding, feedback from users who tested the prototype geovisualization tools strongly influenced the objectives of a later study. Results relevant to our discussion in this paper are therefore summarized below. The prototype was evaluated by potential users and by software usability experts. Due to the focus on the overall system performance and user interface rather than on the geovisualization techniques themselves, these were not introduced to the test participants and there were no specific tasks for applying them. As a result, only a few users’ comments referred to the geovisualization tools. These comments demonstrated that users did not really understand the purposes of the tools and the ways of operating them. For example, some users suggested replacing dynamically changeable unclassed choropleth maps by more traditional choropleth maps with fixed classes. This showed that the advantages of maps without a priori classification, enhanced by the possibility to manipulate the representation, were not really understood and appreciated. The same applied to the technique of dynamic linking between a map and other types of displays (brushing). Based on this initial evaluation, we concluded that: • Users will not grasp the meaning of new interactive tools without previous introduction, and, consequently, cannot be expected to guess how to use them. • Users feel uncomfortable when encountering unfamiliar features with unclear purpose. They prefer that such features are excluded from the system.
328
• Users are accustomed to static maps and tend to adhere to traditional mapping principles. Probably, it has never occurred to them that a map can be interactively manipulated to facilitate data analysis. We did not consider these results as the grounds for stopping further development of interactive exploratory techniques; rather, we remained firmly convinced of their usefulness. If such techniques occurred to be too new for people and not intuitively understandable, then we had to look for appropriate ways of supporting, encouraging, and teaching users to apply them.
Objectives of the Final CommonGIS Usability Study We used the final version of CommonGIS to test the geovisualization tools we had implemented during the project. The tools were tested from three perspectives (Nielsen 1993, p. 26): • Learnability, i.e., ability of users to understand the purpose of the interactive tools and learn how to use them; • Memorability, i.e., ability of users to retain the acquired skills and utilize the tools after a time lapse; and • Satisfaction, i.e., whether people like to use the tools and are not afraid of them. These objectives seem to be rather modest in comparison to the goal of testing how geovisualization techniques facilitate hypothesis generation and knowledge construction. However, the results obtained in the prototype evaluation dictated the necessity of testing whether people were in principle able to master the novel tools, before trying to pursue more ambitious goals. Organizationally, the tool usability study differed from the prototype assessment in two aspects. First, participants were introduced to the system with a demonstration of its exploratory facilities and an explanation of its purposes. Then, instead of a free exploration of the system, users were given a set of specific tasks requiring them to apply the interactive tools. Five exploratory interactive techniques were selected for testing: outlier removal (focusing), visual comparison, dynamic classification, dynamic query, and dynamic linking between a map and other graphical displays (brushing). These techniques are briefly described below. More detailed descriptions can be found in Andrienko and Andrienko (1999).
Cartography and Geographic Information Science
Interactive Techniques Tested in the Study Outlier Removal Very often, a data set contains a few very high or very low values of a numeric attribute, while the rest of the values are relatively close to each other. In statistics, such values are called outliers. For example, birth rates in Europe lie between 10.56 and 15.93 births per 10,000 people, with the exception of Albania, which has a rate of 21.70. In maps as well as other graphical displays, the presence of outliers can make differences between mainstream values hard to perceive. For example, on an unclassed choropleth map representing the birth rates by proportional degrees of darkness (the higher the value, the darker the color), Albania will be dark while all other countries will have approximately similar coloring (Figure 1, left). When outliers are removed from the view, the display represents a shorter value interval, and the differences among the mainstream values can be made more apparent (cf. Figure 1, right). Visual Comparison Sometimes in choropleth maps (both classed and unclassed), a double-sided, or diverging, color scale is used in order to visually differentiate attribute values above and below a certain reference value, or midpoint (Brewer 1994). Attribute values are represented by shades of two different colors, for example, brown and blue. Normally, a special light color represents values exactly equal to the reference value. CommonGIS allows the user to interactively change the reference value and immediately reflects the changes on the map. Since the map actually represents differences between attribute values associated with spatial objects and the reference value, this interactive operation is called “visual comparison.” Figure 2 demonstrates how a particular country of Europe can be visually compared with all the other countries. A user just needs to click on a given country in the map, and the corresponding attribute value becomes the reference value. Countries with higher attribute values are represented in brown, and those with lower values in blue. Dynamic Classification A widely used method for cartographic representation of a numeric attribute is the classed choropleth map. The range of attribute values, from minimum to maximum, is divided into intervals, and the intervals are assigned different colors. Geographical objects (areas) are rendered in these
Vol. 29, No. 4
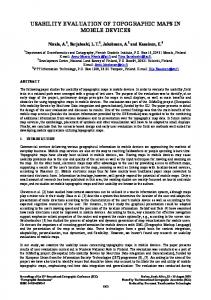
colors, depending on which intervals their attribute values fit in. When users have an opportunity to interactively change the intervals, classification turns from a pure presentation tool into an instrument for exploratory data analysis (Egbert and Slocum 1992; Andrienko and Andrienko 2001). In CommonGIS, one can dynamically manipulate classes and immediately observe the impact on visual grouping of objects on the map. Dynamic Query The dynamic query technique (Ahlberg et al. 1992) is designed for searching objects with particular characteristics in a graphical display. The user specifies the value intervals for those attributes she/ he is interested in. In response, objects with values lying outside these intervals are removed from the presentation; only objects satisfying the constraints remain. The technique is characterized by providing direct manipulation controls for changing constraints and by an immediate reaction of all displays to such changes. Besides locating objects with specific characteristics, dynamic query linked to a map display may be used to investigate spatial variation of characteristics. Figure 3 shows the dynamic query tool in CommonGIS. The user can set constraints on the values of numeric attributes by moving the triangular delimiters or by entering the lower and/or upper limits in the edit fields on the left and on the right, respectively. The dot plots show statistical distributions of attribute values: each circle represents a particular object. After constraining the values of a given attribute, the user can observe what values of the other attributes remain after filtering. These values are shown in dark gray on the dot plots while the dots for excluded objects become light gray (see the bottom part of Figure 3). As a result, correlations between attributes may be exposed. Figure 3 thus shows how the removal of low values of the attribute “% population without primary school education” also removes the low values of “% population above 65 years old” and “% people employed in agriculture,” as well as the high values of “% people employed in industry.” The conclusion one might draw from this is that high percentages of population without primary school education co-occur with high proportions of people aged 65 years and over, high employment in agriculture, and low employment in industry. Dynamic Linking In addition to maps, CommonGIS can also represent data in other display types. All displays are
329
Figure 1. Effect of outlier removal. Due to a very high birth rate in Albania, all other countries in the map on the left seem to be colored almost uniformly. When Albania is “removed”, differences between the other countries can be represented more distinctly.
Figure 2. Visual comparison technique. On the left, the birth rate in Germany is chosen as reference. Countries with higher values are painted in shades of brown, and countries with lower values in shades of blue. On the right, the reference value has been changed to equal the birth rate in France. In CommonGIS this is achieved by a mere mouse click on France. dynamically linked: pointing with the mouse at an object in a display highlights the graphical elements corresponding to this object (district boundary in a map, dot in a dot plot or a scatter plot, line in a parallel coordinate plot) simultaneously in all displays. CommonGIS supports two kinds of highlighting: transient and durable. Transient (“mouse-over”) highlighting occurs when the mouse cursor is positioned over an object and is
330
switched off immediately after the mouse is moved aside. Durable highlighting occurs when objects are selected by clicking or dragging the mouse, and lasts until the user explicitly cancels it. We chose to use a scatterplot display to test the dynamic linking technique. The function of the dynamic link (durable highlighting) between a map and a scatterplot is illustrated in Figure 4.
Cartography and Geographic Information Science
A)
B)
Figure 3. Screenshot A shows the initial state of the “Dynamic query” tool with four selected attributes. In B, a user has moved the upper left slider to the right and thereby set a query constraint: values of “% population without primary school education” must not be lower than 40 percent. The dots representing the districts that do not satisfy this constraint have become light gray for all attributes.
Test Tasks The tasks in the test were organized into five series, each dedicated to one of the techniques selected for testing. A typical task was to perform a certain operation with an interactive tool, for example, to remove the upper outlier from the presentation on an unclassed choropleth map, using the focusing tool. Each task was followed by one or more questions concerning the outcome of the operation. For example, the question following the task of removing the upper outlier was, “What value is now represented by the darkest shade?” Each task group began with one or two overview tasks aimed at checking whether users understood the data representation method applied in the map and/or in the accompanying graphical displays. The questions used in the test were either closed (i.e., the user selected one or more correct responses from a list) or required a response in the form of a single number retrieved from the display. Users were also allowed to reply, “Don’t know.” We developed a special extension of CommonGIS that executed an externally provided test specification. The tasks and questions were loaded into the system’s memory and consecutively displayed on the computer screen in a special window, and the responses were automatically recorded. Separation of the test specification from the program code made
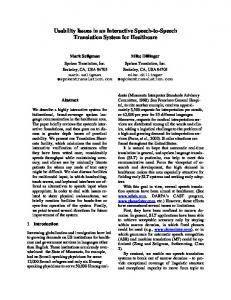
Figure 4. A scatterplot linked to a map. A user has selected a group of objects in the scatter plot by drawing a rectangular frame with the mouse (left). As a result, all objects from the group are marked on the scatter plot (center) and on the map (right).
Vol. 29, No. 4
331
it possible to modify test tasks without changing the program. This feature allowed us to create a variant of the test specification with all texts in Portuguese for participants from Portugal. At the beginning of each task series, users were asked to read a short description of the tested technique, which was accompanied by an animated image showing a possible sequence of operations. During the test, the system automatically generated all necessary thematic maps and other displays. The maps and graphs were built on the basis of Portuguese census data for the years 1981 and 1991. A variety of tasks was included in each task series so as to test all possible tool uses foreseen by the tool designers. Each series included tasks referring to at least two reading levels (Bertin 1983): elementary and overall. Here are some examples. Example 1 (visual comparison tool, elementary reading level) Task: Click on the district Moura on the map. The corresponding attribute value will become the reference value in the visual comparison tool. Question: how many of the districts surrounding Moura have higher values of the attribute than in Moura?
Example 2 (outlier removal tool, overall reading level)
Task: after removing the outliers from the map, consider the spatial variation of attribute values. Question: where can you observe a cluster of districts with high values of the attribute? • In the center • In the north-west, near the border • In the south-east • In the south, along the coast Some tasks required users to detect certain spatial patterns on the map. In such cases task formulations were supplemented with pictures showing the patterns to look for (Figure 5). At the end of each task series, a subjective evaluation of the tested tools was performed based on the following four questions: 1. Whether it was easy or difficult to carry out the tasks in the series; 2. Whether users felt frustration or comfort when using the tool; 3. Whether users felt their performance was fast or slow; and 4. Whether the tool appeared visually appealing. To answer each question, one could choose one of four possible positions on a “semantic differential scale” (Nielsen 1993, pp. 35-36), involving two opposites: very difficult vs. very easy, completely frustrated vs. completely comfortable, very slow vs.
332
very fast, and very unappealing vs. very appealing.
Organization of the Test The test was carried out in three rounds. The first and the second rounds were performed on-site at CNIG (Centro Nacional de Informação Geográfica, Lisbon, Portugal) using a local installation of the system, while the third round was conducted over the Internet. The first round took place in March 2001, with the participation of nine users. Prior to the test, the participants were introduced to CommonGIS and were given a demonstration of the tools to be tested. The presentation took about 30 minutes. The participants did not practice using the tools before starting the test. One month later we conducted the second round of the test. The purpose was to check tool memorability, i.e., whether first-round participants were able to maintain the knowledge and skills acquired with regard to the interactive techniques and re-apply them after a certain time period. Participants had no access to the system and no means to refresh their knowledge during the one month that had elapsed. Unfortunately, only six of the original nine persons were able to participate in the second round. The third round (Internet-based tests) took place in May 2001 and involved more than 200 participants. The purpose was to test whether people accessing CommonGIS on the web were able to master its interactive exploratory facilities without getting an introductory presentation. The participants of the first two rounds were employees of CNIG who received permission to take part in the test during their working time. They were native Portuguese with good knowledge of English. Seven of the nine participants were female and two male, ranging in age from 25 to 38 years. Three of the participants were developers of GIS applications, three environmental engineers, one programmer, one student in technical informatics, and one public administrator. All were proficient in using computers and the Internet. In the user profile questionnaire, participants were asked about their experience in searching and analyzing geographic information and/or statistical data. Five participants estimated that they spent more than 10 hours per month on such activities, three gave an estimation of 2-10 hours per month, and one had no such experience. Seven participants characterized themselves as professional users of geographic information, one as a non-professional casual user, and one as a non-user. In the
Cartography and Geographic Information Science
first two rounds, all test tasks and questions as well as possible answers were provided in Portuguese. The user interface of the system was in English. The third-round participants were computer science students from the Technical University of Darmstadt and geoinformatics students from the University of Münster. Most of them were native Germans. This time the tasks and questions were in English. We did not anticipate major language problems because university students in Germany typically have good knowledge of English. During the Internet-based tests we encountered some unexpected problems. About 450 files with users’ answers were recorded, but among them there were only 73 complete session records as most of the files contained only a few answers or no answers at all. Apparently, many students quit the test immediately after entering or answering only a few questions. We had no contact with the test participants, and could therefore not find out what had happened. There were also many files containing from one to four completed task series as if the participants had split the test session in two or three parts. In many cases it was possible to merge the files into complete test sessions including all five series (usually when a participant re-entered the test from the same computer after a short break). In this way we recovered 29 additional complete session records, bringing up the total to 102 complete test records, of which 11 were produced by computer science students and 91 by geoinformatics students. After removing files without answers or with less than one complete task series, we acquired additional 104 files containing from 1 to 4 complete series. We designed 57 tasks and 71 control questions for the first round. However, we noticed that this workload was too much for the participants, and so, in the second round, we reduced the number of tasks to 38 and the number of questions to 44, preserving the variety of tasks regarding the reading levels and the intended purposes of the tools, but removing similar tasks and decreasing the number of questions after each task. The same reduced set of tasks and questions was used in the third round. The data and maps were the same in all three rounds.
Test Results and Analysis On-site Testing in Lisbon, Round 1 From the individual test records obtained in the first round we calculated error rates per participant
Vol. 29, No. 4
and task series (test unit), that is, the percentage of incorrectly answered or unanswered questions. Figure 6 depicts the individual error rates as well as the mean error rate in each unit and the variance across participants. The dynamic query unit was by far the most problematic. The mean error rate in this unit was 28.2 percent, much higher than in the other units. The next highest error rate was 12.5 percent, which pertained to the task series testing dynamic classification. The remaining units had approximately equal error rates ─ 8.9, 8.9, and 9.25 percent ─ which we interpret as positive results. The higher error rates for the dynamic classification and dynamic query units can be explained, as noted before, by failures inherent in the techniques as well as by implementation flaws. For instance, we noticed a user interface flaw in the dynamic classification tool: participants had to switch from the “Manipulate” tab to the “Legend” tab in the map window (see Figure 5) any time they wanted to see the number of objects in each class. Not only was this constant window switching rather inconvenient, but some participants did not realize that they had to do it or learned how to do it. We also noticed that the control for manipulating the color scale used for representing classes on the map was too small and thus hard to operate. There were other reasons for the poor performance with the dynamic query tool, which became evident after the test. Some participants complained that particular questions had unclear or confusing formulations, and we saw later from the session records that many users gave wrong answers to these questions. We found that some of the problems were caused by inadequate or confusing references to places in Portugal. For example, the phrase “western coast” had a different meaning for the participants (who were residents of Portugal) than for us, which was not taken into account while translating the task from English into Portuguese. In another task we referred to areas around the cities of Porto and Lisbon, but the city names were not visible on the map. Although it might be expected that Portuguese residents would know the locations of Lisbon and Porto, it was evidently inappropriate to rely on such assumptions. Needless to say, we corrected all the unclear and confusing formulations that had been detected in the first round before embarking on the second round. Another observation we made was that participants made generally fewer errors in questions at the elementary reading level than in those at the intermediate or overall reading level. The logical
333
Figure 5. A task using the visual comparison tool for observing spatial patterns. The user is asked at what reference value a particular spatial cluster emerges on the map. explanation, of course, is that intermediate- or overall-level tasks are, in general, more difficult than elementary tasks. The extremely high error rate in the dynamic query unit cannot be explained solely by the presence of unclear questions or a high proportion of complex tasks. Let us then consider this unit in more detail. We expected the dynamic query tool to support three types of tasks: • Search for objects with particular properties (expressed as values of attributes); • Investigate the spatial distribution of values of an attribute; and • Detect possible correlations between attributes. While the unit included tasks of all three types, most errors occurred in the investigative and detection tasks, hence the tool can be judged as suitable for at least the search tasks. Unfortunately, there was only one investigative question the one mentioned above about the areas around Porto and Lisbon. The errors for this question might be due to the absence of city names on the map;
334
hence, the results we obtained did not allow us to draw definite conclusions about the suitability of the dynamic query tool for pattern exploration. In comparison, the unit included three questions on detecting correlations between attributes, each producing many errors (6, 6, and 5). This provides evidence that the tool (at least in its current form) is unsuitable for this type of a task. Besides the error rates, which allowed us to assess tool learnability, we also analyzed the results of the subjective evaluation of the tools. Table 1 shows that the degree of user satisfaction generally corresponds to user performance. In particular, the dynamic query tool that produced the highest error rate was evaluated as “difficult” (mean 1.89 points of maximum 4). Surprising is the relatively low satisfaction with the dynamic linking technique, due probably to participant tiredness at the end of the test. All the techniques were rated as rather appealing (3.11 to 3.67 points of possible 4). This is a good result since visual attractiveness contributes to tool usability.
Cartography and Geographic Information Science
obtained in the second round are shown in Figure 7. The results of the second round were better than in the first round, which was borne out by decreased mean error rates for all test units. In the task series testing the dynamic linking technique, no errors were made. In the visual comparison unit not only did the mean error rate decrease considerably (from 8.9 to 1.67 percent), but also the standard deviation was much lower (from 9.42 to 4.08 percent). In our opinion, the main reason for the improved performance is that participants learned how to operate the tools during the first round and were able to maintain the skills acquired. The improvement can also be partially explained by the clearer formulations of the questions that caused problems in the first round. The dramatic drop of the number of errors in the last task series, the dynamic linking unit, might partially be attributed to the decreased overall number of questions: participants were not so tired when implementing this task group Figure 6. Results of the first round of the test. The upper chart represents as they were in the first round. The individual results for persons P1 to P9. Bar heights are proportional to the results of the second round convincpercentages of incorrect responses by participant and unit. The lower chart ingly demonstrated good memorabilsummarizes the results by units. The horizontal marks show the mean error ity of the tool usage. Eleven questions in the second rates while the vertical lines, with lengths equal to two standard deviations, represent the variance among the individual results. The units are arranged round produced errors. In 10 out of the 11 questions there was only in order of increasing error rates. one error per question. One question—about the use of the dynamic Round 2 and Comparison with Round 1 query tool to detect correlations— resulted in three wrong answers. As many as 50 percent of the As already mentioned, round two was conducted participants made errors in this question, comwith corrected question formulations, and the pared 66.7 percent in the first round. Note, hownumber of tasks and questions was reduced withever, that in the reduced variant of the test we left out decreasing their variety. The maps and data only one of the initial three such questions, which were the same as in the first round. The results Mean subjective evaluation (from 1 to 4 points) Units
Mean error rate (%)
Visual comparison Dynamic linking
Difficult/ Easy
Frustrated/ Comfortable
Slow/ Fast
Unappealing/ Appealing
Total (max.16)
8.89
3.56
8.89
2.67
3.56
3.11
3.56
13.78
2.67
2.67
3.11
11.11
Outlier removal
9.25
3.33
3.56
3.11
3.67
13.67
Dynamic classification
12.50
2.56
3.00
2.44
3.44
11.44
Dynamic query
28.20
1.89
2.33
2.11
3.11
9.44
Table 1. Comparison of user performance in Round 1 to their subjective evaluation.
Vol. 29, No. 4
335
can partially explain the considerable drop in the relative number of errors in this unit. Table 2 compares subjectively evaluated performance in the second round with that in round one. Unfortunately, a syntax error was made in the subjective evaluation questionnaire translated into Portuguese for dynamic linking and the questionnaire was not presented to the participants. In parallel with the increased performance, the degree of user satisfaction with the dynamic classification and dynamic query tools also increased in round two. This notwithstanding, the dynamic query technique was judged to be the most difficult. The rating of the outlier removal technique was somewhat lower than in the first round, mostly due to the relatively low mark on the slow/fast scale. The reason may be that in the second round, all participants used the same computer that was rather slow. In general, all round two participants liked the system and provided favorable comments concerning its features. Some participants expressed a wish to use the system in their professional Figure 7. Individual and summarized error rates in the second round. The activities. However, some participants order of the units has been preserved from Figure 6. also noted that the system was rather demanding with regard to computer students were not given any introductory lecture resources and characterized this as a serious drawor demonstration. They could only rely upon the back. illustrated explanations that could be studied at the beginning of each task series. Round 3 (Internet Testing) The overall performance in the Internet-based As mentioned before, the third round of the test testing was much worse than in the first two involved German university students who accessed rounds, as can be seen from Figure 8 which presCommonGIS via the Internet. The maps and data ents results summarized from 102 complete seswere the same as in the first two rounds. The tasks sions. An inclusion in the analysis of additional and questions were identical to those in the second 104 incomplete test sessions did not significantly round but they were formulated in English. The change the average error rates (see Table 3). Mean subjective evaluation (from 1 to 4 points) Units
Mean error rate ( %)
Visual comparison
Difficult/ Easy
Frustrated/ Comfortable
Slow/ Fast
Unappealing/ Appealing
Total (max.16)
1.67%
3.50
3.50
3.00
3.50
13.50
Dynamic linking
0%
*
*
*
*
*
Outlier removal
2.78%
3.33
3.50
2.50
3.33
12.67
Dyn classification
8.33%
3.00
3.17
3.00
3.50
12.67
Dynamic query
12.96%
2.50
3.00
3.00
3.00
11.50
Table 2. Comparison of user performance in Round 2 to their subjective evaluation. 336
Cartography and Geographic Information Science
dynamic linking tools well enough without an introductory demonstration, from which we concluded that these tools were easier to understand and use than those for outlier removal, dynamic classification, and dynamic query. This notwithstanding, the overall results obtained in the Internet-based testing were much poorer in comparison with on-site testing. We see several reasons for this: 1. Unlike in the on-site testing, the participants in the Internet testing were not given a presentation of the tools. The written explanations, evidently, did not adequately substitute for the introductory lecture. Besides, many participants did not read the explanations at all or did not read them diligently enough. We know this because the testing software recorded the time spent viewing the explanations, i.e., the intervals between opening an explanation page and the next action. The data obtained about reading explanations are analyzed in more detail further below. Figure 8. Statistical summary of the results of the Internet-based testing 2. The students, in general, were (complete sessions). The upper chart represents the mean error rates less experienced in the analysis of (horizontal marks) and variance (vertical lines). The lower chart shows the geographic information compared to minimum and maximum error rates in each unit as well as the 25 percent percentile, median, and 75 percent percentile. The units are arranged in the the professionals who took part in the first two rounds. This especially refers order used in the test sequence. to the computer science students from Darmstadt. Indeed, these students had The results of the Internet-based testing were notably higher error rates than the characterized by very high individual differences geoinformatics students from the University of among the participants. Standard deviations were Münster (the exact data will be presented later). much higher than in the first two rounds. The 3. Most of the students were requested by their error rates varied in four out of the five units from professors to test the tools during their classes. 0 to 100 percent and in one unit from 0 to 90 It is probable that some students were not really percent. The degree of subjective satisfaction also interested in participating in the test and, therevaried greatly and, as in the first two rounds, corfore, not sufficiently motivated to learn the tools related with performance. and achieve satisfactory results. The lower chart in Figure 8 shows that the task 4. All the explanations and task formulations as series dealing with visual comparison and dynamic well as the user interface of CommonGIS were in linking tools produced quite different results than English while the students were native Germans. the other test units. In the visual comparison unit, Although German university students, in gen25 percent of the participants did not make any eral, have rather good knowledge of English, errors and 50 percent had error rates below 20 this probably does not apply to the particular percent. In the dynamic linking unit, 25 percent terminology used in the test. In fact, many stuof the participants had error rates below 9 perdents complained in their comments about difcent and 50 percent gave no more than 18 perficulties in understanding the explanations and cent wrong answers. Thus, at least half of the test task formulations and wished to repeat the test participants mastered the visual comparison and after it has been translated into German. Vol. 29, No. 4
337
Unit
Complete sessions (102) Number and % of Errors Absolute Relative (%)
Number of Answers
Number of Answers
All Sessions (206) Number and % of Errors Absolute Relative (%)
Outlier removal
612
255
41.67
989
406
41.05
Visual comparison
1020
258
25.29
1631
423
25.94
Dynamic classification
816
305
37.38
1230
478
38.86
Dynamic query
918
485
52.83
1279
665
51.99
Dynamic linking
1122
339
30.21
1438
439
30.53
Table 3. Mean error rates in the Internet-based testing.
Not opened
Outlier removal
Mean time spent viewing the explanations (sec) 112
Visual comparison
143
12
18
23
49
Dynamic classification
101
14
25
22
41
Dynamic query
85
16
36
18
32
Dynamic linking
117
15
31
17
39
Unit
23
Number of participants Viewed for Viewed for 1 to less than 1 min below 2 min 25 24
Viewed for 2 min and more 30
Table 4. Utilization of explanations by Round 3 participants. Let us now consider in more detail the data obtained in the third round and the differences observed between the two student groups. The data concerning the explanations are summarized in Table 4. It should be noted that, on average, the least amount of time was spent viewing the explanation concerning the dynamic query tool, which appeared to be the most difficult for the test participants. The explanation about visual comparison seems to have been read more diligently than the others, and this corresponds to the better results obtained with this tool test in the second round. We examined in more detail the data in order to determine how participants’ performance related to reading the explanations. First, we plotted for each task unit the time individual participants spent reading the explanations, against the relative number of errors made. The resulting plots did not show any clear patterns. Although it seemed that participants who did not open the explanation pages or opened them for a very short time tended to make more errors, we saw no obvious link between reading time and performance (that is, longer reading times did not necessarily correspond to better results). We tried to analyze the data in a different way, hypothesizing that reading an explanation is, in itself, a more important fact than the total time elapsed between opening an explanation page and starting the test. The problem was that we could not check how this time interval was actually used. We estimated the minimum time needed for opening an explanation 338
page and reading its content to be about 90 seconds and, accordingly, divided the test records for each task group into two classes: viewing the explanation for less than 90 seconds and viewing it for 90 seconds or more. Then we calculated mean error rates as well as medians and quartiles for each class. The resulting statistics are presented in Table 5. The table shows that participants who spent at least 90 seconds reading the explanations in the visual comparison and dynamic linking units performed, in general, considerably better than the others. A somewhat smaller difference can be observed for the dynamic classification unit, while in the outlier removal unit, the two groups of participants were almost equal. It seems that providing an explanation about the use of a particular exploratory tool may be ineffective if this is done before users get acquainted with the system as a whole. It was also observed that in the “problematic” dynamic query unit, those users who spent more time reading the explanations made even more errors than those who spent less time. While analyzing these data, we detected the existence of several different behavioral patterns. The 102 students who had completed the test sessions could be divided into the following subgroups: A) Users who read all the explanations (34 persons). B) Users who did not read any of the explanations (11 persons). These people, apparently, either had no interest in the tools tested or relied on their previous experience with other software. Cartography and Geographic Information Science
Error rate Unit
Outlier removal
Visual comparison
Dynamic classification
Dynamic query
Dynamic linking
Statistics
Total
Explanation Viewed for less than 90 sec
Explanation Viewed for 90 sec or more
N of participants
102
55
47
25% percentile
16.67
16.67
16.67
Median
50.00
50.00
33.33
75% percentile
66.67
66.67
58.33
Mean
41.67
43.33
39.72
N of participants
102
40
62
25% percentile
0.00
10.00
0.00
Median
20.00
30.00
10.00
75% percentile
40.00
50.00
20.00
Mean
25.29
34.00
19.68
N of participants
102
48
54
25% percentile
12.50
25.00
12.50
Median
37.50
37.50
31.25
75% percentile
50.00
56.25
50.00
Mean
37.38
41.15
34.03
N of participants
102
62
40
25% percentile
22.22
22.22
22.22
Median
44.44
44.44
50.00
75% percentile
77.78
77.78
77.78
Mean
52.83
52.51
53.33
N of participants
102
59
43
25% percentile
9.09
18.18
9.09
Median
18.18
36.36
18.18
75% percentile
45.45
50.00
27.27
Mean
30.21
37.13
20.72
Table 5. Use of explanations vs. error rates. C) Users who did not read the instructions for the first one or two task series but started reading them later (17 persons). There are at least two possible explanations for this behavior. The users may not initially have been interested but then became more engaged in the process of testing. The users might also initially have believed that it would be easy for them to do the test tasks and later understood that they needed instructions. Unfortunately, we did not have an opportunity to ask the students for actual explanations of their behavior. D) Users who read explanations in the first one or two task units but then stopped reading them (6 persons). Probably, the test occurred to be too difficult or uninteresting for these people and, as a result, they were frustrated or tired and lost their initial motivation.
Vol. 29, No. 4
E) Users with inconsistent behavior patterns (34 persons): some explanations were read and some not, without any clear tendency. Not surprisingly, the performance of the diligent students (i.e., subgroup A) was better than average. The performance of those who did not read any explanations was much worse than average in the first two task units, while in units three and four it was close to average, and in unit five it was much better than average. It seems that subgroup B included people who preferred “learning by doing,” and by the end of the test eventually mastered the system. The results of subgroup C were very close to those of subgroup A: in task units two, four, and five the error rates were only slightly higher than for subgroup A, and in units one and three they were even lower. The notably better performance in unit one seems rather
339
Figure 9. Graphical representation of the mean and median error rates in two groups of students. The students in geoinformatics (Münster) performed notably better, especially in the units on dynamic linking and outlier removal. strange, considering that subgroup C did not read the corresponding instruction. The performance of subgroup D was better than average in the first unit and then fell below average. The results of subgroup E were characterized by extremely high variance. The mean error rates in this subgroup were higher in all task units than the average rates for the whole group of 102 students. We think that the information about different behaviors with respect to reading instructions may be interesting for developers of electronic tutorials and educational courses, and it might be helpful in adapting educational tools to different learning styles. Let us now see how performance in the tests relates to the level of knowledge in geography and experience in reading maps and analyzing geographical information. It is reasonable to assume that the students of geographical informatics have better knowledge and skills in this area than the students of computer science. Figure 9 compares the results of the two student groups. The graph shows that, although the order of task units according to error rates was the same for both groups of students, the dynamic linking technique was much easier to comprehend for the geoinformatics students than for the computer science students. The geoinformatics students were also more successful in mastering the outlier removal technique. As in the first two rounds, the most difficult in the third round was the dynamic query tool. The outlier removal tool was more difficult (in relation to the other units) for the students than for the 340
participants of the first two rounds. A probable reason is that the outlier removal task unit was first in the test, and, when working on it, the students became acquainted with the system. However, this was not the case for the participants of the first two rounds who received an introductory system presentation. One may argue that it would be appropriate to randomize the order in which the task units were presented to the participants, but this would not make much sense in the first two rounds where the number of participants was rather small. For the Internet-based testing, which was planned later, we decided to preserve the order of the task units so as to enable easy comparison with on-site test results.
Conclusions We tested five interactive geovisualization tools implemented in CommonGIS for learnability, memorability, and user satisfaction. Our intention was to evaluate both the tools, with their implementation specifics, and the underlying ideas (that is, the geovisualization techniques as they had been devised). We were fully aware that the ideas could only be tested by testing the tools, and we hoped that the results obtained for the tools could be translated into more general conclusions concerning the techniques. The findings can be summarized as follows. First, we obtained valuable information concerning the usability of each individual tool implemented in CommonGIS. The results of testing the visual comparison and dynamic linking (brushing) tools Cartography and Geographic Information Science
can be regarded as positive: all users who saw the tool demonstration and at least half of the users who accessed the tools over the Internet (and, hence, did not see the demonstration) were able to apply the tools successfully. Because we detected user interface flaws in the dynamic classification tool, this tool will need to be redesigned and tested again. While the results for the dynamic query tool could be judged as negative, those for the outlier removal tool were inconsistent: positive in the first two rounds and negative in the third round. It seems that once people are shown how to operate the tool, they are able to use it effectively. We suspect that the user interface of this tool could be improved, so that people who have no opportunity to see a demonstration would understand its purpose and method of operation. One of the reviewers of this paper suggested an interesting hypothesis concerning the outlier removal tool: “the ‘removal’ of data, in general, from a data set (even an ephemeral display) might be seen by users who have not been given ‘permission’ to do so as taboo, and thus a counterintuitive data manipulation method.” Second, we drew conclusions about the ideas behind some of the tools. Because the results of testing the visual comparison and dynamic linking tools may be judged as successful, one may conclude that the respective geovisualization techniques really support the exploratory tasks they were designed for. For the dynamic query technique, we found that it was inappropriate for revealing correlations between attributes but appeared to support search tasks and the detection of spatial patterns. It would be useful to further test this tool with more tasks requiring search and pattern detection. We could not draw definite conclusions for the outlier removal and dynamic classification techniques. Because we see some possibilities for improving the user interface of the tools implementing these techniques, further testing would be appropriate once the interface improvements have been completed. Third, we made some general observations relevant to all geovisualization techniques. We saw that users were, in principle, able to understand and willing to adopt the new ideas of map interactivity and manipulability. However, these ideas needed to be appropriately introduced; people could not learn them by examining the appearance of the maps and controls. As we saw from the first two rounds, an introductory demonstration may be sufficient to explain the purposes of interactive tools, and a short training session will teach people how to use the tools. It is important
Vol. 29, No. 4
that users like the tools and are not afraid of using them. In many situations no direct teaching is possible, for example, in the case of first-time users encountering tools on the web. Providing on-line help is necessary but not always effective because many users tend to skip instructions. Remember that some participants of the third round preferred “learning by doing” and were quite successful by the end of the test, while spending much time reading the instructions did not always result in better performance. Hence, researchers and developers need to look for appropriate additional ways of introducing novel concepts and techniques of geovisualization to the user community. Possibilities include interactive on-line tutorials or an intelligent (knowledge-based) component for guiding the users in the process of their own data exploration and problem solving (Andrienko and Andrienko 2002). The study demonstrated the importance of providing the user interface in the native language of the users. The same applies to all instructions and explanations, in particular, to on-line help. It should be noted that we tested the tools on small, precisely formulated tasks. The questions were closed or required a response in the form of a single number. Such questions are appropriate for usability tests and convenient for statistical analysis but they are insufficient for testing the capability of tools to facilitate hypothesis generation and knowledge construction—whereas it is this capability researchers in geovisualization are primarily interested in. To test the effectiveness of tools in knowledge construction, one needs to engage users in free data investigation, which is usually prompted by open-ended questions. However, before conducting such effectiveness tests, it is essential to make sure that users understand the purpose of the tools and can operate them. Hence, usability tests should normally precede effectiveness tests. We had no opportunity to perform effectiveness tests within the CommonGIS project but are greatly interested in further research in this direction. We would be happy to do this in collaboration with other interested researchers. A demo version of CommonGIS can be run from the URL http://www.ais.fhg.de/and/CommonGISApplet/ using a standard Java-enabled web browser. The system can also be downloaded from http:// www.CommonGIS.de/ for non-commercial use. ACKNOWLEDGMENTS The work done in the CommonGIS project was partly funded by the European Commission (Esprit project 28983, November 1998 - June
341
2001). We are grateful to all partners in the project for their collaboration. We would like to express our special thanks to all test participants and to Prof. Werner Kuhn and Dr. Sven Fuhrmann who organized the tool testing by students at IFGI University of Muenster Department of Geographical Informatics. We also thank the editor and the reviewers of the paper for helpful comments and suggestions for improvement. REFERENCES
Ahlberg, C., C. Williamson, and B. Shneiderman. 1992. Dynamic queries for information exploration: an implementation and evaluation. In: Proceedings ACM CHI’92 (ACM Press). pp. 619-26. Andrienko, G., and N.Andrienko. 1999. Interactive maps for visual data exploration. International Journal Geographical Information Science 13: 355-74. Andrienko, G., and N. Andrienko. 2001. Interactive cumulative curves as a tool for exploratory classification. In: D.B.Kidner, G.Higgs (eds), Proceedings of the 9th annual conference GIS Research in the UK. University of Glamorgan, U.K. pp.439-42. Andrienko, N., and G. Andrienko. 2002. Intelligent support for geographic data analysis and decision making in the Web. Journal of Geographic Information and Decision Analysis 5(2: 115-28. Bertin, J. 1983. Semiology of graphics:Diagrams, Networks, Maps. Madison, Wisconsin: The University of Wisconsin Press. Blok, C., B. Koebben, T. Cheng, and A. A. Kuterema. 1999. Visualization of relationships between spatial patterns in time by cartographic animation.Cartography and Geographic Information Science 26 (2): 139-50. Brewer, C.A. 1994. Colour use guidelines for mapping and visualization. In: Visualization in Modern Cartography. New York, New York: Elsevier Science Inc. pp.123-47. Dykes, J.A. 1997. Exploring spatial data representation with dynamic graphics. Computers & Geosciences 23(4): 345-70. Edsall R., and D. Peuquet. 1997. A graphical user interface for the integration of time into GIS. In: Proceedings of the 1997 American Congress of Surveying and Mapping Annual Convention and Exhibition, Seattle, Washington. pp.182-9. Egbert, S.L., and T. A. Slocum. 1992. EXPLOREMAP: An exploration system for choropleth maps. Annals of the Association of American Geographers 82(2): 275-88.
342
Harrower, M., A. M. MacEachren, and A. L. Griffin. 2000. Developing a geographic visualization tool to support Earth science learning. Cartography and Geographic Information Science 27(4): 279-93. Koussoulakou, A., and M. J. Kraak. 1992. Spatio-temporal maps and cartographic communication. The Cartographic Journal 29: 101-8. MacDougall, E.B. 1992. Exploratory analysis, dynamic statistical visualization, and geographic information systems. Cartography and Geographic Information Systems 19: 237-46. MacEachren, A.M. 1994. Visualization in modern cartography: Setting the agenda. In: Visualisation in modern cartography. New York, New York: Elsevier Science Inc. pp. 1-12. MacEachren, A.M., F. P. Boscoe, D. Haug, and L.W. Pickle. 1998. Geographic visualization: Designing manipulable maps for exploring temporally varying georeferenced statistics. In: Proceedings of the IEEE Symposium on Information Visualization (InfoVis’98), October 19-20, 1998, Research Triangle Park, North Carolina USA, IEEE Computer Society, Los Alamitos, California. pp. 87-94. MacEachren, A.M., and M.-J. Kraak. 1997. Exploratory cartographic visualization: Advancing the agenda. Computers and Geosciences 23: 335-44. Monmonier, M. 1990. Strategies for the visualization of geographic time-series data. Cartographica 27(1): 30-45. Nielsen, J. 1993. Usability engineering. Boston, Massachusetts: Academic Press, Inc. Norman, D.A. 1988. The psychology of everyday things. New York, New York: Basic Books. Slocum, T., C. Blok, B. Jiang, A. Koussoulakou, D. Montello, S. Fuhrmann, and N. Hedley. 2001. Cognitive and usability issues in geovisualization. Cartography and Geographic Information Science 28(1): 61-75. Slocum, T., S. Yoder, F. Kessler, and R. Sluter. 2000. MapTime: Software for exploring spatiotemporal data associated with point locations, Cartographica 37(1): 15-31. Symanzik, J., J. Majure, and D. Cook. 1996. Dynamic graphics in a GIS: A bidirectional link between ArcView 2.0 and Xgobi. Computing Science & Statistics 27: 299-303.
Cartography and Geographic Information Science