WSEAS TRANSACTIONS on COMPUTERS
Jitka Komarkova, Martin Jedlicka, Miloslav Hub
Usability User Testing of Selected Web-based GIS Applications JITKA KOMARKOVA, MARTIN JEDLICKA, MILOSLAV HUB Faculty of Economics and Administration, Institute of System Engineering and Informatics University of Pardubice Studentska 95, Pardubice, 532 10 CZECH REPUBLIC
[email protected],
[email protected],
[email protected] Abstract: - Web-based geographic information systems (WGIS) are focused on end-users who have only a very limited knowledge of GIS, if any. For this reason, WGIS applications have to be user-friendly. In the terms of a software quality, WGIS applications have to be usable. Lately, many various usability evaluation methods have been developed. Real users or their representatives are included in some of them. Other methods are based only on GIS experts’ evaluation of applications. Advantage of deploying real users or at least their representatives is clear – they are able to identify some usability problems which could not be identified by experts. The problem is that usability evaluation in a real situation done by real users is quite difficult. Experimental user usability testing done by representatives of users is the next possibility. In this case, artificial environment is prepared in a laboratory and the whole experiment must be precisely conducted and controlled. In all cases usability testing method must be precisely proposed and/or adapted for the given situation and conditions. Aim of the paper is to propose a suitable experimental method based on usability user testing to identify the most serious usability problems of 14 equal WGIS applications (all applications are run by the Czech Regional Authorities and they are targeted at citizens and other end users). The proposed method is qualitative, so its main aim is to identify the most serious usability problems of the evaluated applications. The proposed method, results of testing and identified problems are described in the end of the paper. Key-Words: - Usability, User Testing, Web-based GIS. Web-based applications are frequently used as a tool to allow remote and easy access of end users to information. Information is accessible by means of web browser which is installed on computer. Users are familiar with using web-browser so they do not need to learn how to use a new user interface when they want to use service provided by a special kind of IS, like GIS. There is an important problem connected to Webbased geographic information systems (WGIS) applications or more precisely to their users: wide diversity of users, it namely concerns their skills and equipment (more specifically hardware, software and Internet connection). Even users at the same level of digital literacy can still individually differ. Next problem is that in the case of WGIS application aimed at end users like citizens it is impossible to train these users. User interface must be intuitive. Users’ diversity and requirements must be respected in advance by design of an application. One of the possible ways how to improve design of application is to use usability evaluation methods during their development. On the other hand, a user-friendly environment may not be a sufficient condition to ensure participation of citizens in public deals. Danish project Public Participation GIS can be used as an example of a project targeted to all citizens but resulting in a participation of only very limited group of citizens (middle-age and
1 Introduction Today, it is quite difficult to make decision without knowledge of spatial information. In public administration, commercial companies and private life of people spatial information is very important for decisionmaking process. But specialized software tools for spatial information analyzing and utilization are quite complicated from the end-user point of view (desktop geographic information systems – GIS, can be used as an example of such a complicated software). Utilization of a paper form of spatial information (i.e. maps) can be too slow and complicated for some analytical operations. These were some of the reasons why information society has introduced a new idea – an easy and remote access to information for all citizens. It should increase participation of citizens in public life [20]. Participation of citizens in public deals belongs to the main ideas of democracy. But it is still impossible to let all members of a community participate in reaching all common decisions. It has been proved that in social groups which are larger than a village or a small town it is quite impractical let each particular citizen to co-decide on issues of public concern. However, with modern technology it is theoretically possible to at least allow all citizens to inform themselves about public issues and to participate on some public affairs [19].
ISSN: 1109-2750
21
Issue 1, Volume 9, January 2010
WSEAS TRANSACTIONS on COMPUTERS
Jitka Komarkova, Martin Jedlicka, Miloslav Hub
into several sub-characteristics. The ISO/IEC 9126 model defines the following set of quality characteristics and their sub-characteristics [9, 18]: • Functionality: suitability, accuracy, interoperability, security, functionality compliance. • Reliability: maturity, fault tolerance, recoverability, reliability compliance. • Usability: understandability, learnability, operability, attractiveness, usability compliance. • Efficiency: time behaviour, resource utilization, efficiency compliance. • Maintainability: analyzability, changeability, stability, testability, maintainability compliance. • Portability: adaptability, installability, coexistence, replaceability, portability compliance.
well-educam ted males with income above average in this case) [10]. The main objective of the paper is to propose a method how to evaluate usability of several similar webbased geographic information systems. The evaluated applications are used as a tool for easy and remote access of end-users to spatial information. Representatives of end-users will be included. Main objective of proposed usability evaluation method will be to evaluate ability of the applications to meet users’ needs.
2 Information Technology and Successfulness
Acceptance
Users have to regularly and long-lasting use information and communication technology otherwise it is meaningless and investments in it will not be returned. In according to some researchers [3, 26] it is important to deal with a continuance of IS because it is focused on a long-time intention of use, as against acceptance is a short-time initial step. Thus, many researches have dealt with acceptance of technologies by their users and successfulness of information technologies. A significant attention has been paid to user satisfaction, e.g. [2, 7, 13, 14]. Researchers have proposed several models which should help to predict system use by its users [6, 17, 21, 24, 27]. Technology acceptance model (TAM) was proposed in 1986. In according to TAM’s authors perceived usefulness and perceived ease of use belong to the most important factors influencing intention of users to use information system (IS) [21]. TAM has been tested and it has been extend several times, see e.g. [17, 24, 27]. Nowadays, system designers prefer to “make the design to fit the users” to the previous attempt: “make the user to fit the design” [22]. Definition of the “fitness for use” takes customer’s requirements and expectations into account – it involves whether the products or services fit both stated and implied user needs. The “fitness for use” belongs today to characteristics of a software quality. To help measuring software quality, several quality models have been proposed. Every specialist can even propose his/her own quality model which will satisfy the needs of the given situation [1, 8]. Quality model proposed by McCall et al in 1977 belongs to the first published models. The model was slightly criticised because of necessity of subjective measurements of some characteristics [8]. One quality model is standardized by ISO/IEC: ISO/IEC 9126 Information technology - Software Product Quality. Standard ISO/IEC 9126 defines a quality model which is applicable to every kind of software. The model uses six main software quality characteristics. Usability is one of them. Each quality characteristic is further sub-divided
ISSN: 1109-2750
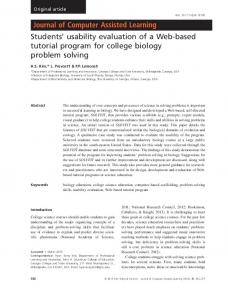
The ISO/IEC 9126 model set of quality characteristics and their sub-characteristics are more explained by Fig. 1. Requirements on software are represented by the circles, quality characteristics by the parts of hexagon.
Fig. 1 – Explanation of ISO/IEC 9126 quality model and quality characteristics used by this model [9]. Various usability evaluation methods have been used to improve usability of existing or newly designed systems [4, 11, 12, 22, 23, 28]. Each method has its advantages and disadvantages so it is necessary to select or propose an appropriate method for each case [4]. Automated data collection can improve usability evaluation [23]. Lately, higher demands are made on Web-based spatial decision support systems. They are expected to be
22
Issue 1, Volume 9, January 2010
WSEAS TRANSACTIONS on COMPUTERS
Jitka Komarkova, Martin Jedlicka, Miloslav Hub
usable, to provide enough functions and to provide a high performance. AJAX has become a very popular technology in this case [5]. A possible way of usability user testing of web-based GIS is proposed in this paper. Aim of the proposed method is to identify problems in usability of selected similar WGIS by means of usability user testing. All 14 WGIS applications run by all Czech Regional Authorities which are aimed at citizens, were tested by means of the proposed method to identify main usability problems. Comparison of applications was a minor aim. This study picks up the threads of previously done studies [11, 12, 15, 16]. The study is a part of on-going research which is aimed at proposal of efficient and effectiveness way of usability evaluation of WGIS followed by proposal of a usable user interface. The aim of evaluation is to evaluate quality and identify usability problems, not to run quantitative comparison of selected software applications.
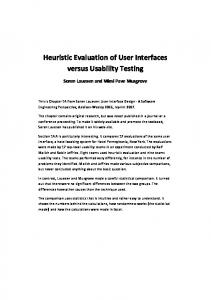
3 Case Study: Usability User Testing of Web-based GIS The main objective of the proposed usability evaluation method is to relatively fast evaluate usability of several similar web-based GIS applications by still a reasonable number of users to identify the most important problems in usability. In this case, applications can be understood as similar because they are aimed at the same target group of users, they are run by the same type of public administration authority (Regional Authorities in this case) and they should provide similar services to their users. Regional level of public administration is the second top-level of public administration. The Czech Republic consists of 14 regions. All public administration bodies have to provide remotely accessible information by the law. Although it is not a case of spatial information, they provide some spatial information by means of WGIS application. Provided applications are mostly focused on citizens, businesses and tourists. An example is in Fig. 2.
Fig. 2 – An example of evaluated application – Ustecky Region (source: authors) •
During usability evaluation, all the following webbased GIS applications of the Czech Regional Authorities were tested (URL is provided in the brackets) by each participant: • The Capitol Prague (http://wgp.urhmp.cz/) • Jihocesky Region (http://gis.kraj-jihocesky.cz/)
ISSN: 1109-2750
• •
23
Jihomoravsky Region (http://www.krjihomoravsky.cz/Default.aspx?PubID=22&Type ID=1) Karlovarsky Region (http://www.krkarlovarsky.cz/GIS) Region Vysocina (http://www.krvysocina.cz/gis.asp)
Issue 1, Volume 9, January 2010
WSEAS TRANSACTIONS on COMPUTERS
• • • • • • • • •
Jitka Komarkova, Martin Jedlicka, Miloslav Hub
•
Kralovehradecky Region (http://gis.krkralovehradecky.cz/) Liberecky Region (http://www.krajlbc.cz/index.php?page=1671) Moravskoslezsky Region (http://verejnasprava.kr-moravskoslezsky.cz/mapy.html) Olomoucky Region (http://mapy.krolomoucky.cz/) Pardubicky Region ( http://www.pardubickykraj.cz/index.asp?thema= 2679) Plzensky Region (http://www.krplzensky.cz/article.asp?sec=556) Stredocesky Region (http://mapy.krstredocesky.cz/) Ustecky Region (http://www.krustecky.cz/mapy.asp) Zlinsky Region (http://mapy.kr-zlinsky.cz/)
• • •
Evaluated applications are focused on end users, mostly citizens, tourists, students and businessmen. These people represent target group of users. Their computer literacy level, skills, knowledge, equipment (hardware and software) and speed of Internet connection can significantly vary and cannot be influenced by application designers and providers.
3.1 Used Methods and Tools
3.1.2 Participating Users
The whole usability evaluation procedure was done in the following steps: 1. At first, purpose and aims of the proposed test were defined 2. Aim of evaluated applications and target group of users of evaluated applications were identified 3. Characteristics of participants of testing were stated 4. An adequate method was chosen 5. Task list was prepared and verified 6. Test environment and equipment (laboratory) was prepared 7. Testing itself was done 8. Collected data were processed and final report was created
The next step was to select participating users. In this case they were randomly selected and divided into two groups in according to their skill in the GIS field: beginners and GIS users. In total, 10 participators took part in the experiment. Five of them were end users representatives without any GIS skills. The following five of them were users with a medium knowledge and skills in GIS field. Age of the participants was between 23 – 39 years. All the participants graduated from a secondary school, some of them were students or graduated from a university. Some other characteristics of participants are given in Table 1. Table 1 – Selected (source: authors)
The above listed steps are described in the following chapters in more detail.
Characteristics Computer literacy (utilization of PC)
3.1.1 Aim of Usability Evaluation, Target Group of Users and Participating Users General requirements on user interface of web-based GIS applications can be as follows [25]: visually balanced, enough contrast, typographically correct, readable, enough contrast, using familiar presentations, done in according to the target user group. Tools should be clearly presented and the interface should support and guide the user [25]. Both main general objective and purpose of the testing were described in Chapter 2. The following particular aims (hypotheses) were stated for the planned usability evaluation:
ISSN: 1109-2750
The main aim is to identify problems in usability of web-based GIS applications run by the Czech Regional Authorities and aimed at end users, e.g. citizens and tourists Testing is focused on qualitative results – the main aim of the testing is to identify problems in usability In total 14 similar web-based GIS applications must be evaluated by each participating user Different requirements of end users on one side and users with some GIS skills on the other side should be identifies – if there are any.
Frequency of utilization of paper maps Frequency of utilization of internet maps Preference – which maps they prefer to use
24
characteristics
of
participants
basic
Percentage share [%] 10
middle
30
very good
70
weekly
10
monthly
30
less then monthly
60
weekly
60
monthly
40
less then monthly
00
paper
20
internet
80
Possible choices
Issue 1, Volume 9, January 2010
WSEAS TRANSACTIONS on COMPUTERS
Jitka Komarkova, Martin Jedlicka, Miloslav Hub
16. Find out address of Regional Authority and centre map to this authority. 17. Randomly choose a small village in the region. Find out where is the registry office of this village. 18. In according to the territory plan find out a suitable place for building a small company in any village of the region. 19. Find out Trade Supervisory Office and Revenue Office of the village from the previous task. 20. You are a tourist who wants to go to a trip. You arrive by a train to the regional capital city. Find out the shortest path from railway station to the closest bikeway and find out number of the bikeway.
3.1.3 Used Method of Usability Evaluation, Task List and Testing Environment A classical experimental methodology – usability user testing, was used as main usability evaluation method. Specifically, think-aloud procedure was selected. It means participating users were required to speak loudly during the whole testing to describe what they were doing and to express their feelings and remark [22]. The whole testing was recorded by two cameras so it was possible to go through all records later and evaluate testing once more. One camera was recording directly face of the participant, the second one was recording both face of participant and monitor, i.e. work of participant (see Fig. 2 further in the text). After testing one web-based GIS application, participant was asked to state his overall impression from the application. Prior to the testing, preparation and verification of the task list which were later on given to the participants, was done. It meant that experts had to go through all 14 evaluated web-based GIS applications to test them and prepare tasks which could be solved by means of all applications. To ensure understandability of testing task list it was verified by two additional experts and two representatives of target users. The second result of expert’s going through all evaluated applications was the final choice of testing environment, i.e. choosing Internet Explorer. Some applications did not work in another web browser. Task list was proposed to allow evaluate both general control of application and usability from point of view selected groups of target users. Task list contained following tasks: 1. Display cities and villages of the region. 2. Find out help and find out contact to administrator of the application, then close help. 3. Is an overview map turned on? If no, turn it on. 4. Zoom in to the regional capital city 5. Is data layer containing towns and villages turned on? If no, turn it on. 6. What is the scale of map right now? 7. Set map scale to approx. 1 : 50 000. 8. Pan (move) to the most northern part of the regional capital city. 9. Choose a single object on the map and find out some additional information about it. 10. Choose randomly three villages to the north from the regional capital city and measure their distance. 11. How many layers does map legend contain now? 12. Print current map including its legend. 13. Zoom out to display the whole region. 14. Go back to previous scale and display. 15. What is the name of the currently displayed map?
ISSN: 1109-2750
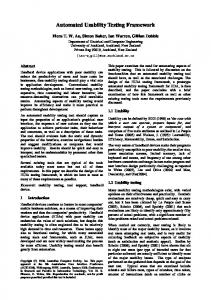
For each item of task list it was measured and recorded: • Percentage share of its fulfilment • Time needed to fulfil each item (each task) • Peaces of information which can influence usability evaluation. Users were not forced to finish tasks, they could give up when they were not able to finish task for any reason. Their comments if it was easy or not to do the tasks were much more important then time needed to finish tasks. One simple single-room testing environment (see Fig.3) was specially prepared and used for all experiments so all participants had the same conditions and equipment including Internet connection. Participants used PC (Intel Core 2 Duo E6750, 2048 MB RAM, ATI Technologies Inc. ATI Radeon HD 2400 Pro, LCD 19“ with resolution 1280x1024 and 32bit colours depth; Internet connection speed was 100 Mbit/s) with MS Windows XP Professional 5.01.2600, Service Pack 2 and Internet Explorer 7 version 7.0.5730.11.
Fig. 3 – Simple single-room testing environment (source: authors)
25
Issue 1, Volume 9, January 2010
WSEAS TRANSACTIONS on COMPUTERS
Jitka Komarkova, Martin Jedlicka, Miloslav Hub
Table 2 – Selected (source: authors)
All tests were conducted by the same test moderator who could interact with the participants. Participants were exploring and testing the applications; moderator was monitoring them, making notices and conducting final inquiry. All experiments were done within one week to minimize possible changes of tested web-based GIS applications. It meant, two users were testing applications per a day.
Region
Prague Jihocesky Jihomoravsky Karlovarsky Vysocina Kralove‐ hradecky Liberecky Moravsko‐ slezsky Olomoucky Pardubicky Plzensky Stredocesky Ustecky Zlinsky
3.1.4 Results of Usability User Testing All identified usability problems were classified into 3 main types: fatal (critical), serious and slight problems. There was a final list of found usability problems created for each evaluated web-based GIS application, table of overall impression and graphs showing successfulness and time needed to finish particular tasks. The last two outputs had rather an informative role. Statistical evaluation and comparison of web-based GIS applications was not aim of the experiment. These results are shown in Table 2. The best and the worst evaluated applications are shown in the following pictures – see Fig. 4 and 5. Some more results are shown further in Fig. 6, 7 and 8.
characteristics
Average time needed to finish task [min]
of
participants
Percentage share of tasks completion [%]
In total
End users
GIS users
In total
End GIS users users
11:35 13:32 12:41 18:39 15:55
12:27 15:17 12:21 18:22 15:40
10:43 11:47 13:00 18:56 16:10
50 39 43 52 64
47 37 37 48 61
54 42 50 57 68
14:02 13:08
14:09 12:30
13:55 13:46
74 84
69 80
79 87
12:38 12:57 15:35 14:54 18:59 15:37 14:27
11:43 13:16 15:59 14:41 19:58 16:49 16:01
13:34 12:39 15:10 15:06 18:00 14:26 12:52
77 48 76 81 64 46 75
74 49 70 75 60 38 68
80 48 83 88 68 54 82
Fig. 4 – The best evaluated application – Liberecky Region (source: authors)
ISSN: 1109-2750
26
Issue 1, Volume 9, January 2010
WSEAS TRANSACTIONS on COMPUTERS
Jitka Komarkova, Martin Jedlicka, Miloslav Hub
Fig. 5 – The worst evaluated application – Jihocesky Region (source: authors)
Fig. 6 – Rating of evaluated WGIS by end users (source: authors)
Fig. 7 – Rating of evaluated WGIS by GIS users (source: authors)
Fig. 8 – Rating of evaluated WGIS in total (source: authors)
ISSN: 1109-2750
27
Issue 1, Volume 9, January 2010
WSEAS TRANSACTIONS on COMPUTERS
Jitka Komarkova, Martin Jedlicka, Miloslav Hub
The main identified fatal usability problems were: • Necessity of Java installed on computer – found in 3 cases • Absence or to high complexity of search tools – only in less then 10 % cases users were able to successfully complete this task • Difficult orientation in the application which prevent users from finding special information, e.g. in territorial plans – in these tasks successfulness rate was less then 30 % • Distance measurement – absence (3 cases) or utilization of incorrect units (4 cases) prevented users from finishing the task
• • •
•
Several less serious problems were identified too. These problems made work of the participants more difficult but not impossible. Next interesting result is the following finding: end users more often use Internet applications like Google Maps which provide significantly different and simpler user interface. Web-based GIS applications of Regional Authorities should provide more services and information so they use more complicated user interface. Users were sometimes slightly confused and it took them some time to find correct way how to solve tasks. Results of this study can be partly compared with the results of another study [16]. In this case, a questionnaire was used as a usability evaluation method. Due to the method, it was possible to involve a higher number of evaluators. Evaluators tested only three applications: one was run by a regional authority, two were commercial ones. During evaluation, evaluators were required to fulfill given tasks and then to fill in a questionnaire. The whole process of evaluation of the applications was significantly shorter – approximately one hour. In this study, questions were mode detailed. They were based on comparison of the evaluated applications to find users’ preferences in a more detail. The most important findings are [16]: • Scroll bar menu should be used to allow users to switch between all available thematic applications (84.2 %) • Map legend was required by 82.4 % of evaluators. Legend belongs to the basic elements of a map so this element should be present in any case. • An overview map was required by 77 % of evaluators but there was no clear preference where to locate it • The most users (70.9 %) preferred an option to switch on/of all particular data layers to a limited selection between pre-defined maps without any possibility to choose particular data layers -
ISSN: 1109-2750
• •
probably the most interesting result of this evaluation In total, 66.7 % of evaluators would appreciate a possibility of precise specification of a map scale All available software tools should be placed in a toolbar on the top of the application window (63 %) Results of a search/query task should be located in the right side of the application window in the fixed size box (58.8 % of evaluators). The rest of evaluators preferred resizing of a map and appearing a new window with search results There were no clear preferences where to put scale bar – not a real surprise, scale bar does not seem to be a very important element of map use Search window should be located in the left upper corner of a viewport Concerning scale bar, users had no clear preferences
Probably the most important and interesting result was requirement of users to keep a certain control over an application by possibility of turning data layers of/on. This is a typical GIS approach which may not be easily understandable to end-users. Users do not know this approach from Google Maps and similar applications so they could find this approach as an interesting one. An overview map is another example of an application element which is not provided by Google Maps and similar applications bud users found it very useful. Costs of the used method should be taken into account too. Usability user testing with think aloud procedure belongs to more costly methods. In the case of the above described study, the costs of testing itself can be calculated as it follows: • Office rent: 5 (days) x 29.39 USD • Internet connection: 5 (days) x 11.76 USD • Test moderator’s wage: 11 (hours) x 5 (days) x 51.03 USD • Participating users’ wage: 10 (count of user) x 5 (hours) x 11.76 USD • Cost of hardware: 3 x 881.83 USD (2x computer, 1x notebook) • Webcam: 29.39 USD • Video camera: 293.94 USD • Food, Drink: 5 (days) x 14.69 USD The whole evaluation took 5 days, approximately 11 hours per day. Time of collected data processing is not included.
28
Issue 1, Volume 9, January 2010
WSEAS TRANSACTIONS on COMPUTERS
Jitka Komarkova, Martin Jedlicka, Miloslav Hub
[2] Bailey, J.E., Pearson, S.W. Development of a Tool for Measuring and Analyzing Computer User Satisfaction. Management Science, Vol. 29, No. 5, May 1983, pp. 530-545. [3] Bhattacherjee A., Perols, J., Sanford, C. Information Technology Continuance: A Theoretic Extension and Empirical Test. The Journal of Computer Information Systems, Vol. 49, Issue 1, Fall 2008, pp. 17-26. [4] Dhillon, B. S. Engineering Product Usability: A Review and Analysis Techniques. In WSEAS TRANSACTIONS on CIRCUITS and SYSTEMS. Issue 2, Volume 4, 2005. p. 86-94. [5] Chen, H., Zhang, X., Chi, T. An Architecture for Web-based DSS. In Proceedings of the 6th WSEAS Int. Conf. on Software Engineering, Parallel and Distributed Systems, Corfu Island, Greece, February 16-19, 2007, pp. 75–79. [6] Cheney, P.H., Mann, R.I., Amoroso, D.L. Organizational factors affecting the success of enduser computing, Journal of Information Systems, Vol. 3, Issue 1, 986, pp. 65–80. [7] Chin, J.P., Diehl, V.A., Norman, K.L. Development of an instrument measuring user satisfaction of the human-computer interface. In Proceedings of the SIGCHI conference on Human factors in computing systems, Los Angeles, California, USA, April 18 - 23,1988, pp. 213-218. [8] Côté, M.-A., Suryn, W., Georgiadou, E. In search for a widely applicable and accepted software quality model for software quality engineering. Software Quality Journal, 2007, vol. 15, no. 4, pp. 401-416. [9] Gross, H. Guidance for validation of software – Proposal [online]. [cit. 2009-05-29]. Available from: . [10] Hansen, H.S., Reinau, K.H. The Citizens in EParticipation. In M.A. Wimmer et al. (Eds.): EGOV 2006, LNCS, Vol. 4084. Springer-Verlag, Berlin Heidelberg New York, 2006, pp. 70-82. [11] Hub, M., Valenta, Z., Víšek, O. Heuristic Evaluation of Geoweb. E+M Economics and Management, Vol. 10, Issue 2, 2008, pp. 137-131. [12] Hub, M., Zatloukal, M. Fuzzy usability evaluation of Information systems in Public administration. In Proceedings of the 10th WSEAS International Conference on. MATHEMATICAL METHODS, COMPUTATIONAL TECHNIQUES and INTELLIGENT SYSTEMS (MAMECTIS '08),Corfu, Greece, October 26-28, 2008, pp. 106-111. [13] Ivan, I., Boja, C., Visoiu, A., Doinea, M. Optimization of Distributed Software. In Proceedings of the 7th WSEAS Int. Conf. on SOFTWARE ENGINEERING, PARALLEL and DISTRIBUTED SYSTEMS (SEPADS
4 Conclusions and Future Work Main objective of the proposed method of usability user testing was to run qualitative evaluation of 14 similar web-based GIS applications aimed at end users, mostly citizens, tourists, businessmen and students. The main aim was of the testing was to identify problems in usability of the web-based GIS applications of all Czech Regional Authorities. In the Czech Republic, there are 14 Regional Authorities in total. All their WGIS applications were tested by means of the proposed method. Several weighty usability problems were identified. In comparison to previously done studies [8, 12] it was realized that many of the evaluated applications have been improved. Unfortunately, the main usability problems sometimes resisted, e.g. necessity of Java being installed. It is impossible to statistically compare results of both experiments because the new method was proposed for this study and the main aim of both methods was only to identify usability problems. Anyway, it can be seen that evaluated applications very often belonged either to the better or worse half of applications in both experiments. A new finding is that end users are influenced by webbased GIS applications like Google Maps so they expect similar user interface. They experience some difficulties if interface is different. On the other side, some application elements which are not provided by Google Maps, were found interesting by evaluators, e.g. an overview map or turning particular data layers on/of. For the future, processing evaluation of results of all done experiments is planned. Several results of another evaluation method were discussed above. Proposal of a usable user interface in according to user preferences and needs identified by the experiments should be the final result. Newly designed user interface will be again evaluated from the usability’s point of view to verify its improved quality. Acknowledgments. The authors would like to thank the Grant Agency of the Czech Republic for funding this research project under the grants No. 402/09/0219 with title ‘Usability of software tools for support of decisionmaking during solving spatially oriented problems’ and 402/08/P202 with title ‘Usability Testing and Evaluation of Public Administration Information Systems’. References: [1] Azuma, M., Software products evaluation system: quality models, and processes – International Standards and Japanese Practice, Information & Software Technology, Vol. 38, No. 3, March 1996, pp. 145 – 154.
ISSN: 1109-2750
29
Issue 1, Volume 9, January 2010
WSEAS TRANSACTIONS on COMPUTERS
Jitka Komarkova, Martin Jedlicka, Miloslav Hub
field studies. Management Science, Vol. 46, No. 2, 2000, pp. 186–204. [26] Wang, S.C., Lii, I.S., Fang, K.T. Predicting the Continuance Usage of Information Systems: A Comparison of Three Alternative Models. WSEAS TRANSACTIONS on INFORMATION SCIENCE and APPLICATIONS, Vol. 6, Issue 2, pp. 301-318. [27] Yang, H.-H., Yu, J.-C., Yang, H.-J., Lin, H.-C. Developing a Model of Technology Behavior Intension on Strategic Web Resource. In Proceedings of the 10th WSEAS International Confenrence on APPLIED MATHEMATICS, Dallas, Texas, USA, November 1-3, 2006, pp. 7176. [28] Yeum, Y., Lee, W. Usability Issues of Web-Based Assessment System for K-12 and Implementation of PAS System, WSEAS TRANSACTIONS on ADVANCES in ENGINEERING EDUCATION. Issue 9, Volume 4, 2007. p. 173-179.
'08),University of Cambridge, UK, February 20-22, 2008, pp. 132-137. [14] Ives, B., Olson, M.H., Baroudi, J.J. The measurement of user information satisfaction. Communications of the ACM, Vol. 26, Issue 10, 1983, pp. 785-793. [15] Komarkova, J., et al. Usability of GeoWeb Sites: Case Study of Czech Regional Authorities Web Sites. In W. Abramowicz (ed.): BIS 2007, LNCS, Vol. 4439, Springer-Verlag, Berlin Heidelberg New York 2007, pp. 411-423. [16] Komarkova, J., Jakoubek, K., Hub, M. Usability Evaluation of Web-based GIS – Case Study. In Proceedings of iiWAS2009, ACM, Kuala Lumpur, Malaysia, December 14–16, 2009, pp 547-551, paper in print. [17] Legris P., Ingham, J., Collerette, P. Why do people use information technology? A critical review of the technology acceptance model, Information & Management, Vol. 40, No. 3, 2003, pp. 191–204. [18] Leung H., K., N., Quality metrics for intranet applications, Information & Management, Vol. 38, No. 3, 2001, pp. 137–152. [19] Macpherson, M. Citizen participation in politics and the new systems of communication [online]. [cit. 2009-05-21]. URL: . [20] MINISTERSTVO VNITRA ČESKÉ REPUBLIKY. Archív - e-Government [online]. c2005, [cit.2008-04-19]. Available in Czech only. (Ministry of Interior of the Czech Republic). URL: . [21] Ouadahi, J. A Qualitative Analysis of Factors Associated with User Acceptance and Rejection of a New Workplace Information System in the Public Sector: A Conceptual Model.Canadian Journal of Administrative Sciences, Vol. 25, No. 3, 2008, pp. 201-213. [22] Rubin, J., Chisnell, D. Handbook of Usability Testing: How to Plan, Design, and Conduct Effective Tests. Indianapolis, IN: John Wiley & Sons, 2008. [23] Tao Y. Automated Data Collection for Usability Evaluation in Early Stages of Application Development. In Proceedings of the 7th WSEAS Int. Conf. on APPLIED COMPUTER & APPLIED COMPUTATIONAL SCIENCE (ACACOS '08), Hangzhou, China, April 6-8, 2008, pp. 135-140. [24] Venkatesh, V., Davis, F.D. A theoretical extension of the technology acceptance model: four longitudinal field studies. Management Science, Vol. 46, No. 2, 2000, pp. 186–204. [25] Vozenilek, V. A theoretical extension of the technology acceptance model: four longitudinal
ISSN: 1109-2750
30
Issue 1, Volume 9, January 2010