User Based Usability Testing
A Master Thesis by Anders Bruun, Peter Gull and Lene Hofmeister
Aalborg University June 2007
Department of Computer Science Aalborg University Fredrik bajers Vej 7, building E DK-9220 Aalborg EAST Telephone: +45 9635 8080 Fax: +45 9815 9889
Title: Discount User Based Usability Testing Semester: INF8, From 1st. February 2007 to 6th. of June 2007.
Project Group: d607a Authors:
Anders Bruun
Peter Gull
Lene Hofmeister Supervisor: Jan Stage Copies: 7 Pages: 66 Appendices: 5
Synopsis: In this master thesis we have examined how resources spent conducting user based usability tests can be reduced. The motivation behind the thesis came from the fact that the most widely used discount usability evaluation methods do not involve users in the process. We have evaluated a method called Instant Data Analysis (IDA) and three remote asynchronous methods; User Reported Critical Incident (UCI), Forum and a longitudinal based Diary. Our findings show that the IDA method considerably reduces the efforts required to transform data into findings when conducting user based laboratory think‐aloud based evaluations, while still finding the most severe problems. By using the remote asynchronous methods we were able to considerably reduce the efforts required to conduct usability tests, transform data into findings and bringing test participants to a laboratory. These methods, however, lack the ability to facilitate in the identification of serious and cosmetic problems.
2
Preface Thisȱmasterȱthesisȱisȱwrittenȱbyȱthreeȱstudentsȱduringȱspringȱ2007ȱatȱtheȱinstituteȱ ofȱcomputerȱscienceȱatȱtheȱUniversityȱofȱAalborg.ȱ Weȱwantȱtoȱthankȱallȱofȱtheȱparticipantsȱwhoȱtookȱtheȱtimeȱtoȱhelpȱusȱconductȱallȱ ofȱourȱusabilityȱtestsȱasȱwellȱasȱtheȱrespondentsȱwhoȱtookȱtheȱtimeȱtoȱanswerȱourȱ questionnaires.ȱ Aȱ specialȱ thankȱ goesȱ toȱ ourȱ supervisorȱ Janȱ Stageȱ forȱ providingȱ constructiveȱfeedbackȱduringȱtheȱprocess,ȱandȱtoȱLouiseȱandȱThomasȱforȱhelpingȱ usȱduringȱpilotȱtesting.ȱ Thisȱmasterȱthesisȱconsistsȱofȱthisȱreportȱconcerningȱourȱmotivation,ȱwhatȱweȱhaveȱ researchedȱandȱourȱresults.ȱTheȱappendicesȱconsistȱofȱtwoȱarticlesȱaboutȱourȱmainȱ researchȱ (appendixȱ Aȱ andȱ B),ȱ aȱ summaryȱ ofȱ aȱ reportȱ concerningȱ barriersȱ inȱ conjunctionȱwithȱusabilityȱtestingȱinȱNorthernȱJutlandȱ(appendixȱC).ȱAppendixȱDȱ consistsȱ ofȱ theȱ documentȱ usedȱ toȱ trainȱ theȱ participantsȱ duringȱ theȱ remoteȱ asynchronousȱUCIȱtests.ȱThisȱisȱincludedȱforȱinspirationȱforȱothersȱwantingȱtoȱdoȱ similarȱresearch.ȱAȱsummaryȱofȱtheȱthesisȱcanȱbeȱseenȱinȱappendixȱE.ȱ
ȱ
1
ȱ
2ȱ ȱ
Contents 1
Introduction................................................................................................................ 5 1.1
ResearchȱQuestionȱ1......................................................................................... 6
1.2
ResearchȱQuestionȱ2......................................................................................... 7
2
ResearchȱPapers ......................................................................................................... 9 2.1
ResearchȱPaperȱ1 .............................................................................................. 9
2.2
ResearchȱPaperȱ2 ............................................................................................ 10
3
ResearchȱMethodology ........................................................................................... 13 3.1
DescriptionȱofȱtheȱResearchȱMethods ......................................................... 13
3.2
UseȱofȱtheȱResearchȱMethods ....................................................................... 14
4
Conclusion................................................................................................................ 17 4.1
ResearchȱQuestionȱ1....................................................................................... 17
4.2
ResearchȱQuestionȱ2....................................................................................... 17
4.3
OverallȱResearchȱQuestion ........................................................................... 18
4.4
FutureȱWork.................................................................................................... 18
5
Bibliography............................................................................................................. 19
A. ResearchȱPaperȱ1...................................................................................................... 21 B.
ResearchȱPaperȱ2...................................................................................................... 33
C.
SummaryȱofȱtheȱReport:ȱ“BarriersȱwhenȱConductingȱUsabilityȱTests”........... 47
D. DocumentȱUsedȱforȱTrainingȱinȱtheȱIdentificationȱofȱUsabilityȱProblems ...... 53 E.
Summary................................................................................................................... 59
ȱ ȱ
ȱ
3
ȱ
4ȱ ȱ
1 Introduction Usabilityȱevaluationȱtakesȱtime,ȱespeciallyȱwhenȱconductingȱuserȬbasedȱlaboratoryȱ thinkȬaloudȱ evaluationsȱ asȱ describedȱ byȱ Jeffreyȱ Rubinȱ [12].ȱ Accordingȱ toȱ Rubin,ȱ theȱfollowingȱsixȱstagesȱhaveȱtoȱbeȱcompletedȱwhenȱconductingȱsuchȱaȱtest:ȱ x
Developȱtheȱtestȱplanȱ
x
Selectȱandȱacquireȱtestȱparticipantsȱ
x
Prepareȱtheȱtestȱmaterialsȱ
x
Conductȱtheȱtestȱ
x
Debriefȱtheȱparticipantsȱ
x
Transformȱdataȱintoȱfindingsȱandȱrecommendationsȱ
Theȱ mostȱ resourceȱ demandingȱ stageȱ ofȱ theseȱ isȱ theȱ transformationȱ ofȱ dataȱ intoȱ findingsȱ inȱ whichȱ hoursȱ ofȱ videoȱ dataȱ isȱ thoroughlyȱ walkedȱ throughȱ toȱ identifyȱ usabilityȱproblemsȱ[7,ȱ10].ȱToȱreduceȱtheȱamountȱofȱresources,ȱvariousȱ“discount”ȱ usabilityȱ methodsȱ canȱ beȱ applied.ȱ Theȱ mostȱ widelyȱ usedȱ discountȱ methodsȱ areȱ basedȱ onȱ inspection,ȱ inȱ whichȱ aȱ usabilityȱ expertȱ inspectsȱ aȱ givenȱ systemȱ forȱ problemsȱ usingȱ aȱ setȱ ofȱ heuristicsȱ [2,ȱ 4,ȱ 5,ȱ 6,ȱ 8,ȱ 9,ȱ 11].ȱ Whenȱ applyingȱ inspectionȱ methodsȱnoȱuserȱinvolvementȱisȱrequired,ȱtherebyȱgivingȱtheȱadvantageȱofȱsavingȱ resourcesȱ onȱ theȱ acquisitionȱ ofȱ testȱ participants.ȱ However,ȱ theȱ lackȱ ofȱ userȱ involvementȱ isȱ alsoȱ oneȱ ofȱ theȱ mainȱ critiquesȱ ofȱ theȱ method,ȱ asȱ youȱ missȱ outȱ onȱ theȱproblemsȱexperiencedȱbyȱrealȱusers.ȱ Theȱ conductionȱ itselfȱ ofȱ aȱ laboratoryȱ usabilityȱ testȱ isȱ alsoȱ resourceȱ demandingȱ becauseȱaȱtestȱmonitorȱhasȱtoȱpresentȱinȱrealȱtimeȱduringȱtheȱtestȱ[1,ȱ10,ȱ13].ȱ Theȱ acquisitionȱ ofȱ testȱ participantsȱ canȱ alsoȱ beȱ aȱ resourceȱ demandingȱ taskȱ toȱ complete.ȱ Weȱ haveȱ experiencedȱ thisȱ firstȱ hand,ȱ asȱ aȱ localȱ Danishȱ companyȱ developedȱ aȱ systemȱ forȱ anȱ Americanȱ customer.ȱ Weȱ conductedȱ usabilityȱ testsȱ onȱ theȱsystem,ȱbutȱitȱwasȱnotȱpossibleȱforȱusȱtoȱdoȱsoȱusingȱfutureȱusersȱbecauseȱofȱtheȱ geographicȱdistance.ȱTherefore,ȱweȱwereȱforcedȱtoȱuseȱDanishȱparticipants,ȱwhichȱ requiredȱ thatȱ theȱ systemȱ dialogsȱ andȱ manualȱ hadȱ toȱ beȱ translatedȱ intoȱ Danish.ȱ Besidesȱfromȱtakingȱtime,ȱtheȱtranslationȱalsoȱhadȱtheȱpotentialȱofȱnotȱuncoveringȱ usabilityȱ problemsȱ causedȱ byȱ theȱ Americanȱ formulationsȱ andȱ useȱ ofȱ words.ȱ Theȱ culturalȱbackgroundȱofȱtheȱparticipantsȱalsoȱdifferedȱfromȱthatȱofȱtheȱfutureȱusers.ȱ Withȱ theȱ increasingȱ useȱ ofȱ globalȱ softwareȱ developmentȱ where,ȱ forȱ instance,ȱ programmingȱtasksȱareȱoutsourcedȱtoȱthirdȱpartyȱcompanies,ȱtheȱsameȱproblemsȱ canȱpotentiallyȱariseȱforȱotherȱcompaniesȱasȱwell.ȱWhenȱdevelopingȱsystemsȱonȱaȱ globalȱscale,ȱtheȱbringingȱofȱtestȱparticipantsȱtoȱaȱusabilityȱlaboratoryȱcanȱbeȱaȱveryȱ resourceȱdemandingȱtaskȱbecauseȱtheȱtestsȱhaveȱtoȱbeȱconductedȱwithȱtheȱpresenceȱ ofȱtestȱparticipantsȱ[3].ȱ Thus,ȱtheȱstagesȱofȱtransformingȱdataȱintoȱfindings,ȱconductingȱtestsȱandȱacquiringȱ testȱparticipantsȱrequireȱaȱgreatȱamountȱofȱresourcesȱtoȱcomplete.ȱTherefore,ȱitȱcanȱ ȱ
5
ȱ beȱaȱtediousȱtaskȱtoȱconvinceȱanyoneȱthatȱtheȱresourcesȱrequiredȱtoȱcompleteȱtheseȱ stagesȱ isȱ worthȱ theȱ effort.ȱ Thisȱ isȱ theȱ mainȱ motivationȱ behindȱ ourȱ masterȱ thesis.ȱ Weȱ wantedȱ toȱ studyȱ methodsȱ forȱ reducingȱ theȱ effortsȱ connectedȱ toȱ usabilityȱ evaluationsȱwhileȱpreservingȱaȱuserȬbasedȱapproach.ȱ Toȱ getȱ furtherȱ insightȱ inȱ theȱ problemsȱ relatedȱ toȱ usabilityȱ evaluations,ȱ weȱ researchedȱtheȱbarriersȱofȱapplyingȱusabilityȱtestingȱinȱtheȱsoftwareȱdevelopmentȱ industry.ȱ Thisȱ researchȱ wasȱ doneȱ byȱ theȱ authorsȱ ofȱ thisȱ reportȱ alongȱ withȱ threeȱ otherȱresearchers.ȱAȱsummaryȱofȱtheȱreportȱcanȱbeȱseenȱinȱappendixȱC.ȱ74ȱsoftwareȱ developmentȱcompaniesȱinȱNorthernȱ Jutlandȱ wereȱ askedȱ aboutȱ theirȱ experiencesȱ conductingȱ usabilityȱ tests.ȱ 39ȱ answered.ȱ Manyȱ ofȱ themȱ (30)ȱ statedȱ thatȱ theyȱ conductedȱusabilityȱtests.ȱTheseȱwereȱbothȱsmallȱandȱlargeȱcompanies.ȱHowever,ȱ theȱrespondents’ȱunderstandingȱofȱusabilityȱtestsȱdiffered.ȱItȱwasȱthoughtȱtoȱbeȱaȱ testȱ ofȱ functionalityȱ byȱ 18ȱ respondents,ȱ butȱ 31ȱ respondedȱ thatȱ itȱ wasȱ aȱ testȱ focusingȱonȱtheȱuserȱinȱsomeȱway.ȱAnȱexampleȱofȱaȱmoreȱdiffuseȱanswerȱis:ȱ“Toȱgetȱ aȱ focusȱ groupȱ toȱ understandȱ theȱ purposeȱ ofȱ theȱ test.ȱ Weȱ haveȱ oftenȱ receivedȱ feedbackȱ onȱ designȱwhenȱourȱfocusȱwasȱonȱfunctionality,ȱbutȱweȱhaveȱlearnedȱfromȱit”.ȱ Highȱresourceȱusageȱisȱtheȱnumberȱoneȱreason,ȱwhyȱsomeȱofȱtheseȱcompaniesȱdoȱ notȱconductȱusabilityȱtests.ȱThisȱseemsȱreasonableȱasȱthisȱisȱalsoȱseenȱasȱtheȱmainȱ problemȱforȱthoseȱconductingȱusabilityȱtests.ȱForȱinstance,ȱoneȱofȱtheȱrespondentsȱ replied:ȱ “Theȱ resourceȱ usageȱ isȱ surprisinglyȱ high”.ȱ Anotherȱ problemȱ relatedȱ toȱ theȱ highȱ resourceȱ requirementsȱ wasȱ thatȱ ofȱ findingȱ suitableȱ testȱ participants.ȱ Furthermoreȱ aȱ commonȱ problemȱ wasȱ theȱ developers’ȱ wayȱ ofȱ thinkingȱ aboutȱ usability;ȱ theyȱ canȱ haveȱ difficultiesȱ inȱ thinkingȱ likeȱ theȱ users,ȱ e.g.:ȱ “Youȱ haveȱ toȱ thinkȱ moreȱ likeȱ anȱ ordinaryȱ user.ȱ Howȱ theyȱ wouldȱ useȱ theȱ program”.ȱ Someȱ haveȱ alsoȱ hadȱproblemsȱfindingȱmotivatedȱtestȱparticipants,ȱimplementingȱusabilityȱtestsȱinȱ theȱdevelopmentȱprojectsȱorȱmakingȱtheirȱcustomersȱseeȱtheȱpurposeȱofȱusabilityȱ testing.ȱȱ Thus,ȱtheȱbarriersȱexperiencedȱbyȱtheȱrespondentsȱareȱrelatedȱtoȱtheȱhighȱresourceȱ usageȱinȱconductingȱtestsȱ(andȱtransformingȱdataȱintoȱfindings)ȱandȱacquiringȱtestȱ participants.ȱ Asȱ mentionedȱ earlier,ȱ theȱ mostȱ widelyȱ usedȱ discountȱ usabilityȱ evaluationȱ methodsȱ thatȱ reducesȱ theseȱ problemsȱ areȱ basedȱ onȱ inspection.ȱ Theseȱ methods,ȱ however,ȱ doȱ notȱ invokeȱ userȱ involvementȱ andȱ haveȱ beenȱ studiedȱ inȱ muchȱ detailȱ inȱ earlierȱ research.ȱ Forȱ theseȱ reasons,ȱ weȱ wantedȱ toȱ focusȱ onȱ alternativeȱ discountȱ methods,ȱ whichȱ atȱ theȱ sameȱ timeȱ involvedȱ users.ȱ Basedȱ onȱ theȱaboveȱmotivationsȱweȱwantedȱtoȱexamineȱtheȱfollowingȱquestion:ȱ “Howȱ canȱ theȱ effortsȱ spentȱ onȱ usabilityȱ evaluationsȱ beȱ reducedȱ whileȱ preservingȱ aȱ userȱ basedȱapproach?”ȱ Thisȱquestionȱhasȱledȱtoȱtwoȱresearchȱquestions.ȱ
1.1 Research Question 1 Theȱ timeȱ spentȱ transformingȱ dataȱ intoȱ findingsȱ isȱ usuallyȱ theȱ mostȱ demandingȱ partȱwhenȱconductingȱthinkȬaloudȱuserȱbasedȱlaboratoryȱusabilityȱtests.ȱTheȱfirstȱ researchȱquestionȱisȱtherefore:ȱ
6ȱ ȱ
“Howȱ canȱ theȱ effortsȱ spentȱ onȱ identificationȱ ofȱ usabilityȱ problemsȱ beȱ reducedȱ whenȱ conductingȱaȱthinkȬaloudȱuserȱbasedȱlaboratoryȱtest,ȱandȱhowȱwillȱthisȱaffectȱtheȱresults?”ȱ
1.2 Research Question 2 Whenȱconductingȱusabilityȱevaluations,ȱatȱleastȱoneȱevaluatorȱhasȱtoȱbeȱpresentȱinȱ realȱtimeȱasȱtestȱmonitorȱduringȱtheȱconductionȱofȱtheȱtest.ȱAsȱmentionedȱabove,ȱ theȱ transformationȱ ofȱ dataȱ intoȱ findingsȱ isȱ alsoȱ veryȱ resourceȱ demanding.ȱ Furthermoreȱ youȱ haveȱ toȱ spendȱ resourcesȱ onȱ bringingȱ testȱ participantsȱ toȱ theȱ laboratoryȱinȱorderȱtoȱconductȱtheȱtest.ȱWeȱthereforeȱwantedȱtoȱexamineȱmethodsȱ thatȱreduceȱtheseȱefforts,ȱwhichȱleadȱtoȱourȱsecondȱresearchȱquestion:ȱ “Canȱusersȱconductȱaȱusabilityȱevaluationȱwithoutȱtheȱpresenceȱofȱaȱusabilityȱexpert,ȱandȱ howȱwillȱthisȱaffectȱtheȱeffortsȱspentȱandȱtheȱusabilityȱproblemsȱidentified?”ȱ Toȱanswerȱtheseȱquestionsȱweȱhaveȱconductedȱtwoȱempiricalȱstudies,ȱwhichȱwillȱ beȱpresentedȱinȱtheȱfollowingȱsection.ȱ
ȱ
7
ȱ ȱ
8ȱ ȱ
2 Research Papers Thisȱ chapterȱ presentsȱ theȱ twoȱ researchȱ papersȱ inȱ thisȱ thesis.ȱ Theȱ firstȱ paperȱ presentsȱ anȱ evaluationȱ ofȱ aȱ methodȱ toȱ reduceȱ theȱ timeȱ spentȱ onȱ analysisȱ duringȱ userȬbasedȱthinkȱaloudȱlaboratoryȱtests.ȱTheȱpaperȱcanȱbeȱseenȱinȱappendixȱA.ȱTheȱ secondȱ paperȱ presentsȱ aȱ comparisonȱ ofȱ threeȱ remoteȱ asynchronousȱ methodsȱ forȱ usabilityȱtestingȱthatȱrequiresȱ theȱusersȱ toȱidentifyȱ andȱ reportȱ usabilityȱ problemsȱ themselves.ȱTheȱpaperȱcanȱbeȱseenȱinȱappendixȱB.ȱ
2.1 Research Paper 1 EvaluationȱofȱInstantȱDataȱAnalysisȱ–ȱanȱEmpiricalȱStudyȱ Dataȱ analysisȱ isȱ oneȱ ofȱ theȱ mostȱ timeȱ consumingȱ activitiesȱ inȱ conductingȱ aȱ laboratoryȱ testȱ [7].ȱ Thisȱ paperȱ presentsȱ aȱ userȱ basedȱ thinkȬaloudȱ laboratoryȱ experiment,ȱ whereȱ theȱ dataȱ wasȱ analysedȱ usingȱ twoȱ differentȱ methods;ȱ Videoȱ DataȱAnalysisȱ(VDA)ȱandȱtheȱdiscountȱmethodȱInstantȱDataȱAnalysisȱ(IDA).ȱTheȱ aimȱofȱIDAȱisȱtoȱquicklyȱidentifyȱtheȱmostȱcriticalȱusabilityȱproblems.ȱ Theȱsystemȱusedȱforȱtheȱevaluationȱwasȱaȱhealthcareȱsystem,ȱwhichȱisȱintendedȱforȱ homeȱuseȱbyȱtheȱelderly.ȱTheȱparticipantsȱwereȱfiveȱelderlyȱinȱtheȱageȱbetweenȱ61ȱ andȱ 78.ȱ Theȱ testȱ tookȱ placeȱ inȱ theȱ usabilityȱ laboratoryȱ atȱ theȱ university.ȱ Afterȱ conductingȱtheȱtest,ȱtheȱtwoȱdifferentȱanalysisȱmethodsȱwereȱapplied:ȱ VideoȱDataȱAnalysisȱ(VDA)ȱ Threeȱ evaluatorsȱ individuallyȱ conductedȱ aȱ traditionalȱ Videoȱ Dataȱ Analysis,ȱ asȱ describedȱ inȱ [12].ȱ Theȱ evaluatorsȱ eachȱ madeȱ aȱ problemȱ list,ȱ andȱ theȱ identifiedȱ problemsȱ wereȱ allȱ categorizedȱ asȱ eitherȱ “critical”,ȱ “serious”ȱorȱ“cosmetic”.ȱTheȱthreeȱlistsȱwereȱmergedȱintoȱoneȱproblemȱlist.ȱ Theȱresultsȱfromȱusingȱthisȱmethodȱwasȱusedȱasȱbaselineȱinȱtheȱexperimentȱ InstantȱDataȱAnalysisȱ(IDA)ȱ Theȱ analysisȱ tookȱ placeȱ justȱ afterȱ theȱ testȱ sessionȱ wasȱ finished.ȱ Aȱ dataȱ loggerȱ andȱ theȱ testȱ monitorȱ articulatedȱ andȱ discussedȱ theȱ mostȱ criticalȱ problemsȱ theyȱ identifiedȱ duringȱ theȱ test.ȱ Allȱ identifiedȱ problemsȱ wereȱ listedȱ andȱ organizedȱ onȱ aȱ whiteboardȱ byȱ aȱ facilitator.ȱ Duringȱ theȱ evaluationȱ theȱ evaluatorsȱ reliedȱ onȱ theirȱ memoryȱ andȱ theȱ notesȱ fromȱ theȱ logger.ȱ Theȱ identifiedȱ problemsȱ wereȱ allȱ categorizedȱ asȱ eitherȱ “critical”,ȱ “serious”ȱ orȱ “cosmetic”.ȱ ȱ Atȱ theȱ endȱ theȱ facilitatorȱ wroteȱ downȱ allȱ theȱ identifiedȱproblemsȱandȱtheȱseverityȱcategorizationsȱinȱaȱproblemȱlist.ȱ AfterȱtheȱanalysisȱtheȱproblemȱlistsȱfromȱVDAȱandȱIDAȱwereȱmergedȱintoȱone.ȱȱ Ourȱ resultsȱ showȱ thatȱ byȱ usingȱ theȱ VDAȱ methodȱ weȱ identifiedȱ 44ȱ problemsȱ inȱ total,ȱandȱbyȱusingȱtheȱIDAȱmethodȱ37ȱproblemsȱwereȱidentified.ȱTheȱdistributionȱ ofȱcriticalȱproblemsȱwasȱ13ȱidentifiedȱ byȱ usingȱ VDAȱandȱ 16ȱusingȱ IDA.ȱ Theȱ twoȱ methodsȱfacilitatedȱinȱtheȱidentificationȱofȱtheȱsameȱnumberȱofȱseriousȱproblems,ȱ ȱ
9
ȱ 13.ȱ 18ȱ cosmeticȱ problemsȱ wereȱ identifiedȱ usingȱ VDAȱ andȱ 8ȱ byȱ usingȱ IDA.ȱ Theȱ threeȱevaluatorsȱfromȱtheȱVDAȱteamȱspentȱaboutȱ60ȱpersonȱhoursȱonȱtheȱanalysis.ȱ Theȱ IDAȱ teamȱ spentȱ 11.5ȱ personȱ hours.ȱ Usingȱ twoȱ VDAȱ evaluatorsȱ insteadȱ ofȱ threeȱdoȱnotȱmakeȱaȱsignificantȱdifferenceȱinȱnumberȱofȱproblemsȱfound,ȱandȱtheȱ timeȱspentȱisȱfourȱtimesȱhigherȱthanȱtheȱtimeȱspentȱconductingȱIDA.ȱȱ TheȱproblemȱdescriptionsȱprovidedȱbyȱIDAȱprovideȱlessȱdetailȱthanȱtheȱproblemsȱ describedȱ throughȱ VDA,ȱ andȱ theȱ latterȱ alsoȱ providesȱ aȱ detailedȱ logȱ coveringȱ theȱ videoȱmaterial,ȱwhichȱisȱusefulȱinȱtheȱprocessȱofȱredesigningȱtheȱtestedȱsystem.ȱWeȱ alsoȱexperiencedȱconsiderableȱdifferencesȱinȱtheȱproblemȱseverityȱcategorizationsȱ doneȱ inȱ IDAȱ andȱ VDA,ȱ whereȱ theȱ IDAȱ categorizationsȱ generallyȱ wereȱ moreȱ severe.ȱ Finallyȱ weȱ foundȱ thatȱ IDAȱ wasȱ betterȱ atȱ filteringȱ outȱ theȱ potentialȱ noiseȱ createdȱbyȱproblemsȱexperiencedȱbyȱoneȱparticipantȱonly.ȱȱ Ourȱresultsȱwereȱcomparedȱwithȱearlierȱresearchȱresultsȱfromȱ[7].ȱThisȱcomparisonȱ showsȱ thatȱ theȱ numberȱ ofȱ problemsȱ identifiedȱ byȱ usingȱ IDAȱ versusȱ problemsȱ identifiedȱ byȱ usingȱ VDAȱ isȱ fairlyȱ equal.ȱ Theȱ differenceȱ inȱ personȱ hoursȱ spentȱ betweenȱIDAȱandȱVDAȱdifferedȱconsiderablyȱthough,ȱasȱ[7]ȱusedȱ10ȱtimesȱasȱlongȱ conductingȱVDAȱcomparedȱtoȱIDA.ȱ TheȱkeyȱfindingsȱfromȱourȱstudyȱshowȱthatȱbyȱusingȱIDAȱweȱwereȱableȱtoȱreduceȱ theȱtimeȱspentȱonȱidentificationȱofȱusabilityȱproblemsȱbyȱaȱfactorȱofȱfive,ȱwhileȱstillȱ revealingȱtheȱmostȱsevereȱproblems.ȱThus,ȱtheȱIDAȱmethodȱlivesȱupȱtoȱtheȱaim.ȱ
2.2 Research Paper 2 Comparisonȱ ofȱ Remoteȱ Asynchronousȱ Methodsȱ forȱ Userȱ Basedȱ Usabilityȱ Testingȱ Ȭȱ Anȱ EmpiricalȱStudyȱ Aȱ laboratoryȱ thinkȬaloudȱ usabilityȱ testȱ requiresȱ timeȱ forȱ conductingȱ theȱ testȱ andȱ identifyingȱ andȱ describingȱ usabilityȱ problems.ȱ Weȱ haveȱ examinedȱ theȱ effectȱ ofȱ lettingȱ theȱ usersȱ performȱ theseȱ tasksȱ atȱ homeȱ throughȱ remoteȱ asynchronousȱ evaluationȱ methods,ȱ withoutȱ theȱ presenceȱ ofȱ aȱ usabilityȱ evaluator.ȱ Thisȱ alsoȱ overcomesȱtheȱproblemȱofȱbringingȱtheȱparticipantsȱtoȱtheȱlaboratory.ȱȱȱ Inȱ thisȱ paperȱ weȱ compareȱ threeȱ approachesȱ toȱ remoteȱ asynchronousȱ usabilityȱ testing.ȱTheȱthreeȱconditionsȱwereȱcomparedȱtoȱaȱtraditionalȱlaboratoryȱtest,ȱwhichȱ weȱ usedȱ asȱ aȱ benchmark.ȱ Theȱ systemȱ usedȱ forȱ evaluationȱ wasȱ theȱ eȬmailȱ clientȱ MozillaȱThunderbird,ȱwhichȱnoneȱofȱtheȱparticipantsȱhadȱusedȱbefore.ȱȱ Weȱ conductedȱ aȱ conventionalȱ laboratoryȱ userȬbasedȱ thinkȬaloudȱ testȱ (Lab)ȱ withȱ tenȱ participants.ȱ Theȱ testȱ tookȱ placeȱ inȱ theȱ usabilityȱ laboratoryȱ atȱ theȱ university.ȱ TheȱtestȱwasȱconductedȱapplyingȱtheȱthinkȬaloudȱprotocolȱasȱdescribedȱinȱ[12].ȱToȱ avoidȱbeingȱbiasedȱduringȱtheȱanalysis,ȱtheȱevaluatorsȱwereȱnotȱpresentȱduringȱtheȱ test.ȱ Theȱremoteȱasynchronousȱtestsȱwereȱconductedȱusingȱthirtyȱdifferentȱparticipants,ȱ tenȱ forȱ eachȱ condition.ȱ Allȱ participantsȱ satȱ atȱ homeȱ conductingȱ theȱ test.ȱ Theyȱ receivedȱ instructionsȱ onȱ howȱ toȱ conductȱ theȱ test,ȱ howȱ toȱ identifyȱ andȱ categorizeȱ usabilityȱproblemsȱandȱhowȱtoȱreportȱtheȱproblems.ȱTheȱthreeȱconditionsȱdifferedȱ inȱtheȱwaysȱinȱwhichȱusabilityȱproblemsȱwereȱreported:ȱ
10 ȱ
UserȬreportedȱCriticalȱIncidentȱmethodȱ(UCI):ȱ TheȱidentifiedȱproblemsȱwereȱallȱreportedȱusingȱanȱonȬlineȱform.ȱTheȱtimeȱ spentȱconductingȱtheȱtestȱwasȱeȬmailedȱtoȱus.ȱTheȱparticipantsȱhadȱaȱweekȱ toȱcompleteȱtheȱtest,ȱbutȱtheyȱwereȱtoldȱtoȱcompleteȱallȱtasksȱatȱoneȱsitting.ȱ Forum:ȱ Theȱidentifiedȱproblemsȱwereȱpostedȱonȱaȱforumȱandȱtheȱparticipantsȱwereȱ askedȱtoȱdiscussȱthese.ȱTheȱparticipantsȱwereȱalsoȱencouragedȱtoȱlogonȱtoȱ theȱ forumȱ everyȱ dayȱ ofȱ theȱ weekȱ toȱ commentȱ onȱ newȱ posts.ȱ Theȱ participantsȱhadȱaȱweekȱtoȱcompleteȱtheȱtestȱandȱtoȱpostȱandȱdiscussȱinȱtheȱ forum.ȱTheyȱwere,ȱhowever,ȱaskedȱtoȱcompleteȱallȱtasksȱatȱoneȱsitting.ȱTheȱ identifiedȱ problemsȱ andȱ theȱ timeȱ spentȱ onȱ conductingȱ theȱ testȱ wereȱ alsoȱ sentȱtoȱusȱbyȱeȬmail.ȱ Diary:ȱ Theȱ participantsȱ wereȱ askedȱ toȱ conductȱ nineȱ tasksȱ onȱ theȱ firstȱ dayȱ ofȱ theȱ test,ȱ andȱ theȱ followingȱ fourȱ daysȱ theȱ participantsȱ receivedȱ twoȱ orȱ threeȱ newȱtasksȱtoȱcompleteȱeveryȱday,ȱwhichȱresembledȱtheȱtasksȱcompletedȱtheȱ firstȱ day.ȱ Theȱ participantsȱ wereȱ askedȱ toȱ writeȱ downȱ theȱ identifiedȱ problemsȱ andȱ theȱ timeȱ spentȱ onȱ completingȱ theȱ tasksȱ usingȱ aȱ wordȱ processor.ȱAtȱtheȱendȱofȱtheȱtest,ȱtheȱdocumentsȱwereȱeȬmailedȱtoȱus.ȱ Theȱdataȱfromȱallȱfourȱconditionsȱwereȱcollectedȱbeforeȱstartingȱtheȱanalysis.ȱEachȱ datasetȱ wereȱ givenȱ aȱ uniqueȱ identifier,ȱ andȱ aȱ randomȱ listȱ wasȱ madeȱ forȱ eachȱ evaluator.ȱEachȱevaluatorȱanalysedȱallȱ40ȱdatasets.ȱEachȱevaluatorȱmadeȱaȱproblemȱ listȱ perȱ conditionȱ (Lab,ȱ UCI,ȱ Forumȱ andȱ Diary),ȱ whichȱ wereȱ afterwardsȱ mergedȱ intoȱoneȱlistȱofȱproblemsȱperȱcondition.ȱTheȱfourȱproblemȱlistsȱwereȱcomparedȱandȱ analysedȱandȱfinallyȱtheyȱwereȱmergedȱintoȱoneȱtotalȱproblemȱlist.ȱTheȱevaluatorsȱ alsoȱcategorizedȱallȱproblems.ȱ Theȱmainȱresultsȱshowȱthatȱweȱidentifiedȱ62ȱusabilityȱproblemsȱinȱtotal.ȱByȱusingȱ theȱ Labȱ weȱ identifiedȱ 46ȱ (74%)ȱ ofȱ theȱ totalȱ numberȱ ofȱ problems,ȱ usingȱ UCIȱ weȱ identifiedȱ13ȱ(21%)ȱofȱtheȱproblems,ȱForumȱ15ȱ(24%)ȱproblemsȱandȱusingȱtheȱDiaryȱ conditionȱweȱidentifiedȱ29ȱ(47%)ȱofȱallȱtheȱproblems.ȱInȱtotalȱ21ȱcriticalȱproblems,ȱ 17ȱseriousȱandȱ24ȱcosmeticȱproblemsȱwereȱidentified.ȱUsingȱtheȱLabȱconditionȱweȱ identifiedȱ 20ȱ ofȱ theȱ criticalȱ problemsȱ (95%)ȱ andȱ usingȱ eachȱ ofȱ theȱ asynchronousȱ methodsȱ weȱ identifiedȱ aboutȱ 50%ȱ ofȱ theȱ criticalȱ problems.ȱ Theȱ resultsȱ showȱ thatȱ byȱusingȱtheȱLabȱweȱidentifiedȱsignificantlyȱmoreȱproblemsȱthanȱusingȱanyȱofȱtheȱ asynchronousȱ methods.ȱ Whenȱ usingȱ theȱ asynchronousȱ methodsȱ weȱ generallyȱ foundȱmuchȱlessȱseriousȱandȱcosmeticȱproblems,ȱwithȱtheȱexceptionȱofȱtheȱDiaryȱ method,ȱ whichȱ facilitatedȱ inȱ theȱ identificationȱ ofȱ theȱ sameȱ numberȱ ofȱ cosmeticȱ problemsȱasȱtheȱLab.ȱȱ Whenȱlookingȱatȱtheȱtotalȱtimeȱspentȱonȱconductingȱtheȱtestsȱandȱidentifyingȱtheȱ problemsȱ weȱ spentȱ 55ȱ personȱ hoursȱ conductingȱ theȱ Labȱ test,ȱ 4.5ȱ personȱ hoursȱ applyingȱtheȱUCIȱmethod,ȱ5.5ȱpersonȱhoursȱapplyingȱtheȱForumȱmethodȱandȱ14.5ȱ personȱhoursȱapplyingȱtheȱDiaryȱmethod.ȱȱ
ȱ
11
ȱ Thereȱ wereȱ noȱ significantȱ differencesȱ inȱ theȱ numberȱ ofȱ problemsȱ foundȱ betweenȱ theȱthreeȱasynchronousȱmethods.ȱTheȱtimeȱspentȱonȱanalysisȱwasȱlowestȱusingȱtheȱ UCIȱ condition,ȱ whichȱ onlyȱ requiredȱ 1/12ȱ ofȱ theȱ timeȱ spentȱ comparedȱ toȱ theȱ Labȱ condition.ȱInȱthatȱtimeȱweȱwereȱableȱtoȱidentifyȱ50ȱ%ȱofȱtheȱcriticalȱproblems.ȱ Theȱ categorizationȱ doneȱ byȱ theȱ participantsȱ generallyȱ matchedȱ ourȱ categorizations,ȱ althoughȱ manyȱ problemsȱ wereȱ uncategorized.ȱ UCIȱ wasȱ theȱ onlyȱ conditionȱ inȱ whichȱ allȱ problemsȱ wereȱ categorized,ȱ asȱ theȱ onȬlineȱ formȱ requiredȱ thisȱforȱaȱproblemȱtoȱbeȱsubmitted.ȱ Theȱ structuredȱ approachȱ ofȱ UCIȱ resultedȱ inȱ problemȱ reportsȱ thatȱ wereȱ easilyȱ translatedȱintoȱusabilityȱproblemȱdescriptions.ȱTheȱdiscussionsȱinȱtheȱforumȱwereȱ sparseȱ andȱdidȱ notȱ addȱ muchȱ toȱ theȱ problemsȱ descriptions.ȱ Theȱ Diaryȱ conditionȱ facilitatedȱ inȱ theȱ identificationȱ ofȱ significantlyȱ moreȱ cosmeticȱ problemsȱ thanȱ theȱ otherȱasynchronousȱmethods,ȱbutȱwasȱalsoȱtheȱmostȱtimeȱconsumingȱofȱthese.ȱTheȱ longitudinalȱaspectȱfacilitatedȱinȱtheȱidentificationȱofȱsomeȱextraȱproblems,ȱmostȱofȱ themȱbeingȱcosmetic.ȱ Theȱ resultsȱ showȱ thatȱ itȱ wasȱ possibleȱ forȱ participantsȱ usingȱ theȱ remoteȱ asynchronousȱconditionsȱtoȱidentifyȱhalfȱofȱtheȱcriticalȱproblemsȱusingȱmuchȱlessȱ timeȱ thanȱ theȱ Labȱ condition.ȱ Theȱ problemsȱ wereȱ bestȱ describedȱ usingȱ theȱ UCIȱ method,ȱwhichȱalsoȱfacilitatedȱinȱtheȱcategorizationȱofȱallȱidentifiedȱproblems.ȱȱȱ
12 ȱ
3 Research Methodology Thisȱchapterȱdescribesȱtheȱresearchȱmethods,ȱwhichȱwereȱusedȱtoȱanswerȱtheȱtwoȱ researchȱ questions,ȱ andȱ howȱ weȱ usedȱ theȱ advantagesȱ andȱ reducedȱ someȱ ofȱ theȱ disadvantagesȱofȱtheseȱmethods.ȱȱ
3.1 Description of the Research Methods TheȱdescriptionȱofȱtheȱmethodsȱareȱbasedȱthoseȱdescribedȱbyȱWynekoopȱ&ȱCongerȱ [14].ȱTheyȱdescribeȱtenȱresearchȱmethods,ȱfromȱwhichȱweȱhaveȱusedȱtwo.ȱ RQȱ#ȱ Purposeȱofȱtheȱ studyȱ 1ȱ Evaluationȱofȱaȱ methodȱ
2ȱ
Comparisonȱofȱ methodsȱ
Objectȱonȱwhichȱtheȱ methodȱisȱusedȱ ThinkȬaloudȱ usabilityȱevaluationȱ methodsȱ(bothȱIDAȱ andȱVDA)ȱ ThinkȬaloudȱ usabilityȱevaluationȱ methodȱ Remoteȱ Asynchronousȱ usabilityȱevaluationȱ methodsȱ
Researchȱ methodȱ Laboratoryȱ experimentȱ
Researchȱsetting Artificialȱ
Laboratoryȱ experimentȱ
Artificialȱ
Fieldȱ experimentȱ
Naturalȱ
Table 1. Research methods used to answer the two research questions.
Allȱ theȱ researchȱ methodsȱ haveȱ advantagesȱ andȱ disadvantagesȱ andȱ differentȱ purposes,ȱwhichȱareȱdescribedȱinȱtheȱfollowing.ȱ Laboratoryȱexperimentȱ Theȱlaboratoryȱexperimentsȱareȱcharacterizedȱbyȱaȱsetting,ȱwhichȱisȱcreatedȱbyȱtheȱ researcher,ȱandȱtheȱresearchersȱhaveȱcontrolȱoverȱassignmentȱandȱtheȱsetȬup.ȱItȱcanȱ beȱusedȱtoȱevaluateȱtheȱuseȱofȱaȱphenomenonȱofȱinterest.ȱTheȱmethodȱassumesȱthatȱ realȱ worldȱ interferencesȱ areȱ notȱ important.ȱ Theȱ methodȱ hasȱ theȱ followingȱ advantagesȱandȱdisadvantages.ȱ Advantages:ȱ x
Highȱreliabilityȱ
x
Replicableȱ
x
Preciseȱmeasuresȱ
x
Greatȱvariableȱcontrolȱ
x
Independentȱvariableȱmanipulationȱ
ȱ
ȱ
13
ȱ Disadvantages:ȱ x
Artificialȱsettingsȱ
x
Unknownȱgeneralizabilityȱtoȱrealȱsettingsȱ
x
AssumesȱthatȱrealȬworldȱisȱnotȱimportantȱ
Fieldȱexperimentȱ Aȱfieldȱexperimentȱisȱusedȱforȱexperiments,ȱwhereȱaȱphenomenonȱisȱobservedȱinȱaȱ naturalȱ setting.ȱ Whenȱ testingȱ inȱ aȱ naturalȱ setting,ȱ itȱ isȱ possibleȱ toȱ testȱ theȱ phenomenonȱinȱaȱcomplexȱsocialȱinteractionȱandȱitȱisȱpossibleȱtoȱmanipulateȱandȱ controlȱ theȱ variablesȱ andȱ toȱ measureȱ theȱ changes.ȱ Asȱ theȱ manipulationȱ ofȱ theȱ variablesȱ increaseȱ theȱ naturalnessȱ ofȱ theȱ experimentsȱ decrease.ȱ Theȱ methodȱ hasȱ theȱfollowingȱadvantagesȱandȱdisadvantages.ȱ Advantages:ȱ x
Naturalȱsettingȱ
x
Replicableȱ
x
Controlȱindividualȱvariablesȱ
Disadvantages:ȱ x
Hardȱtoȱfindȱsitesȱ
x
Experimentsȱmayȱloseȱnaturalnessȱ
3.2 Use of the Research Methods Inȱtheȱfollowingȱweȱdescribeȱhowȱweȱhaveȱusedȱtheȱadvantagesȱandȱreducedȱtheȱ disadvantagesȱofȱtheȱresearchȱmethodsȱinȱourȱexperiments.ȱ ResearchȱQuestionȱ1:ȱHowȱcanȱtheȱeffortsȱspentȱonȱidentificationȱofȱusabilityȱproblemsȱbeȱ reducedȱwhenȱconductingȱaȱthinkȬaloudȱuserȱbasedȱlaboratoryȱtest,ȱandȱhowȱwillȱthisȱaffectȱ theȱresults?ȱ Thisȱ researchȱ questionȱ inȱ paperȱ 1ȱ coversȱ theȱ resultsȱ ofȱ aȱ study,ȱ whereȱ weȱ haveȱ conductedȱ aȱ userȬbasedȱ laboratoryȱ experimentȱ usingȱ theȱ thinkȬaloudȱ protocol.ȱ Afterwardsȱ weȱ haveȱ analysedȱ andȱ comparedȱ theȱ resultsȱ fromȱ theȱ testȱ usingȱ twoȱ differentȱmethods,ȱVDAȱandȱIDA.ȱȱ Asȱ theȱ settingȱ isȱ createdȱ byȱ theȱ researchers,ȱ theȱ experimentȱ isȱ highlyȱ replicable.ȱ Theȱhighȱcontrolȱofȱtheȱexperimentȱhasȱbeenȱusedȱtoȱmakeȱaȱsettingȱcomparableȱtoȱ thatȱ ofȱ [7],ȱ asȱ weȱ wantedȱ toȱ compareȱ ourȱ resultsȱ toȱ theirs.ȱ Someȱ ofȱ theȱ variablesȱ did,ȱhowever,ȱdifferȱfromȱtheirȱexperiment.ȱTheȱsystemsȱtoȱbeȱevaluatedȱwereȱnotȱ ofȱ theȱ sameȱ type,ȱ theȱ testȱ participants’ȱ demographicsȱ differedȱ andȱ theȱ tasksȱ thatȱ hadȱ toȱ beȱ solvedȱ byȱ theȱ participantsȱ differed.ȱ Weȱ thereforeȱ haveȱ toȱ assumeȱ thatȱ theȱVDAȱandȱIDAȱmethodsȱareȱnotȱinfluencedȱbyȱtheseȱvariables.ȱTheȱsimilaritiesȱ betweenȱ ourȱ experimentsȱandȱthatȱofȱ[7]ȱ liedȱ inȱ theȱphysicalȱ setȱ upȱ andȱ theȱdataȱ collectionȱmethods.ȱȱ
14 ȱ
TheȱVDAȱmethodȱmayȱbeȱmoreȱreplicableȱthanȱIDAȱasȱtheȱresearchersȱconductingȱ VDAȱ willȱ haveȱ theȱ dataȱ toȱ beȱ analysedȱ storedȱ onȱ tapes,ȱ whileȱ theȱ researchersȱ conductingȱIDAȱwillȱhaveȱtoȱrelyȱonȱnotesȱtakenȱduringȱtheȱtestȱandȱtheirȱmemory.ȱ Theȱartificialȱsettingȱofȱtheȱexperimentȱdidȱaffectȱtheȱtestȱparticipantsȱasȱtheȱeffortsȱ putȱintoȱsolvingȱtheȱtasksȱwereȱveryȱhigh.ȱOneȱparticipantȱsaidȱthat,ȱhadȱsheȱbeenȱ atȱ home,ȱ sheȱ hadȱ putȱ theȱ systemȱ awayȱ insteadȱ ofȱ tryingȱ anyȱ harderȱ toȱ solveȱ theȱ currentȱtask.ȱThisȱalsoȱtellsȱusȱthatȱtheȱgeneralizabilityȱtoȱaȱrealȱsettingȱisȱlimited.ȱȱ Oneȱofȱtheȱdisadvantagesȱofȱtheȱlaboratoryȱexperimentȱisȱthatȱtheȱparticipantsȱcanȱ feelȱinsecureȱandȱbeȱinfluencedȱbyȱtheȱartificialȱsituation.ȱToȱreduceȱthisȱeffectȱtheȱ testȱmonitorȱwasȱawareȱofȱmakingȱtheȱparticipantsȱfeelȱcomfortableȱandȱdescribedȱ inȱdetailȱtheȱpurposeȱofȱtheȱtestȱandȱtheȱsystem.ȱInȱtheȱfollowingȱinterviewsȱnoneȱ ofȱtheȱparticipantsȱexpressedȱanyȱdiscomfortȱduringȱtheȱcourseȱofȱtheȱtests.ȱ ResearchȱQuestionȱ2:ȱCanȱusersȱconductȱaȱusabilityȱevaluationȱwithoutȱtheȱpresenceȱofȱaȱ usabilityȱ expert,ȱ andȱ howȱ willȱ thisȱ affectȱ theȱ effortsȱ spentȱ andȱ theȱ usabilityȱ problemsȱ identified?ȱ Inȱ thisȱ experimentȱ weȱ haveȱ comparedȱ threeȱ remoteȱ asynchronousȱ usabilityȱ testȱ methods;ȱUCI,ȱForumȱandȱDiary.ȱWeȱchoseȱtoȱconductȱaȱfieldȱexperimentȱtoȱgetȱaȱ naturalȱ setting,ȱ whereȱ theȱ usersȱ wereȱ inȱ theirȱ normalȱ environments.ȱ ȱ Aȱ fieldȱ experimentȱ isȱ closeȱ toȱ theȱ describedȱ normalȱ useȱ ofȱ theȱ remoteȱ asynchronousȱ usabilityȱtestȱmethods.ȱȱ Toȱ evaluateȱ theȱ resultsȱ fromȱ theȱ remoteȱ tests,ȱ weȱ conductedȱ aȱ laboratoryȱ test,ȱ whichȱ weȱ usedȱ forȱ comparisonȱ purposes.ȱ Theȱ laboratoryȱ settingȱ isȱ aȱ controlledȱ environment,ȱwhichȱhelpedȱusȱmakeȱsureȱthatȱeverythingȱworkedȱasȱintendedȱandȱ allȱtestsȱwereȱconductedȱinȱtheȱsameȱway.ȱTheȱdisadvantageȱofȱtheȱartificialȱsettingȱ wasȱ reducedȱ inȱ theȱ sameȱ wayȱ asȱ theȱ otherȱ laboratoryȱ experimentȱ mentionedȱ above,ȱandȱonlyȱoneȱtestȱparticipantȱexpressedȱdiscomfortȱduringȱtheȱtest.ȱ Oneȱ ofȱ theȱ advantagesȱ inȱ conductingȱ aȱ fieldȱ experimentȱ isȱ thatȱ theȱ setȬupȱ isȱ natural.ȱTheȱparticipantsȱfromȱtheȱremoteȱtestsȱexpressedȱthatȱtheyȱlikedȱtoȱsitȱatȱ homeȱconductingȱtheȱtest.ȱItȱwasȱjustȱlikeȱaȱnormalȱsituationȱforȱthem.ȱTheȱhomeȱ settingȱofȱtheȱexperimentȱalsoȱhelpedȱtoȱovercomeȱtheȱproblemȱofȱfindingȱsitesȱforȱ theȱexperiment.ȱOneȱofȱtheȱdisadvantagesȱofȱourȱfieldȱexperimentȱwas,ȱthatȱweȱdidȱ notȱ haveȱ asȱ muchȱ controlȱ asȱ inȱ theȱ laboratoryȱ experiment,ȱ whichȱ madeȱ itȱ moreȱ realisticȱthough.ȱWeȱcannotȱbeȱcertainȱthatȱallȱparticipantsȱfollowedȱourȱguidelinesȱ evenȱ ifȱ statedȱ so.ȱ Toȱ reduceȱ thisȱ effectȱ weȱ didȱ aȱ pilotȱ testȱ onȱ ourȱ guidelinesȱ toȱ makeȱthemȱbalancedȱbyȱbeingȱsufficientlyȱdetailedȱwhileȱnotȱcreatingȱanȱoverloadȱ ofȱinformation.ȱ Anotherȱ problemȱ relatedȱ toȱ theȱ lackȱ ofȱ control,ȱ wasȱ thatȱ threeȱ ofȱ theȱ 30ȱ participantsȱdidȱnotȱexperienceȱanyȱusabilityȱproblemȱatȱall,ȱwhichȱisȱcuriousȱsinceȱ noneȱofȱthemȱhaveȱhadȱanyȱpreviousȱexperienceȱwithȱtheȱtestedȱsystem.ȱUnreliableȱ selfȱ reportingȱ isȱ aȱ problemȱ typicallyȱ associatedȱ withȱ fieldȱ studiesȱ (asȱ opposedȱ toȱ fieldȱ experiments).ȱ Toȱ reduceȱ thisȱ weȱ askedȱ theȱ participantsȱ toȱ submitȱ theȱ timeȱ usedȱ forȱ solvingȱ eachȱ taskȱ andȱ gaveȱ themȱ aȱ hint,ȱ whichȱ enabledȱ themȱ toȱ checkȱ whetherȱ orȱ notȱ theyȱ hadȱ solvedȱ theȱ tasksȱ correctly.ȱ Byȱ doingȱ thisȱ weȱ hopedȱ toȱ encourageȱtheȱparticipantsȱtoȱsolveȱallȱtasks.ȱ ȱ
15
ȱ Weȱ hadȱ greatȱ controlȱ ofȱ theȱ demographicsȱ ofȱ theȱ participants,ȱ howȱ theȱ participantsȱwereȱtrained,ȱwhichȱtasksȱtheȱparticipantsȱhadȱtoȱsolveȱandȱhowȱtheyȱ reportedȱ problems.ȱ Weȱ usedȱ thisȱ controlȱ ofȱ theȱ variablesȱ toȱ changeȱ theȱ wayȱ reportingȱ wereȱ doneȱ betweenȱ threeȱ groupsȱ ofȱ participants.ȱ Theȱ controlȱ did,ȱ however,ȱ alsoȱ affectȱ theȱ naturalnessȱ ofȱ theȱ experiment,ȱ asȱ theȱ taskȱ solvingȱ probablyȱdidȱnotȱreplicateȱtheȱnormalȱuseȱofȱtheȱsystem,ȱasȱeachȱparticipantȱmightȱ useȱdifferentȱpartsȱofȱtheȱsystemȱduringȱeverydayȱuse.ȱTheȱ tasks,ȱhowever,ȱwereȱ chosenȱsoȱasȱtoȱonlyȱincludeȱtheȱuseȱofȱcommonȱsystemȱfeatures.ȱ ȱ
16 ȱ
4 Conclusion Inȱ thisȱ masterȱ thesisȱ weȱ haveȱ examinedȱ howȱ effortsȱ spentȱ conductingȱ usabilityȱ testsȱcanȱbeȱreducedȱwhenȱconductingȱuserȱbasedȱusabilityȱtests.ȱToȱconductȱanȱinȬ depthȱstudyȱofȱthis,ȱweȱhaveȱsetȱ upȱ twoȱ researchȱ questions.ȱ Toȱ answerȱ theseȱ weȱ haveȱ conductedȱ twoȱ empiricalȱ studies,ȱ whichȱ concernȱ comparativeȱ analysisȱ ofȱ differentȱ discountȱ userȱ basedȱ usabilityȱ evaluationȱ methods.ȱ Theȱ twoȱ researchȱ questionsȱ andȱ theȱ answersȱ toȱ theseȱ areȱ describedȱ inȱ theȱ following.ȱ Finallyȱ weȱ answerȱourȱoverallȱresearchȱquestionȱandȱpresentȱsuggestionsȱforȱfutureȱworkȱ
4.1 Research Question 1 “Howȱ canȱ theȱ effortsȱ spentȱ onȱ identificationȱ ofȱ usabilityȱ problemsȱ beȱ reducedȱ whenȱ conductingȱaȱthinkȬaloudȱuserȱbasedȱlaboratoryȱtest,ȱandȱhowȱwillȱthisȱaffectȱtheȱresults?”ȱ Weȱ haveȱ evaluatedȱ theȱ methodȱ Instantȱ Dataȱ Analysisȱ (IDA)ȱ andȱ usedȱ aȱ conventionalȱVideoȱDataȱAnalysisȱ(VDA)ȱasȱaȱbenchmark.ȱ TheȱkeyȱfindingsȱfromȱourȱstudyȱshowȱthatȱweȱthroughȱIDAȱwereȱableȱtoȱrevealȱ 68%ȱofȱtheȱtotalȱnumberȱofȱproblemsȱandȱthatȱweȱfoundȱ81%ȱofȱallȱproblemsȱusingȱ VDA.ȱTheȱaimȱofȱIDAȱisȱtoȱassistȱinȱidentifyingȱtheȱmostȱsevereȱusabilityȱproblemsȱ inȱ lessȱ time,ȱ andȱ weȱ foundȱ moreȱ criticalȱ problemsȱ usingȱ IDAȱ thanȱ weȱ didȱ usingȱ VDA.ȱ Weȱ identifiedȱ theȱ sameȱ numberȱ ofȱ seriousȱ problemsȱ usingȱ IDAȱ asȱ weȱ didȱ usingȱ VDA.ȱ Additionallyȱ IDAȱ didȱ notȱ facilitateȱ inȱ theȱ identificationȱ ofȱ asȱ manyȱ cosmeticȱproblemsȱasȱVDA.ȱUsingȱtwoȱevaluatorsȱinȱIDAȱandȱVDAȱweȱfoundȱthatȱ IDAȱrequiredȱ11.5ȱpersonȱhoursȱandȱVDAȱ39.25ȱpersonȱhours.ȱIDAȱthusȱfulfillsȱitsȱ purposeȱ inȱ revealingȱ theȱ mostȱ severeȱ problemsȱ inȱ lessȱ timeȱ thanȱ aȱ conventionalȱ videoȱ dataȱ analysis.ȱ However,ȱ theȱ problemȱ descriptionsȱ providedȱ byȱ IDAȱ providedȱlessȱdetailȱthanȱtheȱproblemsȱdescribedȱthroughȱtheȱuseȱofȱVDA.ȱ
4.2 Research Question 2 “Canȱusersȱconductȱaȱusabilityȱevaluationȱwithoutȱtheȱpresenceȱofȱaȱusabilityȱexpert,ȱandȱ howȱwillȱthisȱaffectȱtheȱeffortsȱspentȱandȱtheȱusabilityȱproblemsȱidentified?”ȱ Weȱ haveȱ comparedȱ threeȱ remoteȱ asynchronousȱ methodsȱ toȱ conductȱ usabilityȱ testingȱandȱusedȱaȱconventionalȱlaboratoryȱthinkȬaloudȱsettingȱasȱaȱbenchmark.ȱ Weȱ foundȱ thatȱ theȱ testȱ participantsȱ wereȱ ableȱ toȱ identifyȱ andȱ reportȱ theȱ experiencedȱusabilityȱproblemsȱonȱtheirȱown.ȱHowever,ȱtheȱparticipantsȱusingȱtheȱ ForumȱandȱDiaryȱmethodsȱleftȱsomeȱofȱtheȱproblemsȱuncategorized.ȱ Theȱ threeȱ remoteȱ asynchronousȱ methodsȱ eachȱ facilitatedȱ inȱ theȱ identificationȱ ofȱ 50%ȱ ofȱ theȱ totalȱ numberȱ ofȱ criticalȱ problems.ȱ ȱ Generallyȱ weȱ foundȱ muchȱ lessȱ seriousȱ andȱ cosmeticȱ problemsȱ usingȱ theȱ remoteȱ asynchronousȱ methods.ȱ Thereȱ wereȱ noȱ significantȱ differencesȱ inȱ theȱ numberȱ ofȱ problemsȱ identifiedȱ betweenȱ these.ȱ
ȱ
17
ȱ Consideringȱtheȱfastestȱofȱtheȱmethodsȱ(UCI)ȱweȱspentȱ1/12ȱofȱtheȱtimeȱanalyzingȱ theȱresultsȱcomparedȱtoȱtheȱlaboratoryȱtest.ȱ
4.3 Overall Research Question ȱ“Howȱ canȱ theȱ effortsȱ spentȱ onȱ usabilityȱ evaluationsȱ beȱ reducedȱ whileȱ preservingȱ aȱ userȱ basedȱapproach?”ȱ Whenȱ conductingȱ usabilityȱ tests,ȱ activitiesȱ suchȱ asȱ transformingȱ dataȱ intoȱ findings,ȱconductionȱofȱtheȱtestsȱandȱbringingȱtestȱparticipantsȱtoȱȱaȱlaboratoryȱcanȱ beȱveryȱresourceȱdemanding.ȱTheȱmostȱwidelyȱusedȱdiscountȱusabilityȱevaluationȱ methodsȱsuchȱasȱinspectionȱdoȱnotȱinvokeȱuserȱinvolvement.ȱInȱthisȱmasterȱthesisȱ weȱ haveȱ evaluatedȱ alternativeȱ discountȱ methodsȱ forȱ conductingȱ usabilityȱ testsȱ involvingȱ users.ȱ Theseȱ methodsȱ areȱ Instantȱ Dataȱ Analysisȱ andȱ theȱ threeȱ remoteȱ asynchronousȱ methods:ȱ Userȱ reportedȱ Criticalȱ Incident,ȱ Forumȱ andȱ Diary.ȱ Theȱ fourȱmethodsȱallȱreducedȱtheȱeffortsȱrequiredȱtoȱconductȱuserȱbasedȱevaluations.ȱ Byȱ usingȱ Instantȱ Dataȱ Analysisȱ weȱ wereȱ ableȱ toȱ considerablyȱ reduceȱ theȱ effortsȱ requiredȱ toȱ transformȱ dataȱ intoȱ findings.ȱ Consideringȱ theȱ mostȱ severeȱ problemsȱ thisȱ methodȱ performedȱ onȱ parȱ withȱ aȱ conventionalȱ Videoȱ Dataȱ Analysis.ȱ Theȱ remoteȱ asynchronousȱ methodsȱ considerablyȱ reducedȱ theȱ effortsȱ requiredȱ forȱ transformingȱdataȱintoȱfindings,ȱconductingȱtheȱtestȱandȱbringingȱtestȱparticipantsȱ toȱ aȱ laboratory.ȱ Allȱ ofȱ theȱ remoteȱ asynchronousȱ methodsȱ facilitatedȱ inȱ theȱ identificationȱ ofȱ halfȱ theȱ criticalȱ problemsȱ inȱ muchȱ lessȱ timeȱ comparedȱ toȱ aȱ conventionalȱlaboratoryȱtest.ȱ
4.4 Future Work Concerningȱ theȱ methodsȱ examinedȱ inȱ bothȱ articles,ȱ itȱ wouldȱ beȱ interestingȱ toȱ developȱ theseȱ further.ȱ Itȱ wouldȱ beȱ relevantȱ toȱ studyȱ theȱ usefulnessȱ ofȱ theȱ lessȱ detailedȱ problemȱ descriptionsȱ providedȱ byȱ theȱ IDAȱ method,ȱ andȱ ifȱ necessaryȱ studyȱhowȱtoȱimproveȱthese.ȱItȱwouldȱalsoȱbeȱrelevantȱtoȱexamineȱtheȱeffectsȱofȱtheȱ userȱ trainingȱ appliedȱ duringȱ theȱ remoteȱ asynchronousȱ methods,ȱ andȱ howȱ theȱ trainingȱmightȱbeȱimprovedȱtoȱachieveȱmoreȱdetailedȱproblemȱdescriptionsȱandȱaȱ higherȱnumberȱofȱidentifiedȱproblems.ȱ ȱ
18 ȱ
5 Bibliography 1. Bias,ȱRandolphȱGȱandȱMayhew,ȱDoborahȱJ.ȱ(ed).ȱCostȬJustifyingȱUsability.ȱ AcedemicȱPress.ȱ1994ȱ 2. Cockton,ȱ Gilbertȱ andȱ Woolrych,ȱ Alan.ȱ Saleȱ Mustȱ End:ȱ Shouldȱ Discountȱ MethodsȱbeȱClearedȱoffȱHCI’sȱShelves?.ȱInteraction.,ȱ2002ȱ 3. Dray,ȱSusanȱandȱSiegel,ȱDavid.ȱRemoteȱPossibilities?ȱInternationalȱ UsabilityȱTestingȱatȱaȱDistance.ȱInteractions.ȱ2004 4. Gray,ȱ Wayneȱ D.ȱ Discountȱ orȱ Disservice?ȱ Discountȱ Usabilityȱ Analysis— Evaluationȱatȱaȱbargainȱpriceȱorȱsimplyȱdamagedȱmerchandise.ȱCHI.ȱ1995ȱ 5. Jeffries,ȱ Robinȱ andȱ Desurvire,ȱ Heather.ȱ Usabilityȱ Testingȱ vs.ȱ Heuristicȱ Evaluation:ȱWasȱthereȱaȱcontest?.ȱSIGCHIȱBulletin.ȱ1992ȱ 6. Jeffries,ȱRobin,ȱMiller,ȱJamesȱR.,ȱWharton,ȱCathleenȱandȱUyeda,ȱKathyȱM.ȱ Userȱ Interfaceȱ evaluationȱ inȱ theȱ realȱ world:ȱ Aȱ Comparisonȱ ofȱ fourȱ Techniques.ȱ Proceedingsȱ ofȱ theȱ SIGCHIȱ conferenceȱ onȱ Humanȱ factorsȱ inȱ computingȱsystems.ȱpagesȱ119Ȭ124.ȱ1991ȱ 7. Kjeldskov,ȱ Jesperȱ et.ȱ al.ȱ Instantȱ Dataȱ Analysis:ȱ Conductingȱ Usabilityȱ Evaluationsȱ inȱ aȱ Day.ȱ Proceedingsȱ ofȱ theȱ thirdȱ Nordicȱ conferenceȱ onȱ HumanȬ computerȱinteraction.ȱpagesȱ233Ȭ240.ȱ2004ȱ 8. Nielsen,ȱ Jakob.ȱ Findingȱ Usabilityȱ Problemsȱ throughȱ Heuristicȱ Evaluation.ȱ ProceedingsȱofȱtheȱSIGCHIȱconferenceȱonȱHumanȱ factorsȱinȱcomputingȱsystems.ȱ 1992ȱ 9. Nielsen,ȱ Jakob.ȱ Usabilityȱ Inspectionȱ Methods.ȱ Conferenceȱ companionȱ onȱ Humanȱfactorsȱinȱcomputingȱsystems.ȱ1994ȱ 10. Nielsen,ȱJakob.ȱGuerillaȱHCI:ȱUsingȱDiscountȱUsabilityȱEngineeringȱtoȱ PenetrateȱtheȱIntimidationȱBarrier.ȱ http://www.useit.com/papers/guerrilla_hci.html.ȱ1994ȱ 11. Nielsen,ȱ Jakobȱ andȱ Molich,ȱ Rolf.ȱ Heuristicȱ Evaluationȱ ofȱ Userȱ Interfaces.ȱ ProceedingsȱofȱtheȱSIGCHIȱconferenceȱonȱHumanȱFactorsȱinȱcomputingȱsystems:ȱ Empoweringȱpeople.ȱ1990ȱ 12. Rubin,ȱJeffrey.ȱHandbookȱofȱUsabilityȱTesting.ȱJohnȱWileyȱ&ȱSons,ȱINC.ȱ1994ȱ 13. Straub,ȱKath.ȱPittingȱUsabilityȱTestingȱagainstȱHeuristicȱReview.ȱUIȱDesignȱ Newsletterȱ–ȱSeptemberȱ2003.ȱ http://www.humanfactors.com/downloads/sep03.aspȱ 14. Wynekoop,ȱJ.L.ȱandȱConger,ȱS.A.:ȱAȱReviewȱofȱComputerȱAidedȱSoftwareȱ EngineeringȱResearchȱMethods.ȱInȱProceedingsȱofȱtheȱIFIPȱTC8ȱWGȱ8.2ȱ WorkingȱConferenceȱonȱTheȱInformationȱSystemsȱResearchȱArenaȱofȱTheȱ90’s,ȱ Copenhagen,ȱDenmark.ȱ1990.ȱ ȱ
ȱ
19
ȱ
20 ȱ
A. Research Paper 1 ȱ
ȱ
21
ȱ
22 ȱ
Evaluation of Instant Data Analysis – an Empirical Study Anders Bruun, Peter Gull, Lene Hofmeister Department of Computer Science, Aalborg University Fredrik Bajers Vej 7, 9220 Aalborg East
[email protected],
[email protected],
[email protected]
ABSTRACT
When conducting conventional think-aloud based usability tests in a laboratory many resources (time and money) are required. One approach to overcome this while preserving the laboratory use is Instant Data Analysis (IDA). This method is based on a conventional think-aloud laboratory setting. The main idea behind IDA is to reduce the resources spent on the analysis process itself, which is the most time consuming process when conducting a conventional video based data analysis (VDA). In this paper we evaluate the IDA method in terms of problem identification and time usage. VDA is used as a benchmark. Our results show that by applying Instant Data Analysis we were able to identify 89% of the critical problems in one quarter of the time spent on VDA, through which we found 72% of the critical problems. Thus, IDA fulfills the aim of revealing the most severe problems in less time. Keywords
Instant Data Analysis, data analysis, usability, empirical study INTRODUCTION
For many years usability testing have been met by various barriers throughout the IT industry. These barriers are primarily grounded in the prejudice of usability testing being very resource demanding [3]. A questionnaire, which we sent out to 74 software firms in our local area in Denmark, has shown that high resource demands is the largest barrier when conducting usability tests. In the process of making usability evaluations more widespread in the IT industry one of the first barriers to overcome is proving the return of investment [3, 11]. Upper management needs a good incentive to spend the extra money required to perform usability evaluations. Here, it is not enough to say that the end user benefits, the ultimate motivation lies in showing the return of investment in pure numbers. These numbers are almost impossible to extract since most software development projects are very diverse product wise. This makes it hard to compare projects where usability evaluations have been used with those projects where it has not been used. Another main barrier to overcome is the cost to conduct usability evaluations [3, 16, 23]. Compared to proving the return of investment, the costs to perform usability evaluations are much easier to compare and prove, e.g.
when applying two different evaluation methods on the same software. It is clear that a lower cost in conducting usability evaluations make the upper management easier to convince, and discount usability methods have proven to be constructive in getting managers in the IT industry to accept the conduction of usability evaluations within their companies [16]. It is widely acknowledged that a conventional laboratory think aloud test combined with following video analysis is the most effective in finding the greatest number of usability problems [2, 10, 12, 19, 20]. It is, however, also the most time consuming method as is produces a lot of video data that takes much time to analyze. Various discount methods exist that require less effort in analyzing the results [16]. In this article we aim to find out how the efforts spent on the analysis and identification of usability problems can be reduced when conducting laboratory usability tests, and how this will affect the results. We take a closer look at different types of discount usability evaluation methods and we evaluate one of them. In the following we present work related to our study, next we describe the methods used for the empirical study, following this our finding are presented and finally we discuss and conclude on these. RELATED WORK
Several usability testing methods exists that requires less effort than a conventional think aloud laboratory test. An overview of some of these is presented here. As for discount usability, inspection is one of the most referenced [15, 17, 20] and several varieties exist (see [20] for a short overview). Instead of e.g. observing users using a system, the system is “inspected” by usability experts with the goal of unveiling potential usability problems. We here mention three methods to conduct inspection: Heuristic evaluation (HE), Cognitive Walkthrough (CW) and Inspection based on Metaphors of human thinking (MOT). HE is done by inspecting every program dialog, to see if they follow a set of usability heuristics [20]. CW, on the other hand, tries to simulate the users’ problem solving process, thereby identifying problems that the users might encounter during their process towards some goal [20]. MOT is based on five essential metaphors of human thinking, which provide usability experts with guidelines on how to consider the users’ thinking process [9].
23
HE is shown by [6] and [20], to facilitate the identification of more problems than CW, which is also the case when comparing MOT to CW [7]. MOT is shown to identify the same number of problems as HE [7]. [20] and [10] shows that while being more time consuming, think aloud tests tend to facilitate identification of more problems than HE. For identifying serious usability problems, think-aloud tests are even more effective than inspection, finding more serious problem per person hour used [10]. Although inspection might not facilitate in the identification of as many usability problems as other methods, it is cheap to conduct and to implement in a development process as it does not require advanced laboratory equipment and test participants. Rapid Iterative Testing and Evaluation (RITE) tries to maintain the observation of users while lowering the effort. This method is based on a traditional think-aloud laboratory usability test. The primary focus is to make sure that identified usability problems are corrected within a short timeframe, and a secondary objective is to reduce the resources spent testing and implementing the fixes [14]. Using RITE, problems are identified on the fly. If the problems seem easy to fix they are fixed and a new prototype is used for the following tests. If a problem is not easily fixed, more data about the problem is collected during the following tests. The RITE approach requires experienced usability experts as well as developer resources during the tests. The case study proved successful for the use in [14]. The last fixes being made were, however, tested on a small number of participants which may affect the validity, but on the other hand the fixes made were tested. The quick fixing may also affect the quality of the fixes already made, which the case study revealed, as they “broke” other parts of the user interface a couple of times during the process. The advantage of this method lies in the fact that you know that the identified usability problems are solved and that the fixes are tested too. Resource wise it is difficult to tell how effective this method is as it has not been measured. You do however avoid having to do extensive video analysis, but extra human resources are required during the test as at least one developer has to observe the test too, and a development team has to be on standby to implement fixes as problems are identified. Additional focus on resources can be seen with Instant Data Analysis (IDA), which is also based on a conventional think-aloud test. The main idea is to reduce the time to perform analysis of user based usability testing while still identifying critical usability problems [12]. The test setting is similar to a user based think aloud laboratory test and the analysis is conducted immediately after the test sessions with the participation of the test monitor, the data logger and a facilitator. The identification of usability problems is based on the observations made by the test
monitor and data logger during the test. Thus no video data analysis (VDA) has to be done. The experiment conducted by [12] yielded good results, showing that IDA facilitated in the identification of nearly as many usability problems as VDA and only one less critical problem. This was done at only a fraction of the time taken to do VDA. In the experiment conducted by [12] two evaluators participated in the IDA (the facilitator did not help with the identification of problems) and one evaluator in the VDA session. This unequal distribution seems unfair in the sense that it can be argued that two pairs of eyes might identify more usability problems than one pair do, making the results of the experiment biased. This issue can be presented in terms of the evaluator effect [8]. One should also bear in mind that the authors of [12] also developed the IDA method, a fact which might also have caused the results to be biased in favor of IDA. In this article we evaluate the IDA method and use a VDA as a benchmark. METHOD
We have conducted a conventional laboratory based thinkaloud test [21], and analysed the results using two different methods: • •
Video data analysis (VDA) Instant Data Analysis (IDA)
The results from the two methods were afterwards compared. System
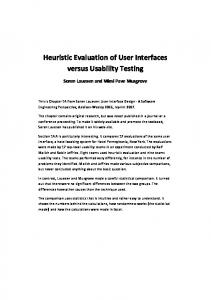
The system used for evaluation was a healthcare system (HCS) intended for home use by the elderly. It is a hardware device consisting of a display, speaker and four buttons for interaction, see figure 1. Using devices such as a blood pressure meter, a blood sugar meter or a scale the patients can perform their measurements at home and transfer these to the HCS via blue tooth, an infrared link or a serial cable. The device may also ask the patients relevant questions regarding their health. The HCS will automatically transfer the data to a nurse, doctor or whomever in charge of monitoring the patients’ health. The system comes with a manual that was evaluated as well.
Y
N
Figure 1. Sketch of the evaluated healthcare system.
24
Participants
The HCS was evaluated using 4 males and 1 female. Since the system primarily is intended for use by the elderly, all of our test participants were between 61 and 78 years of age. None of the participants had previous experience in using the HCS system or systems similar to it. Their experience in using electronic equipment in general varied. Two participants were novices, two were slightly practiced and the last one was experienced in using electronic equipment on a general level.
monitor’s job was primarily to make sure that the test participants were thinking aloud and to give advice if the participants were completely stuck. One of the tasks was required solved, because other tasks were dependent on the result of this task. There were five tasks, and summaries of them are shown in table 1. Task No. 1
Connect and install the equipment.
2
Transfer the data from the blood sugar meter to the HCS. The blood sugar meter is connected using a cable.
3
Measure the weight and transfer the data from the scale to the HCS.
4
A new wireless blood sugar meter is used. Transfer the data from this to the HCS.
5
Clean the equipment.
Laboratory Setting
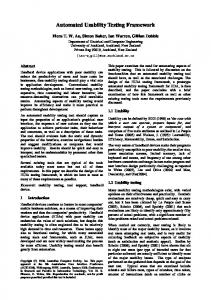
The test was conducted in a usability laboratory; the setting is shown in Figure 2. In room 1 the test participant was sitting at a table operating the HCS. The test monitor was sitting next to the participant. Two data loggers and a technician to control cameras and microphones sat in the control room. Room 1 was equipped with cameras, a microphone and a one-way mirror.
Task
Table 1. Summary of the test tasks. Data Collection
All test sessions were recorded using video cameras and a microphone. We also used the logs written during the test sessions by two of the evaluators.
Subject Room 1
Data Analysis curtain
operator
Subject Room 2
Control Room
Figure 2. The setting in the usability laboratory
The data analysis procedure was divided in two different methods, VDA and IDA. The team conducting the VDA procedure analysed the recorded video material as described below, and the IDA team conducted their analysis immediately after all the test sessions were completed, as described in [12]. The two teams did not communicate during the analysis. VDA
Three evaluators analysed the video material individually and each made a list of identified usability problems, where every problem was categorised as either “critical”, “serious” or “cosmetic”. The three lists of usability problems were discussed in the VDA-team and grouped into one list consisting of VDA identified problems only. When in doubt how to combine, split or categorize a problem, the video material was reviewed as a means to reach an agreement. The evaluator effect (any-two agreement [8]) was calculated to 40,2%, which is above the minimum of 6% and close to the 42% maximum found in the studies of [8]. IDA
Figure 3. A test participant and the test monitor Procedure
Before the test started the test participants were asked to fill out a questionnaire with demographic questions. The test monitor then introduced the participants to the system and to the evaluation procedure. This included the introduction to the think aloud procedure. The tasks were given to the test participants one by one. The test
The test monitor, one of the data loggers and a facilitator conducted the IDA. We followed the approach described in [12]. The analysis was conducted using the following steps: •
The test monitor and data logger first brainstormed in 20 minutes to find any usability problems that came to mind.
25
• •
Both evaluators reviewed all the tasks, one by one, to identify more usability problems. This part lasted 30 minutes. The data logger reviewed the notes she took during the test for additional problems, which lasted 52 minutes.
During the evaluation the facilitator listed and organized all the identified usability problems on the whiteboard. The problems identified during the three different steps were all marked with three different colours (green, blue and black), see figure 4. By doing this it was possible later on, to identify from which step of the analysis session the usability problems were found. After the identification the problems were categorized as either “critical”, “serious” or “cosmetic”. Finally the facilitator created the list of usability problems from the notes written on the whiteboard. To make sure the facilitator described the problems correctly, the list was validated and corrected by the test monitor and data logger the following day.
Figure 4. Picture of the whiteboard with colored notes. Merging VDA and IDA Problem Lists
In order to compare the problem lists from the VDA and IDA procedures we had to merge these into a total list of identified usability problems. The test monitor and the data logger from IDA and the three evaluators from VDA participated in this process. In cases where the VDA and IDA lists did not have the same categorization for a particular problem, we discussed the proper categorization until everyone agreed. During the merging and the discussion, some problems were split into more problems or merged with other problems. RESULTS
In this section we present the results from applying the VDA and IDA procedures. We start by comparing the number of problems identified and afterwards we compare the time spent on analyzing the results. Comparison of the Number of Identified Problems
Table 2 gives an overview of the number of problems found by each method.
26
VDA
IDA
Total
Critical
13
16
18
Serious
13
13
17
Cosmetic
18
8
19
Total
44
37
54
Table 2. Number of identified usability problems
In total we identified 44 usability problems using VDA. 13 of these were critical, 13 serious and 18 cosmetic. IDA revealed a total of 37 usability problems. 16 of these were critical, 13 serious and 8 cosmetic. In total we found 54 different usability problems using VDA and IDA, where 18 were critical, 17 serious and 19 cosmetic. Using the IDA method we have identified more critical problems than using the VDA method, 16 vs. 13. By using the two methods we identified the same number of serious usability problems (13). The number of cosmetic problems identified by using the VDA method (18) exceeded the number identified using IDA (8). For both methods the majority of problems were identified during the completion of task number one, the setup of the HCS. Many of the critical problems were related to the physical setup, such as connecting cables to the correct ports but also using the HCS menu in general, e.g. issues regarding too technical terminology, missing feedback and missing information. Critical problems were also identified during connection and usage of the blood sugar meters and the Bluetooth scale. The main issues were missing feedback, too technical terminology and problems finding the correct buttons. Applying Fishers exact test gives the value p=0.1819 for the total number of problems identified by the VDA and IDA conditions, which means that there is no significant difference. Fishers exact test gives the value p=0.418 for the critical problems identified by the two methods, no significant differences here either, and IDA identified most problems. Considering the serious problems Fishers exact test gives p=1.000 for problems identified using the VDA and IDA conditions, this means there are no differences. Comparing cosmetic problems gives us p=0.0011 using Fishers exact test, and the difference is therefore very significant. The test shows that there is no significant difference between the two methods, except when comparing cosmetic problems, which means that the IDA method meets the aim of the method; to identify the most severe problems. Figure 5 shows the distribution of identified problems between the VDA and IDA methods. Each cell in the figure corresponds to a single problem instance. The black cells mean that the given method has identified that particular problem instance, and the white cells indicate the instances not found by that method.
Figure 5. Problems identified using each method.
By using the IDA method we identified five critical problems, not identified using VDA, and through VDA we identified two problems, not identified applying IDA. Considering the serious problems, we identified four problems using IDA, which were not found using VDA and vice versa. We only identified one cosmetic problem, which was not found using VDA, and were able to find 11 problems using VDA, which were not identified applying IDA. The main aim for IDA is to make an efficient identification of the most critical usability problems [12]. The results in table 2 and figure 5 show that the method lives up to this aim, since the method identified more critical problems than the VDA method, and both methods identified the same number of serious problems. Comparison of Time Spent Analyzing
The main advantage in applying the IDA method lies in the time spent on analysis, and our results show considerable differences here. Identifying problems Merging VDA lists Total
Eval. 1
Eval. 2
Eval. 3
Total
13.5 h
13.75 h
14.5 h
41.75 h
6h
6h
6h
18 h
19.5 h
19.75 h
20.5 h
59.75 h
Table 3. Time spent analyzing using the VDA method.
IDA analysis session
Test monitor
Data logger
Facilitator
Total
2h
2h
2h
6h
1.5 h
1.5 h
Writing list of IDA problems Validating problem list
1h
1h
1h
3h
Total
3h
3h
4.5 h
11.5 h
Table 4. Time spent analyzing using the IDA method.
Table 3 and table 4 give an overview of the time spent analyzing and creating the lists of problems using the VDA and IDA methods respectively. As can be seen in table 3, the total time spent conducting VDA is 59.75 person hours for the three evaluators. It should be noted that we recorded a total of four hours of video material. The time spent on IDA sums up to a total of 11.5 person hours for all three IDA participants using that method. The
time spent on analysis using IDA is roughly five times lower than the time spent using VDA. Using Two VDA Evaluators
In table 3 and table 4 VDA using three evaluators are compared to IDA using only two evaluators and a facilitator who does not identify problems. To get a more balanced picture of VDA versus IDA we will here show how VDA, using two evaluators fairs against IDA. Table 5 gives an overview of the number of problems identified by each pair of evaluators and IDA as well as the time spent conducting the analysis. Eval. 1 and 2
Eval. 1 and 3
Critical
13
13
12
Serious
13
12
Cosmetic
17
16
Total
43
Time spent Problems per hour
Eval. 2 All 3 eval. and 3
IDA
13
16
12
13
13
9
18
8
41
33
44
37
39.25 h
40 h
40.25 h
59.75 h
11.5 h
1.1
1.0
0.8
0.7
3.2
Table 5. Problems found and time spend by all the different combinations of VDA evaluator pairs, all three VDA evaluators and the IDA evaluators.
Using only two evaluators for VDA does not do much in terms of problems found compared to IDA. An exception however is evaluator 2 and 3. They have actually found less problems overall compared to IDA. When calculating the value of a Fishers exact test between IDA and the best-case VDA evaluator pair (evaluator 1 and 2) we get p=0.2721 for the total number of problems, and p=0.4018 for critical problems only, thus there is no significant difference. The time spent conducting the analysis is four times as high for VDA using two evaluators compared to IDA. The number of problems identified per hour is about 3 times lower when doing IDA compared to the best case VDA evaluator pair. The results in tables 2, 3 and 4 show that IDA is fast and effective in identifying the most critical usability problems. The results from figure 5 support this claim. Differences in the Unique Problems Found Using One Method
Figure 5 shows how many unique problems were found using the two methods. Here we define a unique problem as a problem, which is found using one of the methods, but
27
not the other. In the following we examine if the identified unique problems are of a particular type of problems. The unique critical problems found using VDA were experienced during completion of the first task, the setup of the HCS. One of the unique VDA problems is related to missing information on the HCS display. The other unique VDA problem is related to a software bug, which caused the HCS to restart during the setup process. Most of the unique critical problems identified using IDA were experienced during completion of the first task. These are problems related to the physical setup of the HCS. The fifth problem was not directly related to the system as it concerned the participants’ reluctance to contact the technical support staff for help in using the HCS. The unique serious problems found using VDA were all related to the first task. The types of problems regard the physical setup, software bugs, missing feedback and server connection errors. The unique serious problems identified using IDA were related to different tasks, and typically regarded missing feedback from the system. One of the problems was, however, not related to a particular task, but more to the overall nature of the system. The unique cosmetic problems found using VDA are related to all tasks and varies in nature. The one unique cosmetic problem identified using IDA is related to the first task and the type of problem is regarding too technical terminology. From the above we can see that there are no apparent differences in the types of problems, which were uniquely identified using either IDA or VDA. Also, there is no clear difference in which tasks the unique VDA and IDA problems were identified. Problems Experienced by One Test Participant
It can be discussed whether problems experienced by a single test participant only, are generalizable or just noise [12]. Table 6 provides a base for discussing the degree of noise created by problems experienced by a single test participant. The table shows the number of unique problems identified using the VDA method only and intersecting problems identified using both the VDA and IDA method. Due to the nature of the IDA method, we have no knowledge of the number of participants experiencing each unique IDA problem. VDA
VDA and IDA
1 2 or more 1 2 or more participant participants participant participants Critical
1
1
2
9
Serious
3
1
7
2
Cosmetic
8
3
4
3
Total
12
5
13
14
Table 6. Number of problems experienced by 1 or more participants.
28
As shown in table 6, 2 critical problems were identified using VDA only; 1 of these was experienced by a single participant and the other by two or more participants. From the 11 intersecting critical problems, 2 problems were experienced by a single participant, and the remaining 9 identified problems were experienced by two or more participants. When looking at the 4 serious problems identified using the VDA method only, 3 of these were experienced by one participant, and 1 was experienced by more. Of the 9 intersecting serious problems, 7 were experienced by a single participant, and the remaining 2 problems were experienced by more. 11 of the cosmetic problems were only identified using VDA and 7 intersecting cosmetic problems were identified in the use of both methods. 8 of the 11 unique VDA problems were experienced by one test participant, and 3 problems were experienced by two or more participants. Of the 7 cosmetic problems, which are intersecting between VDA and IDA, 4 are experienced by a single participant, and the remaining 3 were all experienced by two or more participants. The results in table 6 show that 13 out of 27 (48%) of the intersecting problems, between VDA and IDA, are experienced by a single test participant. The results also show that 12 out of 17 (70%) of the problems only identified by the use of VDA are experienced by a single participant. These results indicate that IDA is able to give the advantage of avoiding some of the noise provided by potential ungeneralizable problems. This is further discussed under the discussion section of this article. Differences in Categorization
We experienced considerable differences in the categorizations between those problems identified during the use of VDA and IDA. Table 7 gives an overview of the initial categorizations before merging the VDA and IDA problem lists, and after the merging (in parentheses). When merging the two lists from VDA and IDA some problems were split into multiple problems or vice versa. This explains the differences in the total number of problems before and after the merging process compared to table 2. VDA
IDA
Critical
10 (13)
17 (16)
Serious
11 (13)
12 (13)
Cosmetic
25 (18)
6 (8)
Total
46 (44)
35 (37)
Table 7. Severity categorizations before merging VDA and IDA problem lists. The numbers in the parentheses is after the merging.
Before merging the VDA and IDA lists, 49% of the identified IDA problems were categorized as critical. This
percentage was 22% for the VDA problems. When looking at the serious problems, 34% of the IDA problems and 22% of the VDA problems were categorized so. For the cosmetic problems 17% of the IDA problems were initially cosmetic compared to the 56% identified using VDA. When looking at the original problem lists, 7 of the 35 original IDA-problems were, during the merging process, categorized to a less serious categorization and 3 to a more serious categorization. 10 of the original VDA problems were, during the merging, categorized to a more serious categorization. None were categorized to a less serious categorization. In general the problems identified using the IDA method were categorized more seriously than the problems identified by the VDA method. Number of Problems Identified During the Three IDA Steps
In table 8 the number of problems identified during the different steps of the IDA session are shown. 13 of the problems (37%) were identified during the brainstorm step, which lasted 20 minutes (20 % of the total time). The most time consuming step was “Reviewing the notes”, in which we spent 52 minutes (51% of the time) and where 12 (34%) of the problems were identified. Reviewing the Reviewing the Total Brainstorm notes tasks 102 min 20 min (20%) 30 min (29%) 52 min (51%) Critical
7
3
7
17
Serious
4
4
4
12
Cosmetic Total
2
3
1
6
13 (37%)
10 (29%)
12 (34%)
35
Table 8. Number of problems identified in the three IDAsteps. The numbers are before merging with the VDA problems.
The first look at the table shows no considerable difference in the number of problems identified during the “Brainstorm” and “Reviewing the notes” steps. But looking at the individual identified problems, it is revealed that some of the identified critical problems during the brainstorm were split into more detailed problems during the last step (reviewing the notes). E.g. one critical problem was split into four new critical problems when the notes were reviewed, and afterwards deleted as a “Brainstorm”-problem. This explains why the number of critical problems identified during the brainstorm is not higher. It could be expected, that this step identified the largest number, since it was the first step. The last step, even if it was the most time consuming, has shown to be important, because it contributed with important details to the already identified problems and also added new problems to the total list. The results indicate that the combination, of brainstorm and the more structured steps, is working well. The
Brainstorm seems to be a good basis for identifying the problems and the more structured steps contribute with important details and adding new problems to the problem list. Problem Themes Identified in the Different IDA Steps
The three steps performed in the IDA session identified different problem themes. Table 9 shows the identified usability problems during the IDA analysis distributed according to the themes of problems presented in [18]. Brainstorm
Reviewing the tasks
Reviewing the notes
1
Affordance Cognitive load Consistency Ergonomics Feedback
2
3
5
Information
6
2
2
Interaction styles
2
Mapping
1
2
1
2
Navigation Task Flow Users’ model
mental
5
1
Visibility Total
13
10
12
Table 9. Problem themes identified during the three different steps of the IDA session.
The problems identified in the “Brainstorm” step are represented in the three themes: “Users’ mental model”, “Information” and “Feedback”. “Information” and “Users’ mental model” are the main problem themes identified during this step of the IDA session, and are mostly represented in the “Brainstorm” step compared to the other two steps. What is typical about problems of the theme “Users’ mental model” is that the participants’ logic is not consistent with the logic of the application. The “information” problems are mainly concerning lack of information or information that is not understandable by the user. The problem themes in the two more structured steps; “Reviewing the tasks” and “Reviewing the notes” are more evenly distributed over all the different themes. DISCUSSION
In this section we discuss our results and compare these to the findings of [12]. In our study we identified 89% of all critical problems using the IDA method, which is very similar to the findings in [12] where the evaluators identified 85% of all critical problems. Considering the serious problems, we
29
were able to find 76%, which is also similar to the 68% found in [12]. Comparing the results between VDA and IDA, [12] found that VDA facilitated in the identification of more critical problems (92%) than IDA (85%), which was opposite our study, as we identified 72% of the critical problems using VDA and 89% using IDA. The number of serious problems identified using VDA and IDA was the same in [12], which was also the case in our study. Looking at the person hours spent, we found that the VDA method (using the fastest evaluator pair) required about 4 times more person hours than IDA. In the study conducted by [12] the VDA method required 10 times more person hours than IDA, which is a considerable difference compared to our study. In [12] there is no specific information about the steps contained in the analysis, thus the difference in person hours spent can be caused by different approaches. Considering the unique problems experienced by one test participant, we found more of this type of problems using VDA than we did using IDA. If this type of unique problem is considered to be ungeneralizable (or noise), this can be regarded as a positive property of the IDA method. In [12] 76% of the problems only identified using VDA was experienced by one test participant only. In our study 70% of the problems only identified using VDA were experienced by one test participant only. However, 48% of intersecting problems found by both VDA and IDA in our study were also experienced by one test participant only. Thus, the IDA method is able to eliminate a high degree of the noise provided by potential ungeneralizable problems, but not all. Before merging the VDA and IDA problem lists, the IDA problems were given a more serious severity rating than the problems found through VDA. This difference in categorization between the two methods can be caused by the fact that all IDA problems were identified based on the memory of the two evaluators. Thus, these evaluators did not have the precise information about how long time the test participants spent completing the tasks, information which the VDA evaluators had access to via the video material. Another reason can be that the test monitor experienced the user problems in a more direct manner than the video material can offer. The level of detail in the descriptions of VDA and IDA problems differed in our study, where IDA problems were generally described in less detail than the VDA problems. E.g. a specific problem was in the IDA problem list described short, in one line. The same problem was also identified by using the VDA method and described detailed in 10 lines. The VDA problem description also contained the number of participants, who experienced the problem. This observation was also made in [12] and indicates one of the main tradeoffs when applying IDA compared to VDA. The extra person hours spent using VDA also resulted in detailed log files containing
30
additional information on where to find examples of the problems in the video material, information which can prove vital in a redesigning process. Thus, although IDA with less effort performs on par with VDA, when looking at the number of critical and serious problems, the level of detail found applying VDA is less when using IDA. CONCLUSIONS
In this paper we have examined how the efforts spent on identification of usability problem can be reduced when conducting laboratory usability tests and how this has affected the results. The key findings from our study show that we by using IDA were able to considerably reduce the time spent on identification of usability problems. We were able to reveal 68% of the total number of problems using IDA and we found 81% of all problems using VDA. The aim of IDA is to assist in identifying the most severe usability problems in less time, and we found more critical problems using IDA (89%) than we did using VDA (72%). Considering the serious problems we found 76% using IDA and 76% using VDA. Using two evaluators in VDA and IDA we found that IDA required 11.5 person hours and VDA 39.25 person hours. IDA thus fulfills its purpose in revealing the most severe problems in less time than a conventional video data analysis. The problem descriptions provided by IDA, however, provide less detail than the problems described through VDA, and the latter also provides a detailed log covering the video material, which is useful in the process of redesigning the tested system. We also experienced considerable differences in the problem severity categorizations done in VDA and IDA, where the IDA categorizations generally were more severe. Finally we found that IDA was better at filtering out the potential noise created by problems experienced by one participant only. Overall we find IDA very useful in conducting discount user-based usability evaluations. Future Work
Essentially you do not need cameras when applying the IDA method. In the future it would be interesting to study how IDA evaluation would work outside a usability laboratory. It would also be interesting to study how useful the less detailed IDA problem descriptions are in a redesigning process. Another interesting aspect to examine is, what the results would look like, if the steps during the IDA-evaluation were in a reverse order, e.g. if the “reviewing the tasks”step or “reviewing the notes”–step was the first one. REFERENCES
1. Anderson, R.E. Social impacts of computing: Codes of professional ethics. Social Science Computing Review 10, 2 (Winter 1992), 453-469.
2.Andreasen, Morten S. et. al. What Happened to Remote Usability Testing? An Empirical Study of Three Methods.
19. Nielsen, Jakob. Kaufmann.
Usability
Engineering.
Morgan
3. Bias, Randolph G and Mayhew, Doborah J. (ed). CostJustifying Usability. Acedemic Press. 1994.
20. Nielsen, Jakob. Usability Inspection Methods. Conference companion on Human factors in computing systems. 1994.
4. CHI Conference Publications Format. Available at http://www.acm.org/sigchi/chipubform/.
21. Rubin, Jeffrey. Handbook of Usability Testing. John Wiley & Sons, INC. 1994.
5. Conger., S., and Loch, K.D. (eds.). Ethics and computer use. Commun. ACM 38, 12 (entire issue).
22. Schwartz, M., and Task Force on Bias-Free Language. Guidelines for Bias-Free Writing. Indiana University Press, Bloomington IN, 1995.
6. Desurvire, Heather W. Faster, cheaper!! Are Usability Inspection Methods as Effective as Empirical Testing? John Wiley & Sons, INC. Pages 173-202. 1994. 7. Frøkjær, Erik and Hornbæk, Kasper. The Metaphorsof-Human-Thinking Technique for Usability Evaluation Compared to Heuristic Evaluation and Cognitive Walkthrough.
23. Straub, Kath. Pitting Usability Testing against Heuristic Review. UI Design Newsletter – September 2003. http://www.humanfactors.com/downloads/sep03.asp.
8. Hertzum, Morten and Jacobsen, Niels Ebbe. The Evaluator Effect: A Chilling Fact About Usability Evaluation Methods. International Journal of Human Computer Interaction 15(1). Pages 183-204. 2003. 9. Hornbæk, Kasper and Frøkjær, Erik. Evaluating User Interfaces with Metaphors of Human Thinking. User Interfaces for all. Pages 486-507. 2003. 10. Karat, Clare-Marie et. al. Comparison of Empirical Testing and Walkthrough Methods in User Interface Evaluation. SIGCHI conference on human factors in computing systems. 1992. 11. Karat, Clare-Marie. Usability Engineering in Dollars and Cents. 1993. 12. Kjeldskov, Jesper et. al. Instant Data Analysis: Conducting Usability Evaluations in a Day. 13. Mackay, W.E. Ethics, lies and videotape, in Proceedings of CHI '95 (Denver CO, May 1995), ACM Press, 138-145. 14. Medlock, Michael C. et. al. Using the RITE Method to Improve Products; a Definition and a Case Study. 15.Nielsen, Jakob. Finding Usability Problems Through Heuristic Evaluation. Proceedings of the SIGCHI conference on Human factors in computing systems. 1992. 16. Nielsen, Jakob. Guerilla HCI: Using Discount Usability Engineering to Penetrate the Intimidation Barrier. http://www.useit.com/papers/guerrilla_hci.html. 1994. 17.Nielsen, Jakob and Molich, Rolf. Heuristic Evaluation of User Interfaces. Proceedings of the SIGCHI conference on Human Factors in computing systems: Empowering people. 1990. 18.Nielsen, Cristian Monrad et. al. It’s Worth the Hassle! The Added Value of Evaluating the Usability of Mobile Systems in the Field. NordiCHI 2006.
31
32
B. Research Paper 2
ȱ
33
ȱ ȱ ȱ
34 ȱ
Comparison of Remote Asynchronous Methods for User Based Usability Testing – an Empirical Study Anders Bruun, Peter Gull, Lene Hofmeister Department of Computer Science, Aalborg University Fredrik Bajers Vej 7, 9220 Aalborg East
[email protected],
[email protected],
[email protected]
ABSTRACT
When conducting conventional think-aloud based usability tests in a laboratory many resources (time and money) are required. In this paper we have examined a branch of usability tests called remote asynchronous testing methods. The main idea behind these methods is that users complete a set of tasks at home, work or wherever appropriate. Without the presence of a usability expert the users themselves describe and report the experienced problems, hereby saving resources for conducting the user-based test and analyzing the results. In this paper we have compared three methods for remote asynchronous usability testing and used a conventional laboratory think-aloud based test (Lab) as a benchmark. The three methods are User Critical Incident Reporting (UCI), online reporting and discussion through a forum (Forum) and longitudinal user reporting through a diary (Diary). By using these three methods we have identified half the number of critical problems via each method in much less time than the Lab. By combining the results from the three asynchronous methods, we were able to identify almost the same number of critical problems as the Lab in less than half the time. Keywords
Remote testing, asynchronous testing, usability, empirical study INTRODUCTION
Usability testing in a traditional lab setting is known to be very demanding in terms of time and money spent on planning, conducting the test and getting the participants to the laboratory [6, 7, 18, 19, 20]. Even more resource demanding is the task of performing posttest analysis in which hours of video material showing test participants’ interaction with given software or hardware systems rigorously is walked through to identify usability problems [14]. When developing for global markets the expenses for bringing test participants to a laboratory rises even further. We have experienced this first hand, as a local Danish company developed a system for an American customer. We had to conduct usability tests on the system, but it was not possible for us to do so using future users because of the geographic distance. The system dialogs and manual had to be translated into Danish, which, besides from taking time, also had the potential of not uncovering
usability problems caused by the American formulations and use of words. The cultural background of the participants also differed from that of the future users. As shown under the related work section many have done research in the field of remote usability testing, which can be divided into synchronous and asynchronous methods. In a remote synchronous setting, the test participants and evaluators are separated in space only [4]. This can be accomplished by utilizing video capture software where, for instance, the content of the test participants’ screen is sent directly to the test monitor residing in a remote location [1, 2, 4, 7, 9, 11]. However, using a remote synchronous setting, the evaluators still need to be present in real time to conduct the test, and the results need to be processed by evaluators in a posttest analysis. Thus, this method is almost equally as resource demanding as a traditional lab test setting (except for participants’ traveling expenses) [7]. In a remote asynchronous setting the test participants and evaluators are separated in space and time [4]. Applying this setting, the evaluators no longer need to be present in real time. The test participants for instance solve a number of tasks, perhaps in their own environments, using the software or hardware to be tested. As shown in the related work section, various remote asynchronous methods are applied in the literature. From a resource saving perspective, the most interesting of these remote asynchronous approaches involve those where non usability experts solve tasks and report usability problems on their own. If this is possible to accomplish, the resources spent conducting usability testing, seem to be as low as possible while still being user based. In this article we examine if users are able to identify and report usability problems on their own in a remote asynchronous setting and what effect this has on the number of problems identified and time spent conducting tests in asynchronous conditions. This paper is structured as follows: Studies concerning asynchronous remote methods are presented under related work. The method and results from our study comparing three different remote methods are presented. In the discussion section our results are compared to those from related work after which we conclude upon our findings.
35
RELATED WORK
We have conducted a study of literature to reveal earlier research concerning remote asynchronous usability test. We wanted to examine earlier research, in order to determine lack in the applied methods, which could be the subject for further investigation. The articles included here are all based on empirical studies of the use of one or more particular remote asynchronous methods for usability testing. Thus articles, which only briefly outline remote asynchronous usability testing, for instance only mentioning it under related work sections, are not included. We have searched the following databases: ACM digital library, Article First, EBSCO, Engineering Village, Scopus, Highwire Press, IEEE Xplore, Ingenta Connect, JSTOR, Norart, SAGE Journals online, Springer Link, ISI Web of knowledge, Wiley Interscience and Google Scholar. The keywords we used in our search was: “Remote usability” and “Asynchronous usability”. The relevant articles found through this search were all read, and the references made by these to other related articles were also read and included. By doing this we have identified 22 articles. Table 1 gives an overview of these. Remote Asynchronous Method Traditional Lab
[1, 4, 15, 21, 22, 27, 28, 30, 31, 33, 34]
Usability Expert Inspection [3, 4, 5, 10, 11, 25, 26, 34] No Comparison
[8, 13, 16, 24, 32]
Table 1. Overview of identified articles in which remote asynchronous usability testing methods are applied empirically, and which comparisons are made.
As shown in table 1, 17 of these are empirical studies which compare different remote asynchronous methods. These articles each compare the results of one single remote asynchronous method with either traditional laboratory evaluation, usability expert inspection or both. [4] is the only one of the articles comparing multiple asynchronous methods. This comparison, however, is a cost-benefit comparison graph based on intuition and not empirical data. The remaining five of the 22 articles are documenting empirical studies, which apply, but do not compare the applied asynchronous methods, see [8, 13, 16, 24, 32]. In the following we describe the remote asynchronous methods applied in the 22 identified articles. We also describe how they are applied and the main results. Table 2 gives an overview of these methods.
36
Method: Auto logging
Article # [16, 24, 25, 26, 30, 31, 32, 33]
Interview
[8, 22, 25, 26, 31]
Questionnaires
[8, 15, 21, 24, 25, 26, 28, 30, 31, 32, 33]
User-reported Critical Incident [1, 3, 4, 5, 10, 11, 27] Method Unstructured Problem Reporting [8, 15, 34] Forum
[17]
Diary
[27]
Table 2. Methods applied for remote asynchronous usability testing. Auto Logging, Interviews and Questionnaires
Auto logging is a method where quantitative data like visited URL history and the time used to complete tasks are collected in log files and later analysed. The main results from [16, 24, 25, 26, 30, 31, 32, 33] indicate that this method by itself can show, e.g. if the paths to complete tasks are well designed. Although useful for that purpose the method is lacking the ability to collect the qualitative data needed to address usability issues beyond the likes of path finding and time used. This is why this method is combined with questionnaires and/or interviews as follow-ups. The results of [26] show that the auto logging method in this case found “many of the same problems” compared to the heuristic inspection. In [25] the evaluators identified 60% of the problems found via a heuristic inspection, this was, however, done over a period of about two months, which was also the case in [26]. In [33] the auto logging method is said to be “not too efficient” compared to the traditional lab setting. In both [33] and [26] there are not given any information about the total number of problems identified by the applied auto logging methods. The results of [30] show, that the evaluators identified 40% of the usability problems via the auto logging method compared to a traditional lab test setting. User-reported Critical Incident Method
The idea behind UCI is to get users to report their experienced problems themselves. This should ideally relieve the evaluators from any work conducting tests and analysing results. The main results from these studies show that test participants are able to report their own critical incidents. Castillo shows in [4] that a minimalist training approach works well for training participants in identifying critical incidents. There are different opinions about participants’ ability to categorize the incidents. The results found by [1] indicate that participants are not good at categorizing the severity of critical incidents whereas the results from [4, 5] indicate the opposite. In this regard it should be mentioned, that the training conducted by [3, 4, 5] is more
elaborate than the one conducted by [1], which could influence the categorization results. The training conducted by [4, 5, 27] was furthermore done in physical presence with the researchers. The total number of usability problems identified varies for the different studies. In [4] they used 24 test participants who identified 76% of the usability problems identified by experts. The results of [27] show that 10 test participants identified 60% of the problems found in a traditional lab setting. In [1] 6 non-expert test participants were able to identify 37% of the usability issues found in a traditional lab setting. Unstructured Problem Reporting
The method of unstructured problem reporting is shortly described in [8, 15, 34]. Common for the method used in these three articles is that the participants were asked to take notes on the usability problems and other problems they encountered during completion of a set of tasks. The authors of these articles give no information about the predetermined content they wanted the participants to write down, if any. The results in [34] shows that 9 participants identified 66% of the usability problems using this kind of reporting. The researchers recommend a more structured approach to support reporting of even more usability problems, an approach more like the UCI method. The results of the study in [15] show that 8 test participants identified 50% of the total usability “issues” using the unstructured approach compared to a traditional lab setting. The results in [15] cover both negative and positive usability issues, and there is no information of how many of these reported issues are negative. The comparison done in [15] is also based on tasks, where the participants in the remote asynchronous setting solved instructional tasks and the participants during the lab setting solved exploratory tasks, an “unfair” difference which the authors themselves do take note of. Forum
In [16] the main method used is auto logging, and the forum is used as a source for collecting qualitative data. The researchers did not encourage the participants specifically to report usability issues in the forum. Even though this was the case, the participants still reported detailed usability feedback. There is no information about user training or the number of usability problems reported in the forum. The reason can be that the purpose of [16] is not to evaluate the use of a forum for reporting usability problems per se. [27] also addresses the issue of motivating the participants to report problems by making the reporting a collaborative effort amongst participants. The author of [27] believes that participants through collaboration may give input which increases data quality and richness compared to the UCI method. Hence, the forum seems to be a promising remote asynchronous tool for this purpose.
Diary
In [26] the primary method applied is auto logging, and diaries written by the participants on a longitudinal basis provide qualitative information. There is no information about the usefulness of the method or about the good or bad experiences with it. What is mentioned is that participants through the diaries on a longitudinal basis report on the usability problems they experience with the use of a particular hardware product. It would be interesting to experiment with the use of diaries as a standalone method to see, if the longitudinal properties will enhance participants ability to report usability problems on their own. Concluding on the identified related articles, we have not found anyone with the purpose of comparing multiple remote asynchronous methods, except for [4], which is not based on empirical studies. Additionally, few of the papers focus on the resources required to use the methods. To answer our research question and to fill the gaps in related work, we have chosen to compare three of the seven presented asynchronous methods. METHOD
The three asynchronous methods chosen are compared to each other using a conventional laboratory test as a benchmark. The methods chosen for comparison are: • • • •
Laboratory testing (Lab) User-reported Critical Incident (UCI) Online reporting and discussion through a forum (Forum) Longitudinal user reporting through a diary (Diary)
In the rest of this section we first describe the aspects that are common for all four methods and subsequently the aspects unique to each method are described. Participants
A total of 40 test subjects participated, ten for each condition. Half of the participants were female and the other half male. All of them studied at the University of Aalborg and were between 20 and 30 years of age. Half of them were taking a non-technical education (NT) and the other half was taking a technical education (T). For all test conditions the participants were distributed as follows: 3 NT females, 2 T females, 2 NT males and 3 T males. Most of the participants reported medium experience in using IT in general and an email client. Two participants reported themselves as being beginners to IT in general and had medium knowledge of using an email client. None of the participants had previous knowledge about usability testing. Training
The test subjects participating in the remote asynchronous sessions were trained in the identification and categorisation of usability problems. This was done using a minimalist approach and was strictly remote and
37
asynchronous. All our test subjects received written instructions via email, explaining through descriptions and examples what a usability problem is, how it is identified and how it is categorised. Categorisation was divided into “low”, “medium” and “high”, corresponding to the traditional cosmetic, serious and critical severity categorizations [1]. Furthermore they were instructed in how to report back depending on the condition in which they participated. In general the participants have found the training material to be helpful and easy to understand. System
We evaluated the email client Mozilla Thunderbird version 1.5, which [1] also evaluated in their work. The test participants had never used Mozilla Thunderbird. Tasks
All participants had to solve the following tasks: 1. 2. 3.
4.
5. 6. 7. 8. 9.
Create a new email account (data provided) Check the number of new emails in the inbox of this account Create a folder with a name (provided) and make a mail filter that automatically moves emails that has the folder name in the subject line into this folder Run the mail filter just made on the emails that were in the inbox and determine the number of emails in the folder Create a contact (data provided) Create a contact based on an email received from a person (name provided) Activate the spam filter (settings provided) Find suspicious emails in the inbox, mark them as spam and check if they were automatically deleted Find an email in the inbox (specified by subject line contents), mark it with a label (provided) and note what happened
We have chosen the same tasks as [1]. Laboratory Testing (Lab) Setting
Procedure
The procedure followed the guidelines of [23]. The authors did not conduct the test. The participants were introduced to the test sequence and the concept of think-aloud by the test monitor. We had scheduled one hour per participant including post-test interview and switching participants. The interviews were also done by the test monitor. The participants had to solve the nine tasks shown above, during which they had to think aloud. The test monitor was given a timeframe for the completion of each task, and had the participants not solved a task in this time, they received help from the test monitor to make sure all tasks were completed. Data Collection
Video of the test participants’ desktop was recorded along with video showing the participants’ face. The test participants’ and test monitor’s speech were also recorded. User-reported Critical Incident Method Setting
In all of the remote asynchronous methods the participants sat at home using their own computer. The participants had the possibility to do the tasks whenever they wanted; it just had to be completed before a specified date. When they started the tasks they had to finish them all at one sitting. Procedure
The participants were asked first to go through the training material, install Mozilla Thunderbird and then begin task completion. We sent all users a guide on how to install and uninstall the program. The participants were instructed to report any negative critical incident they might find both major and minor, as soon as they discovered it. This was done using a web based report form, which we programmed using PHP, JavaScript and a MySql database. The form content was mainly the same as that used by [3] and [27]. We added the second question in the form. The following questions had to be answered using this form: •
What task were you doing when the critical incident occurred?
•
What is the name of the window in which the critical incident occurred?
•
Explain what you were trying to do when the critical incident occurred.
•
Describe what you expected the system to do just before the critical incident occurred.
Figure 1. Overview of the usability laboratory.
•
In room A the test participant sat in front of the computer and next to her/him sat a test monitor whose primary task was to make sure that the test participants were thinking aloud. The room was equipped with cameras, a microphone and a one-way mirror to room C, from which the camera equipment etc. could be controlled.
In as much detail as possible, describe the critical incident that occurred and why you think it happened.
•
Describe what you did to get out of the critical incident.
•
Were you able to recover from the critical incident?
The Lab test was conducted in a usability laboratory and the setting can be seen in figure 1.
38
•
Are you able to reproduce the critical incident and make it happen again?
•
Indicate in your opinion the severity of this critical incident.
The participants were also asked to create a time log over the time spent completing each task and mail this log to us. Accompanying every task was a hint, which gave the test participants the ability to check whether or not they had solved the tasks correctly. Data Collection
In the bottom of the online form was a submit button. When pressing this button the data was saved in an online database and the form was reset, ready to enter a new entry. The form had to run in a separate browser window, requiring the participants to shift between windows each time they encountered a problem. [10] integrated an incident reporting button directly into the tested application, which also served as a constant reminder of the reporting option. This seems like a good idea, but requires extra resources to implement. The results of [27], however, indicate that the two-windowed approach works as well.
Each participant was given the following instructions: A) Check if the given usability problem already exists. B) If the problem does not exist then add a problem description and a severity categorization. C) If the problem is already mentioned, then comment on this either by posting an agreement with the problem description and categorization or state a disagreement with a reason indicating why either description and/or categorization is wrong. We encouraged all participants to post and discuss the usability problems. We wanted to make posting as easy as possible, which is why we supplied every test participant with an example of how to create a post in the forum, and we also gave an example of the content, we wanted them to submit. We made sure that all participants submitted their problem descriptions and comments in an anonymous fashion. In doing so we hoped to receive even the minor usability problems, which participants, if not anonymous, would not have submitted because of embarrassment. The latter is also supported by [13]. Data Collection
The data collection procedure for this method is very simple since the forum in itself is a data collection tool. All information was written in the forum.
Forum Procedure
Diary Procedure
The participants were asked to go through the training material first and then install Mozilla Thunderbird. After installing the program the participants were asked to first take notes on the usability problems they experienced during completion of the tasks and also to categorize the severity. We encouraged them to use a word processor and not pen and paper for the note taking. They were given a list describing what we wanted them to consider when writing the problems. This list was derived from the questions used in the UCI condition. As with the UCI condition the participants were asked to finish all tasks at one sitting and to create a log over the time taken to finish each task. Accompanying every task was a hint, which gave the test participants the ability to check whether or not they had solved the tasks correctly. After completion of the tasks the test participants were instructed to uninstall Mozilla Thunderbird to keep the experiment from getting longitudinal. They were then to logon to the forum using the name and password supplied in the instructional e-mail to post and discuss their experienced usability problems with the other participants in this condition. They were given a week to post and discuss problems with each other in the forum.
The participants were, just like in the UCI and Forum conditions, asked to go through the training material first, and then install the program using the supplied installation guide. The ten participants were given a timeframe of five days to write experienced usability problems and severity categorizations in their diary. We provided the same list of elements to consider as those participating in the forum condition. They were also asked to create a time log over the time taken to finish each task. We did not force any formal content structure, as that described under UCI.
When creating a new topic in the forum the participants were asked to create a subject header, which clearly expressed the core factors of the problem, thereby making it easier for other participants to see if their problems were equivalent to those already posted. Posting was allowed by all of the ten selected participants.
Data Collection
On the first day the participants received the nine tasks which were also given to all other participants. We instructed them to complete those nine tasks on the first day, and then to email the experienced problems and time log to us immediately after completion. Accompanying every task was a hint, which gave the test participants the ability to check whether or not they had solved the tasks correctly. During the remaining four days the participants received new tasks to complete on a daily basis. Because we had to compare methods, the new tasks resembled those nine tasks used in all other methods. That is, we avoided tasks that required functionality not used in the other tasks. The participants were encouraged to use a word processor to write the diary and not pen and paper. As mentioned above we instructed the participants to e-mail the diary notes immediately after completion of the first nine tasks. We verified that we had received notes from all ten
39
participants, but did not read the notes until all data were collected from every method. After the remaining four days we received all notes on usability problems and severity categorizations from the ten participants. Data Analysis
problem list (Pjc). The joining of the lists is illustrated in figure 2. Each evaluator checked if their problems from their individual complete problem lists (P1c, P2c, P3c) were present in the complete joined problem list (Pjc), which they were.
The data analysis was conducted by the three authors of this article. Each evaluator analyzed all data from all of the test conditions. The data consisted of 40 data sets, 10 for each of the four test conditions. All data was collected before conducting the analysis. Each data set was then given a unique identifier, and a random list was made for each evaluator, showing the order in which to do the analysis. Each evaluator individually analyzed all the data sets one at a time. Video Data Analysis
The video data from the laboratory test was thoroughly walked through. Every usability problem identified was described and categorized as cosmetic, serious or critical. They were also given a unique identifier to make backtracing of the problems possible. User-reported Data Analysis
The data from the user-reported test conditions (UCI, Forum and Diary) was read one problem at a time. Only using the information available in the users’ problem descriptions, the descriptions were translated into conventional usability problem descriptions. If necessary, Mozilla Thunderbird was used to get a better understanding of the problems. A unique identifier was also added to the problem descriptions. If a user problem description could not be translated into a meaningful problem description in short time, or we could not identify the problem area using Thunderbird, the problem was not included in the problem list. When analyzing forum descriptions, previous problem descriptions by other users in the same forum thread, was also included in the analysis, if they could contribute with anything to the description. During the analysis we categorized the problems submitted by the users, as we wanted to make sure that categorization was done in the same way in all tests, to make a valid base for comparison. Furthermore some problems were not categorized by the users at all. Merging of Problem Lists
When each evaluator had created a problem list for each data set, they joined the lists for each of the four test conditions (P1Lab, P1UCI…P3Diary). These lists were then joined to form a complete problem list for each evaluator (P1c, P2c, P3c). Together the three evaluators joined their individual lists for each test condition (PjL, PjU, PjF and PjD). Negotiating a joined list was done discussing each problem to reach an agreement. Categorization of problems in the joined lists was done using the most serious categorization. These joined lists for each test condition were then joined to form a complete joined
40
Figure 2. Joining of problem lists from each evaluator’s individual problem lists for each condition (P1L, P1U…P3D) to the complete joined problem list (Pjc) and complete individual problem lists (Pic). Evaluator Effect
Hertzum and Jacobsen [12] have shown that two evaluators will not find the exact same usability problems. To verify the agreement between evaluators on the usability problems, the evaluator effect has been calculated using any-two agreement. The any-two agreement shows to what extend the evaluators have identified the same problems. This has been done using equation 1 [12].
Average of
Pi ∩ Pj
1 over all n(n − 1) pairs of evaluators 2 Pi ∪ Pj
Equation 1. Calculating the evaluator effect using any-two agreement. Pi is the number of problems found by evaluator i, Pj is the number of problems found by evaluator j and n is the number of evaluators.
The evaluator effect has been calculated on the problem lists from each test method and on the combined problem lists. Table 3 shows the average any-two agreement for all of the test conditions and for the entire test. Lab Problems agreed on Number of problems Any-two agreement
UCI Forum Diary Avg.
23.3
9
8
17.7
14.5
46
13
15
29
25.8
50.7% 69.2% 53.3% 60.9% 56.3%
Table 3. The average any-two agreement between the evaluators for all test conditions.
Compared to Hertzum and Jacobsens findings [12] our any-two agreement is high. For think aloud tests their anytwo agreement calculated on problem lists for three different experiments varied from 6% to 42% (avg. 18,1%, SD=20,5), whereas ours was 50,7%. Our average any-two agreement is 56,3% (SD=8,45 between the four conditions).
RESULTS
In this section we present our findings from the study. We start by presenting the main results. Next we present additional results such as task completion, task completion time, unique problems, problems found using one evaluator, differences in severity categorizations between the evaluators and test participants and finally we present the differences in the identified problems. Comparison of Number of Problems Identified and Time Spent on Analysis
In this section we give a short overview of the main results, and subsequently we compare all the conditions with respect to the number of problems identified and the time spent performing analysis. An overview of the problems identified can be seen in table 4. Using all four conditions we were able to identify a total of 62 usability problems. 21 of these were critical, 17 serious and 24 cosmetic.
Task completion time in minutes: Average (SD)
Lab
UCI
Forum
Diary
N=10
N=10
N=10
N=10
24.24 (6.3)
34.45 (14.33)
15.45 (5.83)
Tasks 19: 32.57 (28.34)
Usability problems:
#
%
#
%
#
%
#
%
Critical (21)
20
95
10
48
9
43
11
52
Serious (17)
14
82
2
12
1
6
6
35
Cosmetic (24)
12
50
1
4
5
21
12
50
Total (62)
46
74
13
21
15
24
29
47
Table 4. Number of identified problems and task completion time using the Lab, UCI, Forum and Diary methods.
Table 5 gives an overview of the person hours spent performing analysis in the Lab, UCI, Forum and Diary conditions. All timings are the sum for all three evaluators. 55 hours and 3 minutes were spent on conducting the Lab test, analysing the results and merging the problem lists from the three evaluators. The total time spent on analysis and merging of problem lists in the UCI condition was 4 hours and 33 minutes, 5 hours and 38 minutes for the Forum condition and 14 hours and 36 minutes for the Diary condition.
Conducting test
Lab (46)
UCI (13)
Forum (15)
Diary (29)
10 h
0h
0h
0h
Analysis
33 h 18 min 2 h 52 min 3 h 56 min 9 h 38 min
Merging problem lists
11 h 45 min 1 h 41 min 1 h 42 min 4 h 58 min
Total spent
time 55 h 03 min 4 h 33 min 5 h 38 min 14 h 36 min
Avg. time per 1 h 12 min problem
21 min
23 min
30 min
Table 5. Person hours spent on conducting tests, analyzing the results and merging problem lists. The average time spent identifying each problem under the different conditions is also shown. The numbers in parentheses are the total number of problems identified under each condition. Lab Lab
UCI P