Use of Body-Surface Potential Mapping and Computer Model Simulations for Optimal Programming of Cardiac Resynchronization Therapy Devices R Mohindra, JL Sapp, JC Clements, BM Hor´acˇ ek Dalhousie University, Halifax, Nova Scotia, Canada Abstract
One possible non-invasive method for evaluating ventricular electrical synchrony during different pacing modes is body-surface potential mapping (BSPM). It requires the placement of at least 100 electrocardiographic leads on the patient torso, in a variety of configurations. Because of the increased spatial resolution, BSPM provides a comprehensive three-dimensional picture of cardiac electrical activity that is not possible with the conventional 12-lead electrocardiogram (ECG). Moreover, it is possible to incorporate patient-specific torso geometry from computed tomography (CT) scans and calculate activation sequences (depicted as isochrones of activation times) on the epicardial surface of the heart. Epicardial potential maps and isochrones can be used to asses the electrical synchrony of the ventricles and are, therefore, valuable tools for determining the optimal inter-ventricular pacing delay.
It has been proposed that by optimizing the timing of activation between the ventricles (V-V interval), with the aid of body-surface potential mapping (BSPM), the success rate of cardiac resynchronization therapy (CRT) devices could be improved. We recorded 120-electrode BSPM data and CT scans from two patients with implanted CRT devices and calculated, by means of electrocardiographic inverse solution, epicardial potentials and isochrones of activation for different V-V intervals. To gain better insight, we used a computer model of ventricular activation to simulate activation isochrones for CRT pacing. As a measure of inter-ventricular synchrony for a variety of V-V settings we used the area between the LV and RV percent surface activated curves. We have demonstrated that by aiming to minimize dyssynchrony in ventricular activation patterns, an optimal CRT pacing V-V interval can be selected. The computer model simulations provided a baseline measure by which our measure of synchrony can be evaluated.
1.
2.
Body-surface potential recordings were performed on two patients with implanted Medtronic CRT devices (InSync III and Concerto) at the QEII Health Sciences Centre in Halifax. Ethics approval was obtained from the Research Ethics Board. One hundred and twenty disposable radiolucent Ag/AgCl surface electrodes (FoxMed, Idstein, Germany) were attached to the patients’ torso in the Dalhousie mapping configuration. The V-V timing was varied from L80R (indicating LV lead activation, 80 ms delay and then RV lead activation) to R80L. 15 seconds of recording was done for each setting. Data were acquired via a custom acquistion system (BioSemi, Amsterdam, The Netherlands) at 2000 Hz and digitized with 16-bit quantization. All recordings were stored off-line for later analysis. Axial CT scans of the upper torso were performed for each patient using a Siemens SOMATOM Sensations 64slice CT scanner (Siemens Medical, USA) at the QEII Health Sciences Centre. The spacing between each scan was 1 mm and the resulting images were stored in the DICOM format for analysis with Amira 4.0 software (Mer-
Introduction
Many patients with heart failure have an underlying abnormality in the cardiac conduction system [1], such that the timing of the ventricular contractions becomes dyssynchronous, which further impairs cardiac output [2]. In these cases, restoration of ventricular synchrony is accomplished by use of an implantable pacemaker, which activates both ventricles in a process known as cardiac resynchronization therapy (CRT) or biventricular pacing (BVP). While CRT is successful in many cases, at least 30% of patients do not respond to CRT [3]. Recently, it has been proposed that if the ventricles are paced sequentially (VV timing), instead of simultaneously, the ventricular synchrony of the heart can be further improved. This could help to maximize the mechanical efficiency of the heart, allowing more patients to benefit from CRT [4].
ISSN 0276−6574
Methods
69
Computers in Cardiology 2007;34:69−72.
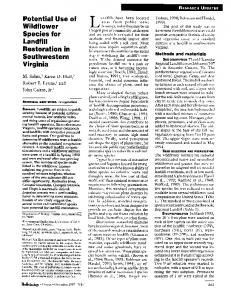
100 90 80
Surface activated (%)
70 60 50 LV RV
40 30 20 10 0 0
20
40
60
80
100
120
140
Time (ms)
Figure 1. Percent surface activated curves from simulated LBBB and ischemia during non-paced activation. The curves represent the percent of the epicardial surface area that has been activated at each given discrete time point.
Figure 2. Isochrones of activation from patient #1 for LV only, RV only, R24L and L24R pacing. Time scale in milliseconds in shown in centre. Grey dots correspond to the pacing tips.
cury Computer Systems, Chelmsford, MA). The torso and epicardial surfaces were segmented and triangulated in a fashion that mimicked the Dalhousie standard torso and heart models using custom Matlab algorithms (Mathworks Inc., Natick, MA) [5], and the epicardial surface was divided into LV and RV sections. The location of the pacing tips was derived from the CT scans. Patient #1 had an anterior LV pacing lead, while patient #2 had a more optimal postero-basal LV location of pacing lead. The raw BSPM recordings were interpolated for leads with artifactual noise and to eliminate artifact from the second pacing stimulus. The inverse problem of electrocardiography was solved using the least-squares minimization problem and second-order Tikhonov regularization. The regularization parameter was obtained using the Lcurve method. In some cases, the second-order regularization provided unstable solutions, so zero-order regularization was utilized. For comparison, the inverse solution was performed using both a standard and a patient-specific geometry set [6, 7]. From the time-sequence of epicardial potentials (electrograms), isochrones of activation were derived using the steepest negative slope method. Dyssynchrony was assessed by a measure of the area between the LV and RV percent surface activated curves, referred to as ∆PSAC (see Fig. 1). Minimizing this measure provides an indication for which CRT setting is best at minimizing dyssynchrony. This quantitative measure was computed for a number of CRT settings for each patient in the study. Next, computer simulations of CRT pacing were performed using the hybrid version of Dalhousie heart model [8]. This bi-domain anisotropic model consists of 2.5 million cells and incorporates a realistic conduction system, composed of a His-bundle, left and right branches and Purkinje fibres. Pacing stimulus locations were placed in
positions analogous to the lead tip positions in each of the patients. Heart failure was simulated by interrupting the conduction system to induce left-bundle-branch block (LBBB). Slowed conduction was introduced to simulate ischemic conditions. The heart model was also used to simulate fusion pacing. ∆PSAC was calculated and then compared with the results derived from the clinical recordings.
3.
Results
Figure 2 shows a panel view of isochrones from patient #1. This example shows that the earliest activation occurs near the epicardial pacing site for epicardial LV-only pacing. Activation on the RV is delayed for endocardial RVonly pacing because of the epicardial breakthrough time. CRT pacing changes the activation pattern substantially. This is reflected in the synchrony measure for CRT pacing: ∆PSAC results shown in Fig. 3 demonstrate that CRT pacing reduces dyssynchrony and this measure suggests an optimal V-V setting. It is also noted that in patient #2, minimal inter-ventricular dyssynchrony was present near simultaneous pacing, negating the search for an optimal setting. Similar activation patterns can be seen with greater resolution from the heart model simulations. The elliptical spread of the wavefront, caused by the anisotropic properties of the myocardium, is observed very clearly (not shown). The ∆PSAC values derived from the heart model also demonstrate a similar trend when compared to the clinical recordings, more notably with patient #2. The magnitudes of ∆PSAC for the heart model simulations were considerably smaller than those for the clinical recordings, suggesting that patient-specific heart fail-
70
4500
5000
Heart model Clinical recording − standard geometry Clinical recording − custom geometry
4000
4000 Area between curves (∆ PSAC)
3500 3000
∆ PSAC
2500 2000 1500 1000 500 0
2000 1000 0 −1000 −2000
R
R72L
R60L
R48L
R36L
R24L
R12L
R00L
L12R
L24R
L36R
L48R
L60R
L
L72R
LBBB
Normal
Pacing Mode −500
3000
Pacing Mode −3000
Figure 3. Area between LV and RV percent activated curves (∆PSAC) for patient #1
Patient #1 Patient #2
L60 L48 L36 L24 L12 00L 12L 24L 36L 48L 60L
Figure 5. Area between LV and RV percent activated curves (∆PSAC) for fusion pacing simulations 5000 Heart Model Clinical recordings − standard geometry Clinical recordings − custom geometry
4000
sualize the effects of CRT pacing. The quantitative measure based on the area between the percent surface activated curves, ∆PSAC, was used to predict which pacing interval was optimal for reducing electrical dyssynchrony. ∆PSAC correlated well with Esyn , the measure proposed by Ramanathan et al. [9]. It is not clear from the results whether a standardized torso is sufficient or if the accuracy of patient-specific geometry is required. The Dalhousie computer heart model was used to mimic heart failure conditions (LBBB and ischemia) and pacing simulations demonstrated that the heart model could be a valuable tool for predicting CRT response. It was also used to simulate fusion pacing, which may be the future of CRT pacing algorithms. Simulations of fusion pacing in an anatomically realistic heart model have not been reported before. Two key observations can be made from this investigation. The first is the influence of pacing locations on reducing dyssynchrony. Placing the LV pacing tip on the postero-basal section of LV and pacing both leads simultaneously helps to greatly reduce dyssynchrony without the need for optimal programming of the delay. This suggests that in patients with optimal lead placement, programming of the V-V timing may not be necessary [10]. This also applies to fusion pacing, which is an ideal pacing mode, since it only requires delivering one stimulus, possibly prolonging the device’s lifespan. The second key observation is that a relationship between electrical dyssynchrony and mechanical performance needs to be established. As we have shown, CRT pacing induces an electrical pattern of activation that can be used to reduce electrical dyssynchrony between the ventricles, but our BSPM do not provide any information about how these patterns improve cardiac output, which is the true goal of CRT. Echocardiographic studies will be required to show how measures of
3000
∆ PSAC
2000
1000
0
−1000
−2000
−3000
R
R50L
R40L
R30L
R20L
R10L
R00L
L10R
L20R
L30R
L40R
L50R
L
LBBB
Normal
Pacing Mode −4000
Figure 4. Area between LV and RV percent activated curves (∆PSAC) for patient #2 ure was not captured in the model setup. This was true for the interrupted LBBB or when the LBBB was removed with slowed conduction. Figure 5 shows the results from the fusion pacing simulations. Dyssynchrony, as measured by ∆PSAC, is reduced by a similar magnitude when compared to CRT pacing. In the case of patient #2, who has a postero-basal LV lead, a substantial reduction in dyssynchrony occurs at the L24 setting (LV is paced 24 ms before intrinsic RV activation starts). Patient #1, who has the anterior pacing location, does not have the same reduction in dyssynchrony as patient #2.
4.
Discussion and conclusions
Using BSPM recordings, isochrones of activation in response to CRT pacing were derived using patient-specific torso and epicardial geometry from two patients suffering from heart failure. Our method of presenting LV and RV activation progression (the percent surface activated curves) was shown to be a simple and intuitive way to vi-
71
dyssynchrony correlate with cardiac performance [11, 12]. There were some other limitations to this study to consider. The inverse solution algorithm yields an estimate of the epicardial potential distribution. The error in the estimate can be influenced by lead position, geometry accuracy and recording noise [13]. We found that it was difficult to correlate the heart model results with the clinical recordings. Heart failure is a complex condition and capturing the idiopathic variations in conduction block and ischemia for each patient is a daunting task [14]. Using BSPMs to evaluate the optimal setting for CRT devices is an intricate process. The results presented here constitute an important step toward the goal of clinical use of BSPMs and are a good indicator of the potential that this approach has. It would be premature at this time to speculate how successful this technique would be at improving patient response. Clearly, there are a considerable number of factors that need to be considered before this method can be used routinely. However, with a careful approach in future research projects, it seems feasible that both the BSPM and the heart-model simulations could be valuable tools to help optimize resynchronization therapy.
[7]
[8]
[9]
[10]
[11]
[12]
[13]
Acknowledgements [14]
The authors would like to acknowledge the financial support from the Canadian Institutes of Health Research, the Nova Scotia Health Research Foundation and Medtronic Inc.
Address for correspondence: B. Milan Horacek 4-P1 Sir Charles Tupper Medical Building 5859 University Avenue Halifax, Nova Scotia Canada B3H 4H7
[email protected]
References [1]
[2]
[3]
[4]
[5] [6]
Barr RC, Ramsey M, Spach MS. Relating epicardial to body surface potential distributions by means of transfer coefficients based on geometry measurements. IEEE Trans Biomed Eng 1977;24(1):1–11. Praught J. A Hybrid Model for Propagation of Activation in Human Cardiac Tissue. M.Sc. thesis, Dalhousie University, Halifax, Nova Scotia, Canada., 2006. Jia P, Ramanathan C, Ghanem RN, Ryu K, Varma N, Rudy Y. Electrocardiographic imaging of cardiac resynchronization therapy in heart failure: observation of variable electrophysiologic responses. Heart Rhythm 2006;3(3):296–310. Lieberman R, Padeletti L, Schreuder J, Jackson K, Michelucci A, Colella A, Eastman W, Valsecchi S, Hettrick DA. Ventricular pacing lead location alters systemic hemodynamics and left ventricular function in patients with and without reduced ejection fraction. J Am Coll Cardiol 2006; 48(8):1634–1641. Gardner M, Sapp J, Horne G, Hor´acˇ ek B. Cardiac Electromechanical Coupling in Resynchronized Heart Failure: EMPRESS study protocol, 2006. Unpublished. Punske BB. Cardiac resynchronization therapy: finding the true meaning of synchrony. Heart Rhythm 2006;3(3):311– 312. Huiskamp G, van Oosterom A. Tailored versus realistic geometry in the inverse problem of electrocardiography. IEEE Trans Biomed Eng 1989;36(8):827–835. Rodriguez B, Trayanova N, Noble D. Modeling Cardiac Ischemia. Ann NY Acad Sci 2006;1080:395–414.
Auricchio A, Spinelli JC, Trautmann SI, Kloss M. Effect of cardiac resynchronization therapy on ventricular remodeling. J Card Fail 2002;8(6 Suppl):S549–55. Leclercq C, Kass DA. Retiming the failing heart: principles and current clinical status of cardiac resynchronization. J Am Coll Cardiol 2002;39(2):194–201. Abraham WT, Fisher WG, Smith AL, Delurgio DB, Leon AR, Loh E, Kocovic DZ, Packer M, Clavell AL, Hayes DL, Ellestad M, Trupp RJ, Underwood J, Pickering F, Truex C, McAtee P, Messenger J, MIRACLE Study Group. Multicenter InSync Randomized Clinical Evaluation. Cardiac resynchronization in chronic heart failure. N Engl J Med 2002;346(24):1845–1853. Mortensen PT, Sogaard P, Mansour H, Ponsonaille J, Gras D, Lazarus A, Reiser W, Alonso C, Linde CM, Lunati M, Kramm B, Harrison EM. Sequential biventricular pacing: evaluation of safety and efficacy. Pacing Clin Electrophysiol 2004;27(3):339–345. Hor´acˇ ek BM. Numerical model of an inhomogeneous human torso. Adv Cardiol 1974;10:51–57. Hor´acˇ ek BM, Clements JC. The inverse problem of electrocardiography: a solution in terms of single- and doublelayer sources of the epicardial surface. Math Biosci 1997; 144(2):119–154.
72