... Â¥r Vd s©ut&vx w&y0â¬â 0w&ÆcV&©â â¦Hâ Ëâ¡â°VX§c gXh ` §$©W vh ` t v ©' 't .... gems IV, Boston: Accademic Press Professional,. 1994. [16] G. Ward-Laarson, ...
A New Realistic Tone Mapping Model Alessandro Artusi
Alexander Wilkie
Institute of Computer Graphics and Algorithms Vienna University of Technology
Abstract To properly reproduce a highy dynamic range image on a graphic display system is a harder problem than is commonly acknowledged. The last years have seen great progress in this area, and for non-interactive tone mapping problems adequate levels of realism have already been demonstrated, namely through the multiscale model of adaptation of Pattanaik[9] et al. Unfortunately, the high computational cost of their methods has so far precluded their use for the purposes of real-time rendering, and they have also been confined to single images without a temporal dependency. Conversely, the work of Tumblin[14] et al. have demonstrated time dependency and interactivity for tone mapping techniques, but at the cost of significantly reduced realism. In this paper we present a new high-quality time–dependent tone mapping algorithm which is comparable to the work of Pattanaik et al. in terms of visual realism, and demonstrate its viability on a number of test scenes. Key words: Time-Dependency, Glare, Visual acuity, Color sensitivity, Human Visual system. 1 Introduction Realistic image reprduction meets two main obstacles: the high dynamic range of the real world compared to the luminange range of display devices, and the different visual state of real world and the display observers. In order to get over these obstacles various tone mapping operators have been proposed, and are between them able to reproduce contrast, visibility of the objects, time dependency, visual adaptation phenomena. All these characteristics have profound effects on the visual appearance of any viewed scene, but this is not enough to offer a truly realistic image reproduction. To obtain this we also need reproduce the known defects of the human visual system, such as visual acuity, glare and color sensitivity. Visual acuity is the capacity of the visual system to resolve spatial detail in light environments, and to lose its ability to resolve fine detail in dark environments. Glare effects are caused by bright sources in the periphery of the visual field through scattering of light in the lens of
the eye, which in turn obscures foveal vision. A realistic treatment of color sensitivity has to account for the loss of color vision in dark environments[16]. 2 Background 2.1 Previous Work The concept of tone mapping was originally introduced by Tumblin and Rushmeier[14]. They proposed a tone reproduction operator that preserves the apparent brightness of scene features. Ward[15] took a different approach, and developed a tone reproduction operator which preserves apparent contranst and visibility. A model that includes different effects of adaptation was developed by Ferwerda[6] et al., while Pattanaik[9] et al. devised a computational model of adaptation and spatial vision for realistic tone reproduction. Effects of the human visual system were introduced by Ward[16] et al.. In particular they take glare, visual acuity and color sensitivity into account, and also propose a new histogram adjustment technique. Durand and Dorsey[3] propose a extension of the approach by Ferweda[6] et al.. A time–dependent visual adaptation model was introduced by Pattanaik[10] et al.. A new time–dependent visual adaptation model, which improves visual adaptation and introduces a new visual appearance model was introduced by Artusi[1] et al. While all parts of the problem have been studied individually, so far nobody has attempted to combine all these effects to derive a single highly realistic time–dependent tone mapping algorithm. In this paper we propose an algorithm which satisfies this criterion by introducing certain visual effects into an existing time–dependent algorithm[1]. 2.2 Human Visual Defects To increase the realism of displayed images is necessary to take certain characteristics of the human visual system into account. By adding these effects – which we list in the following three sections – we are able to perceptually expand and enhance the perceived dynamic range of the reproduced image.
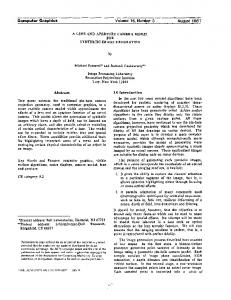
Visual acuity The human visual system also loses its ability to resolve fine details in dark environments; this is refferd to as visual acuity. It is a measure of the human visual system’s ability to resolve spatial detail[6]. Shaler[11] measured the relationship between adaptation level and foveal acuity. The acuity is lower at scotopic levels of illumination than at photopic levels[6]. Figure 1 shows the visual acuity as a function of the background luminance. Color Sensitivity In dark environments it is very difficult – if not altogether impossible – to perceive the colors of objects; apart from losing the ability to discern contrast and to resolve fine detail, the human visual system also loses the capacity to see color in dark einvornments. This is a important property of the human visual system, and if we want to realize
60
50 Visual Acuity (cycles/degree)
Glare Effects Glare effects can be subdvided into two components [13]: flare and bloom. Flare is composed of a lenticular halo and a ciliary corona, and is caused by the lens. Bloom is caused by scattering from three parts of the visual system: cornea, lens and retina. The ciliary corona appears as rays emanating from the center of the source. These radial rays may extend beyond the lenticular halo, and are brighter and more pronounced as the angle subtended by the source decreases. The ciliary corona is caused by semi random density fluctuation in the nucleus of wavelength[13]. The lenticular halo[13] is observed as a set of colored, concentric rings, surrounding the light source and distal to the ciliary corona. This happens when one observes a point source of light against a dark background. The intensity of the halo increases with the distance, in fact the halo around distant light sources appears larger than halos around nearby sources. The lenticular halo is caused by the circular optical grating formed by the radial fibers at the periphery of the crystalline lens. Bloom is the glow around bright objects, and is caused by stray light attributed to scatter from three portions of the eye: the cornea, the crystaline lens and the retina. Bloom causes a reduction in contrast that interferes with the visibility of nearby objects[13]. A good example why the inclusion of glare effects is necessary is that there is difference between the perception of a displayed image of a single white pixel on a black background, and the real experience of looking at a small incandescent bulb. The real bulb differs from the digital image in two ways: the bulb has a different qualitative brightness, and around the bulb it is possible to see a hazy glow; this glow can interfere with the visibility of objects near the bulb[13].
40
30
20
10
0 -4
-2
0
2
4
Adaptation Luminance (log10 cd/m^2)
Figure 1: Visual acuity as a function of the background luminance. This curve (redrawn from Pattanaik[10] et al.) shows that is difficult for the human visual system to resolve spatial details at low levels of illumination, and can be used to predict the visibility of scene details at different levels of illumination. a realistic matching between real world and display system we need to take it into account. 3 Development Model The basic idea implemented in this paper is shown in figure 2 in flow chart form. We start from an image which contains high dynamic range CIE tristimulus values for each pixel, and add the veiling luminance glare effect contributions to it. In this way we generate a new image with a new luminance value. For every pixel in the image we now apply visual acuity information to obtain the new luminance value for the cone receptors. This value is used to calculate a luminance value for the rod receptors by using the color sensitivity model. This value is also passed to the visual acuity model to calculate the final luminance value for the rod receptors. These new values are passed to the otherwise unmodified time–dependent algorithm[1], and this algorithm then generates the final display values. In the next subsections we explain the way we followed to implement the glare effect, visual acuity and color sensitivity. It is also possible to only use a single defect of the human visual system at a time; in this case the luminance value for the cone receptors, used in the color sensitivity
����
��� �
�
equation 6, is not the value obtained by the visual acuity model, but just the luminance value .
CIEXY Z
a 3x3 filter.
�������� � �� ���
Veiling luminance
CIEXY newZ
����� �������������!#"%$ �'& � �(")$ � �*��� �+�������!'")$ �'& � �(")$ �
(1)
�
Here is the veiling luminance for the pixel , , is �0/ � the foveal luminance for the pixel - and . is the angle between the pixels , and - . Then we add the luminance to the original image by
��21�3#45�6�� 7�8:9 ;��@?
Lrod_acuity
Time Dependent + VonKriesModel
Figure 2: Flow chart of our model
3.1 Glare There are two models which take the glare effect into account. The first one is based on the work of Holladay[7] and Moon and Spencer[8], and was proposed by Ward[16] et al. The second was proposed by Spencer[13] et al.; it is a very precise model, and predicts the all aspect of glare, like flare and bloom, but it is computationally expensive. This is achieved through a quantitative model, which directly models the bloom, ciliary corona and finally the lenticular halo, and finally generates a filter which is applied to the image in question. The glare effect implemented in this paper is the model reported by Ward[16] et al., but without using an interpolated veiling luminance. We first compute the veil image from the foveal sample values with the equation 1 and use
4+C@D'D �FE ? ;4+4 +C C D
(3)
where ? �4is+C the D local adaptation luminance ofE ? the D G4+C real scene, A is the threshold frequency, and ? ;4+C isD the threshold luminance for the world viewer. A is calculated ? �4+C D with Shaler’s formula (equation 4). However, E is calulated by using Ward’s model. ? G4 D For every pixel we calculate the visual acuity with the Shaler formula (equation 4), with the pixel luminance of the real scene as input, and use the rule 5 when applying the Fourier transform (equation 3) to the pixel.
�
RGB_display
�4+C
�BA ?
�
�
�
? C�D �H8@ I KJ�LNM�O�PRQ�M�S ? 8� T U0VXWY8:� ? C:D