Abstract: The rotary kiln for the incineration of hazardous waste is a poorly defined reactor, and is controlled in a feedback manner. To explore the feed-forward ...
USE OF CFD MODELLING TO ASSIST CONTROL OF A HAZARDOUS WASTE INCINERATOR AT AVR-CHEMIE Yongxiang Yang, Marc J.A. Pijnenborg and Markus A. Reuter Raw Materials Technology, Department of Applied Earth Sciences Delft University of Technology, Mijnbouwstraat 120, 2628 RX Delft, The Netherlands Joep Verwoerd AVR-Chemie, P.O. Box 59144, 3008 PC Rotterdam, The Netherlands Abstract: The rotary kiln for the incineration of hazardous waste is a poorly defined reactor, and is controlled in a feedback manner. To explore the feed-forward control possibilities research has been conducted to use computational fluid dynamics (CFD) as an off-line tool for simulating the waste incineration process. The standard CFD output has been specially post-processed and used to construct a structured database. The generation of the CFD database and linking the CFD predictions to the actual process control situation, are illustrated in the paper. The database generated will help the operator in making kiln-operating decisions and to improve the current process control. Copyright © 2003 IFAC Keywords: rotary kiln incinerator, feed-forward control, computational fluid dynamics (CFD), control structure, CFD database.
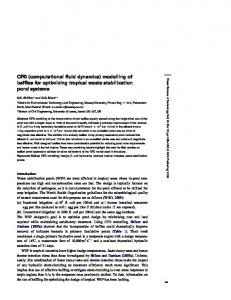
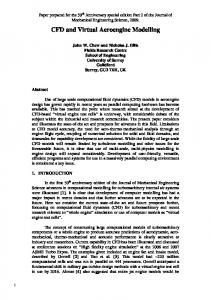
1. HAZARDOUS WASTE INCINERATION AT AVR-CHEMIE Incineration is an excellent disposal technology for all waste materials with heat release potentials, and provides high degree of toxic destruction and control for a broad range of hazardous materials. The benefits lie in the drastic volume reduction and the substantial energy recovery. In the Netherlands, the hazardous wastes in various forms are processed at AVR-Chemie located at the Rotterdam harbour, through rotary kiln incinerators. AVR-Chemie has 2 rotary kiln incinerators with a total waste processing capacity of 100,000 tons per year. The incineration system consists of a rotary kiln as the primary combustion chamber, and a secondary combustion chamber (SCC). The generated off-gas goes through the waste-heat boiler for energy recovery and a long off-gas cleaning system for flue dust collection, HCl, HF and SO2 removal as well as a dioxin (coke) filter before the off-gases are released into the atmosphere. Molten slags and ash are also formed in the rotary kiln from the inorganic solid waste components at high temperatures of about 1300°C (expected), and the slags are removed at the end of the rotary kiln and granulated in a water container beneath the kiln exit. The overall process is illustrated in Figure 1, and some details of the feeding system and the sketch of the rotary kiln and the SCC are shown in Figure 2. In order to get better understanding of the incineration process and improve the current process control,
DTO 8 & 9: ~100,000 t/y
Figure 1. Hazardous waste incineration plant at AVR-Chemie, the Netherlands. Off-gas
Kiln front-view
To waste-heat boiler (WHB)
Shredded solid-waste burner
Load chute
Secondary Combustion Chamber (SCC)
Air lances (x 7) Main burner
Burner flame
Sludge burner
Air lances (x 7)
SCC burner
Rotary Kiln Solid-waste flame
Solid waste
Slag
Ash Sump
Steam + air
Figure 2. General sketch of the rotary kiln and the secondary combustion chamber (SCC).
research was carried out to study the fluid flow and combustion behaviour of the incineration system. Computational Fluid-dynamics (CFD) was used to simulate the waste combustion process, and temperature measurements of the operating rotary kiln incinerator were conducted to validate the CFD model and to provide the information to kiln operators at AVR. CFD provides a very useful tool in simulating flow, mixing, heat transfer and waste combustion process. After proper post-processing of large amount of output data from the standard CFD simulation, a new concept was proposed to use CFD database in a supervisory process control system [Yang and Reuter, 2001]. This paper will address the more detailed post processing of the CFD output data and illustrate how a new CFD database could be constructed in the control structure.
2. PROCESS COMPLEXITY AND ENVIRONMENTAL ISSUE The rotary kiln incinerator at AVR-Chemie has a waste processing capacity of 50,000 ton/y (7 ton/h) and a thermal input of 30 – 40 MW. Various forms of the hazardous waste are incinerated such as containerised and shredded solid waste, sludge and other high or low heat content organic wastes. It is important to note that the rotary kiln is a poorly defined system because of the lack of accurate information about the waste input such as the calorific value, and large variation in composition. The complex transport and chemical processes occurring within these systems are not well understood. The waste incineration process is governed by the transport of fuel, oxidation air, and the burning products. Mixing of fuel with the combustion air and their residence time plays critical role in complete combustion and emission control. Poor feed characterisation and daily feed fluctuation in physical forms and chemical composition cause severe process fluctuations and process dynamics. The control of the incineration process is in a feedback manner, and depends very much on the temperature measurement in the secondary combustion chamber after the rotary kiln, the experience and the skills of the operators. The newly enforced regulations from the European Union with stricter emission levels require a better understanding of the incineration process and improved process control. The new threshold value for carbon monoxide of 50 mg/Nm3 is not easy to comply with. Instead of hourly averaged values in the past, half hour and ten minute measurement values are now required. A minimum incineration temperature of 1100 C during 2 seconds after the last air injection point applies to chlorine bearing waste (> 1% Cl), and a minimum temperature of 850 C to non-chlorine bearing waste so as to ensure a complete waste destruction.
3. CFD FOR FLOW AND COMBUSTION MODELLING CFD is a mathematical modelling tool to simulate fluid flow and the related transport processes. The governing partial differential equations in CFD are numerically solved for the conservation of mass and momentum (Navier-Stokes equations), thermal energy and chemical species in the fluid-flow systems such as industrial furnaces. As a result, CFD modelling generates detailed distributions of velocity, temperature, concentration of species, and other flowrelated variables in all dimensions of the whole flow domain. Thus, CFD analysis complements traditional testing and experiments, providing us with added insight and confidence in process modification and design. The CFD model for hazardous waste combustion was constructed with a commercial CFD code PHOENICS [Cham, 2003], which includes a k- turbulence model and a global gas combustion model of Spalding [1979]. A 3-gas model, so-called Simple ChemicallyReacting System (SCRS), simulates only the thermal effect of the fuel combustion. In the 3-gas combustion model only one global fuel is used, therefore, real chemical species are not taken into account. In a 7-gas combustion model, so-called the Extended SCRS (ESCRS), different forms of waste fed into the incinerator have been modelled as a mixture of a general hydrocarbon fuel C3H4 and other components such as CO, CO2 and H2O. Thus, all the incoming fuel streams with different compositions and calorific values can be converted into separate inlets. The combustion of the waste is assumed to take place only in the gas phase and in two steps: (1) primary combustion of the main fuel component C3H4 to form CO and H2, (2) secondary combustion of CO and H2 to form CO2 and H2O. The rate of each combustion reaction is assumed to be controlled by turbulent mixing of fuel and oxidant (air or oxygen), i.e. the Eddy-Break-up (EBU) model, and is adjusted by individual mixing rate constant. More detailed results about the waste stream and combustion modelling can be found elsewhere [Yang et al., 2003]. Figures 3 and 4 illustrate the predicted temperature distribution and the distribution of chemical species across some representative cross sections of the incinerator. CO distribution as an important indicator for the waste combustion efficiency and environmental control factor could give useful advice for the operation. To validate the model predictions, temperature measurement at SCC accessing ports has been carried out and comparison with the model predictions is illustrated in Figure 5. The outcome of the research indicates that CFD simulation of the rotary kiln incinerator will help to understand more insights of the process, and eventually better process control could be achieved.
1247 C SC os s lane Acr rner p bu 1396 1098 1396 Cb SC
1247
w ack
~0.00 CO2
Mass Fraction
SCC side wall
0.20
all
1247
O2
0.15 C3H4
Outside the SCC
H2O
0.10
1247
0.05
1098
1396 SCC burner 1098 1247 1098
2139
1396
0.016
15
Near SCC burner
1544
1098 2139 2139 1098
Solid waste burner
1693 2139 2139
Main burner
58 Sludge burner
Figure 3. Predicted temperature distribution with the 7-gas combustion model. Through CFD simulation of the rotary kiln waste incinerator, more understanding was gained about the waste combustion process, especially the gas flow and mixing behaviour, and general heat transfer and combustion, as well as certain aspects of species distribution. The incinerator is an extremely nonhomogeneous reactor, with stratification in combustion species and temperature throughout the system. The gas flow is clearly 3-dimensional and complicated. The temperature stratification is large because of the multigas streams and strong reactive nature of the system. Temperature measurements provided a lot of information for the operators and supplied the data for CFD model validation. The species distribution from the 7-gas combustion model gives useful information about the completeness of the combustion, and is very helpful for the emission control. However, further measurement data for the species distribution are required to validate the model.
A
0.004 0.016 0.054
0.027
0.004
A
0.004 0.008 0.012 0.016
Figure 4. Predicted chemical species distribution with the 7-gas combustion model. supervisory control system and a CFD database for a modified control structure has been proposed, as is illustrated in Figure 6. If CFD simulation results are introduced in the process control in an appropriate way, this will provide a means that would ultimately enable feed-forward control of the incineration process. The use of CFD modelling has great potential to improve the process control and to support the operator in making kiln-operating decisions. 1400 SCC-burner side
1200 1000 800 600 400 200
It is important to keep in mind that modelling is not the final goal, and the main objective of this research is to improve the process and emission control through the predicted flow and thermal behaviour of the waste incineration process. Eventually, a feedforward control system could be established based on the model predictions of the process insights. This is the main purpose of this study to explore the possibilities to enrich the current process control system, with the first principle model predictions.
~0.00
CO distribution across the main burner plane: 0.000 - 0.054
Temperature (°C)
653 1998 504 58
H2
10 5 Main burner axis (X-), m
0
2139 1544 1098
Ash sump
0.00
1247 1396 1544
CO
Waste energy input: 37 MW Waste mass input: 6.67 t/h Air supply assumed: 43.5 t/h at stoichiometric air/waste ratio 6.52. Excess air in the model: 75% (including leakage air)
Measured 3-gas model (no heat loss) 7-gas model (10% heat loss) 7-gas model (no heat loss)
0 -300
-200
-100
0
100
Supervisory Control System CFD Predictions
Access and information
As described in the previous papers [Yang and Reuter, 2001 and 2003], due to the continuously changing conditions at field-scale and long computing time of CFD simulation, CFD models cannot be used directly in on-line process control system. Therefore, a concept of using CFD simulation as an off-line tool in a
300
Figure 5. Comparison of predicted temperature distribution of 3-gas and 7-gas combustion model with the measured temperature profile.
Postprocessing
4. LINKING CFD MODELLING TO THE PROCESS CONTROL SYSTEM
200
Distance from SCC centreplane (mm)
-Aver. Temp./Vector -Direct Temp.
CFD DATABASE providing via PC (containing input scenarios)
Closed-loop
Operator
Open loop
Controllers
Figure 6. A control structure of a chemical waste incineration facility with a CFD model database.
As was pointed out in IFAC 2001 workshop [Yang and Reuter, 2001], the key to link the CFD predictions (large and complex database) to process control system is to further post-process the CFD output (distributions of all flow variables as well as temperature and chemical species), to compress the large output data, and to prepare a simple dataset for each operating case, or ideally to create a simple model which could run as an on-line process simulator in a process control loop. A concept to build-up a CFD database for a supervisory control system has been proposed for a rotary kiln hazardous waste incinerator. Further development has been made after IFAC-2001, and the latest development in further post-processing of CFD predictions in relation to the process control will be discussed. Most elements of the control structure interact with each other and databases play an important role. It is essential that a good process information database is available, which contains the chemical waste input data and temperature measurements. This information is needed for the simulation of different kiln-operating conditions. The simulation results should be fed back to a CFD database that can be used by the operating personnel and the supervisory control system. The various process data can then for example be matched with the CFD results to provide the operator with useful process information that matches the poorly defined feed with various operating conditions. Various intelligent process control tools [Reuter et al, 1996.] can be used to achieve this. In previous papers only conceptual postprocessing of the CFD outputs has been proposed,
and in this paper, the real data from post-processing CFD output will be shown.
5. CFD DATABASE IN THE CONTROL LOOP As above-mentioned, CFD models provide a lot of information in a standard form of various graphical formats and data profiles, which cannot be directly linked to the actual process control situation. Therefore, proper post-processing of the results is required to produce useful data sets, which vectorise various operating conditions, including the effect of various (poorly defined) feed materials. Only these data sets should be stored in the CFD database. The following gives an overview about the CFD database and the approaches of the database construction. Since the major objective of using CFD in assisting process control is to use CFD predictions in a proper condensed and illustrative form in a supervisory control system. Therefore, a concept of the structured CFD database is proposed below, which gives a clear image how such a database could be used directly or indirectly in the control system. Figure 7 illustrates a conceptual CFD database to be implemented in a supervisory control system. Here one can see that CFD simulations function as an off-line tool, and different CFD codes could be used for this purpose or user own code. From normal CFD post-processing, one could get detailed spatial and/or time distribution of all the relevant flow variables through all points (control volumes) of the reactor such as pressure, density, temperature, velocity components,
Ou tlet
Secondary combustion chamber (SCC) SCCA ir inlet s
SCC bur ner
Ash sump
Ash sum p
Rotary kiln Bur ners Loa d chut e Kiln fron t wall
f
average composi ti on weithed by mass, K iln 0.0 11 0 .01 0.0 09 0.0 08 0.0 07 0.0 06 0.0 05 0.0 04 0.0 03 0.0 02 0.0 01 0
CO H2 C3H4
0
Off-line CFD simulation
Standard CFD output (binary, graphical, ASCII) Detailed field values of 3D flow variables (pressure, velocity, temperature, species etc.
5
10
15 20 25 30 F low d irec tion , X (c ell Nr.)
35
40
Process control loop
CFD database for supervisory control system
Web-based hyperlinks
Input scenarios Operating conditions
Operation input (waste mass flow, calorific value, Combustion air Model B.C. etc.)
Special postprocessing from standard CFD output Data re-organisation data compression
Figure 7. A conceptual CFD database in a feed forward process control loop.
Thermal behaviour -mean temp. profiles (max., min, mass-flow mean, area-mean, Standard deviation) -Vectorisation (centre point) -Hot spots -2D temperature maps Chemical behaviour Species distribution (fuel,O2,CO,CO2,H2O etc) -Mass flow -mean profiles -Vectorisation -Max. min. value profiles Flow/mixing behaviour -Recirculation -RTD, mean residence time -Dead volume
Temperature profiles along the kiln axis 2800 T_mass T_area
2600 2400
Tmax Tmin
Tmax
2200 2000 1800 T (°C)
turbulence properties, chemical species, etc. However, those data sets are too large to be utilised for the controllers or control engineers, and thus further non-standard CFD post-processing, statistical data manipulation, data compression, model simplification are highly required. After this further CFD-data processing, simplified models and highly condensed data and well-structured database could be linked to the control loop, or at least be used by the control personnel at a supervisory level.
Kiln front
1600
Kiln end
T_area
1400
T_mass
1200 1000 800 600 400
Tmin
200 0 1
2
3
4
5
6
7
8
9
10
11
Flow dire ction, X (m )
Temperature profiles along the SCC vertical direction 2000 T_mass
1800
T_area
1600
Tmax
Tmax
Tmin
1400
T_area
1200 1000
T_mass
800 600
SCC bottom
400
SCC top
Tmin
200 0 0
1
2
3
4
5
6
7
8
9
10 11 12 13 14 15 16 17
Flow direction, z (m)
Figure 8. Illustration of the mean, maximum, minimum temperature profiles along the mean flow directions of the incinerator.
X-Y 0.3
0.25
Y (m)
0.2
0.15
Y+: Main burner side (Horizontal)
0.1
0.05
Kiln axis 0 0
1
2
3
4
5
6
7
8
9
10
11
9
10
11
Flow direction, X (m) X-Z
Kiln axis
0 0
1
2
3
4
5
6
7
8
-0.1
-0.2
Z (m)
In this research, most of the contents for the CFD database are developed, such as the mass-weighted mean temperature profiles, species profiles, and the vectorisation treatment which gives also the centre of the mean values along the main flow direction [Yang and Reuter, 2001; Pijnenborg, 2003]. Therefore, 3-D colour spatial profiles along the main flow direction could be generated following the centre of energy or chemical species, and a proper math tool is required. Figure 8 illustrates the mean temperature profiles along the main flow direction in the kiln and the SCC, and Figure 9 shows the biased energy centre from the kiln axis. One could see that the area-mean and mass-flow-rate mean temperatures do not coincide, and the mass-flow-rate averaged profiles represent the reality better. When the flow becomes more uniform downstream, the two mean temperature profiles converge to each other. In addition, other flow features of the incinerator are obtained, e.g. residence time distribution, distribution of the back circulation and dead volumes.
0
T (°C)
With a well validated CFD model, various operating scenarios with different waste input combinations could be simulated before hand, and the CFD output is further processed and new data sets are added to a standardised “Protocol” (structured database). This database could be constructed in the web-based format with all the hyperlinks in different layers. The operator could preview already the essential behaviour (thermal, chemical, and flow and mixing) before a new feeding scenario is going to be implemented. When a new feed plan comes into the incinerator, the operator could make certain recipes and check the available scenarios, to decide whether potential operating problems may occur. If it does occur such as too low or too high temperatures, or poor combustion efficiency or high residual CO level, a new recipe could be planed and checked with the available database.
Z-: Downward below the kiln axis (Vertical)
-0.3
-0.4
6. FUTURE DEVELOPMENT Based on the concept of CFD database inside the process control structure and the post-processing of the CFD output, a detailed and precise format of the database will be designed. A web-like hyperlink system will be convenient and user-friendly, or a more illustrative but simple graphical user interface needs to be developed and linked to the control
-0.5
-0.6
Flow direction, X (m)
Figure 9. Distribution of the centre of average temperature weighted by mass flow rate along the main flow direction of the rotary kiln.
software. A demonstration version of the web-based CFD database for a given operating condition will be constructed in the near future, as is illustrated in Figure 10. It is believed that the CFD database will enrich the traditional feedback control system and put a real or semi feed forward control in reality.
ACKNOWLEDGEMENTS Financial support and permission to publish the data of the kiln operation from AVR-Chemie are greatly acknowledged. Special thanks are due to the technical staff from AVR-Chemie for their constant interests in and support to this work.
REFERENCES Cham, (2003), Phoenics: Parabolic Hyperbolic Or Elliptic Numerical Integration Code Series, http://www.cham.co.uk (accessed in March. 2003) Pijnenborg, M.J.A. (2003), Combustion modelling of a hazardous waste incinerator at AVR-Chemie, MSc. thesis, Delft University of Technology. Delft, The Netherlands.
Spalding, D. B., (1979), Combustion and Mass Transfer, Pergamon Press, Oxford. Reuter, M.A. Pretorius, West C., Dixon P. and Oosthuizen M. (1996), Intelligent control of submerged-arc furnaces for ferroalloys, Journal of Metals, 48 (12), pp. 51-53. Yang, Y. and Reuter, M.A (2001), CFD Modelling for control of a chemical waste rotary kiln incinerator. 10TH IFAC Symposium on automation in Mining, Mineral, and Metal Processing (MMM 2001), Preprints of the IFAC Symposium. Mituhiko Araki, Tokyo. pp. 393-398. Yang Y. and Reuter M.A. (2003), CFD Modelling for control of a chemical waste rotary kiln incinerator, Control Engineering Practice, 11, pp. 93-101. Yang, Y., Pijnenborg, M.J.A., Reuter, M.A. and Verwoerd, J. (2003), Combustion modelling of hazardous waste incineration. Yazawa Int. Symposium on Metallurgical and Materials Processing: Principles and Technologies, Volume 1, eds. F. Kongoli et al., 2-6 March 2003, San Diego CA, USA. TMS publication 2003. pp. 1053 – 1067.
Energy value and mass rate Main burner Solid waste burner Sludge burner, etc.
Gas o ut let
Air lan ces (7x2)
SCC Ma in bur ner So lid burner
2nd level
Ash sump
Feed selection (Recipe)
Sludge burner Load chute
1st level
T-maps
CFD database (colour maps and colour profiles)
Matching CFD database (various scenarios)
Thermal behaviour Species distribution Combustion efficiency Flow features
1st level
3rd level
2nd level
T-profiles
Bad
1st level
Return to 1st level feed selection 1st level
Comparison with T, CO measurements, adjusting feed if necessary
T_mass
1800
T_ar ea
1600
Tmax
Tmax
Tmin
1400 T (°C)
Go
2000
T_area
1200 1000
T_mass
800 600
SCC bottom
400
SCC top
Tmin
200 0 0
1
2
3
4
5
6
7
8
9
10 11 12 13 14 15 16 17
Flow direction, z (m)
Recirculation & dead volumes % recirculation / dead volume %recirculation dead volume (