An Excel spreadsheet developed to solve the ion-exchange equilibrium in ..... ppt. Figure 4. Analytical data and model results on barium. The initial column is the ...
Use of Excel Ion Exchange Equilibrium Solver with WinGEMS to Model and Predict NPE Distribution in the MeadWestvaco Evandale, TX Hardwood Bleach Plant Christopher Litvay∗ MeadWestvaco Wickliffe, KY
Alan Rudie∗ USDA Forest Service Forest Products Laboratory Madison, WI
Peter Hart MeadWestvaco Chillicothe, OH
ABSTRACT An Excel spreadsheet developed to solve the ion-exchange equilibrium in wood pulps has been linked by dynamic data exchange to WinGEMS and used to model the non-process elements in the hardwood bleach plant of the MeadWestvaco Evadale mill. Pulp and filtrate samples were collected from the diffusion washers and final wash press of the bleach plant. A WinGEMS model of the bleach plant was tuned to match the mill data using the sodium and chloride analysis. The spreadsheet was then activated to calculate the bound and free concentrations for H+, Na+, Mg2+, Ca2+, Mn2+, and Ba2+. It adjusted the WinGEMS mass balance by distributing the cations into dissolved solid and suspended solid stream components. Dynamic data exchange enables the Excel spreadsheet to update the nonprocess element (NPE) partition in the WinGEMS model on each iterative cycle. The accuracy in matching estimated NPE concentrations to actual NPE concentrations is used as the test of NPE modeling. The model was then used to predict changes to be expected in a bleach plant rebuild that included replacing the existing D0 and Eo+p stage diffusion washers with presses. This model accurately predicts changes in calcium concentrations throughout the bleach plant. INTRODUCTION Two of the most costly industry-wide miscalculations of the past 30 years are bleach plant corrosion initiated by recycle of filtrates in the late 1970s [1] and the increase in bleach plant scale problems from the higher pH in the D0 stage of an elemental chlorine free (ECF) bleach sequence [2,3,4]. To comply with effluent standards mandated by the clean water act, mills needed to install secondary treatment. To minimize the size of the treatment pond, mills reduced effluent volume by increasing the recycle and reuse of process waters throughout the mill. The increased filtrate recycle in bleach plants resulted in an increase in chloride concentrations, which overwhelmed the corrosion resistance of 316 stainless steel. Accelerated corrosion increased maintenance and eventually forced companies to rebuild bleach plants with higher grades of stainless steel. [1,5] To comply with the effluent standards dictated by the cluster rules, mills converted first-stage chlorination stages operating at a discharge pH of about 1.5 to chlorine dioxide stages operating with a discharge pH of 3 to 4. The higher pH increased the fraction of oxalic acid present as the critical divalent anion and resulted in a drastic increase in the incidence of calcium oxalate scale problems in bleach plants [4]. The need to add sulfuric acid to maintain the D0 pH increased the sulfate anion concentration, which led to a significant increase in the number of mills that experienced barium sulfate scale problems [2]. In both cases, the failure to understand fundamental chemical and material properties of the bleaching process led to costly design and operating errors. These increased mill costs and the economic impact of environmental legislation. In both cases, there was sufficient fundamental knowledge that the industry could, and in some cases did, anticipate the problems [6], but there was not sufficient information to model, predict, and prevent them. In recent years, there has been a significant effort to improve the industry knowledge of ion exchange and precipitation processes that occur in bleach plants. These include ion exchange predictions using either the Donnan equilibrium [7,8] or selectivity coefficient models [9,10,11], the production of oxalate in the bleaching process [12] and factors that contribute to and inhibit calcium oxalate scale formation in the bleach plant [3,13,14,15], barium sulfate scale formation and prevention [2,16], and use of additives to minimize or prevent mineral scale problems [14,17]. Unfortunately, the critical ability to put the various chemical phenomena together with industry mass and ∗
C. Litvay and A. Rudie were formerly an MS student and Associate Professor, respectively, at the Institute of Paper Science and Technology
energy balance software and use these capabilities to predict outcomes and design solutions has not been demonstrated and accepted by the industry. The industry has had benefit of mass and energy balance software for many years. This software is capable of estimating the concentrations of soluble or insoluble materials based on physical separation or simplified models. Metal adsorption was often included, but in a very limited sense and usually limited to sodium to improve the estimation of soda losses in the pulp mill. The industry has also had benefit of several chemical equilibrium programs capable of determining scale potential and chemical speciation in process streams. But these programs had at best rudimentary process mass balance capability and lacked fundamental equilibrium or thermodynamic data on wood, pulp, and industry processes to be useful. Although the equilibrium data are now available and efforts have been made to link one or more of the equilibrium solvers to either WinGEMS or IDEAS®, to date there have been only a few published attempts to use these types of capabilities to actually model industry processes [2,18]. In a previous effort, the selectivity coefficient model for cation exchange on wood pulp was evaluated using a data base generated in a laboratory bleach filtrate recycle experiment that mimicked the type of washing and filtrate reuse practiced in the industry. An Excel spreadsheet was developed to model the stepwise build-up of cations observed in this type of recycle experiment [19]. Because this model required the basic equilibrium solution for the cation partition in the bleach plant, it was easily modified to work as a stand-alone bleach plant non-process element (NPE) model. Excel did not have the type of program flexibility required to make this a user-friendly process, so the program utility was somewhat limited. However, the same program can be coupled with WinGEMS using dynamic data exchange to achieve a detailed bleach plant mass balance that includes accurate estimates of trace metal concentrations. RESULTS AND DISCUSSION Although the model accounts for protons, sodium, and the four major NPEs, this analysis focuses on calcium. Calcium scales are the most common NPE-related problem in bleach plants. As the divalent cation in highest concentration, it dominates the ion exchange equilibrium in the bleach plant and is present in sufficient concentration to have relatively small analytical error. It provides a good test of the NPE modeling capability of the combined programs. The mill has also had problems with barium sulfate scales, but to date this has been a minor problem in the bleach plant. Barium is very difficult to model because the very low concentrations increase analytical errors. Low metal concentrations are a potential source of error with the ion exchange selectivity coefficients used in the modeling. The selectivity coefficients are measured by treating pulps with varied concentrations of two cations and analyzing the pulp for the concentration of the cations. Effectively, the selectivity coefficient is the ratio of the solution concentrations of the two cations when they each account for 50% of the ion exchange capacity of the pulp. The data are actually analyzed over a wide range of concentrations, but errors in the equivalence point invariably produce large errors in the accuracy of the selectivity coefficient. If a fraction of the binding sites have unique features that significantly favor one of the two cations, this will produce an error when that cation is present at low concentrations. It has been shown that at least two different types of carboxylic acid groups do exist in unbleached pulps [20]. Other examples of unique sites that could exist in pulp are the presence of some sulfonic acid groups and sites where two or more carboxylic acid groups are sufficiently close to provide a chelate effect where several can physically bond to the same cation. Barium modeling provides a very good test of the use of the average selectivity coefficients for the low concentration NPEs. Excel Partitioner The Excel Partitioner was developed at the Institute of Paper Science and Technology as part of a project funded by member dues. It is available to member companies from IPST. It consists of three Visual Basic macros that solve the partition between each cation and calcium using the selectivity coefficient model for ion exchange [21]. Each macro returns a value that represents the fraction of pulp ion exchange groups occupied by calcium relative to the number of ion exchange groups occupied by the pair (calcium plus the other cation). FMCa =
f Ca f Ca + f M
where F represents the fraction of ion exchange groups occupied by calcium relative to the fraction of ion exchange groups occupied by calcium and the second cation (M), and f is the fraction of ion exchange groups occupied by each cation relative to the total number of ion exchange groups available on the pulp. Summing the inverse of this value over the other five cations (H+, Na+, Mg2+, Ba2+, and Mn2+) provides the value [5fCa+fH+fNa+fMg+fBa+fMn]/fCa. Assuming that these six cations account for all the ion exchange sites available on the pulp, the sum of the partition fractions fCa+fH+fNa+fMg+fBa+fMn = 1. 1 1 = ∑ Ca − 4 f Ca all M FM
The result is a new estimate of the number of ion exchange groups occupied by calcium. The new estimate for the number of ion exchange groups occupied by a pair of cations (calcium and each of the other cations in the analysis) is f f Ca + f M = Ca FMCa Using an iterative process, the spreadsheet can then determine the number of ion exchange sites occupied by each of the six cations, and by difference, the concentration remaining free in solution. The macros account for free ion activity using the Debye Hückel approximation. Ionic strength is estimated from the sum of the free cation concentration. Because the ionic strength is dominated by the monovalent cations H+ and Na+ and monovalent anions Cl– and OH– and charge must balance, the error introduced by this assumption is small. Dynamic Data Exchange Dynamic data exchange (dde) is used within MS Windows programs to actively port data from one application to another. In WinGEMS, dde is commonly used to enter results of the mass and energy balance calculation into other programs for economic analysis or graphing. There are several examples of this type of data link in the WinGEMS program examples and Pacific Simulation website. For this application, data had to be transferred to Excel and read from Excel during each iteration of WinGEMS. The Excel spreadsheet is itself an iterative calculation and also needs to converge on a new cation partition in each iteration of the WinGEMS program. The dde process is accomplished by adding a series of scripts that define the point in the WinGEMs calculation order at which data is written to and read from Excel. A write and read statement must be written for each stream component to be included in the mass and equilibrium balance. At this point, the Excel spreadsheet has the capability to determine the partition for Na+, Ca2+, Mg2+, Ba2+, and Mn2+, so WinGEMs needs a dissolved solids and a suspended solids stream component for each. The Excel spreadsheet also needs proton concentration to determine the ion exchange partition between protons and the other cations. Although WinGEMS has the capability to estimate process pH, this feature was not trusted and instead of transferring pH into Excel from WinGEMS, it was entered directly into the spreadsheet and was not included in the data exchange process. In addition to the ion exchange equilibrium, the Excel spreadsheet was expanded to determine barium sulfate and calcium oxalate precipitation based on the solubility product estimate. Precipitates tend to remain with the fiber, so the programs also need read and write scripts to transfer sulfate and oxalate as dissolved solids components, and calcium oxalate and barium sulfate as suspended solids components. Calcium oxalate precipitation has been included in the modeling, but barium sulfate precipitation was not tested in this project. In addition, the Excel spreadsheet needs pulp consistency and process temperature. Baseline Sampling The combined program was tested against a data set collected at the Evadale hardwood bleach plant. The hardwood bleach plant is a four-stage bleach line operated as a DEo+pWD sequence, where the W stage is a chlorine dioxide stage being used as a second washer for the extraction stage. The first three towers were displacement bleach stages with each tower capped by a single-stage diffusion washer. The fourth bleach tower for the final chlorine dioxide stage discharged to a wash press. Fresh mill water was used as shower water on the wash press and the extraction
stage washer. D1 filtrate was used as the wash water on the W stage, and W stage filtrate was used as wash water on the D0 diffuser. Six sets of samples were collected over a two-week period extending from July 1 to 10, 2002. Samples were collected from the D0 stage at the entrance to the tower, the discharge from the diffuser, and the diffuser filtrate. From the extraction stage, samples were collected at the discharge of the diffuser and the diffuser filtrate. For the second extraction wash, samples were collected of the discharge pulp and the diffuser filtrate, and in the final chlorine dioxide stage, samples were collected at the entrance to the tower, the diluted pulp to the wash press, the wash press discharge after dilution for storage, and the wash press filtrate. Samples were also collected of the decker mat and the mill water used as wash water on the Eo+p and D1 stages. Pulp samples were dried and acid digested for analysis. Filtrate was also pressed from all pulp samples and analyzed separately. Routine analysis included inductively coupled plasma atomic emission spectroscopy for trace metals, and ion chromatography for sulfate, oxalate, and chloride in the wash filtrates and pulp filtrates. WinGEMS Analysis The project was carried out using Pacific Simulations WinGEMS version 5.0. The mill supplied a mill-wide WinGEMS simulation suitable for the evaluation. Because this took nearly an hour to converge on the computers available for the project, the hardwood bleach plant portion was disconnected from the remainder of the WinGEMS model by changing the internal streams providing pulp from the decker to the bleach plant and the bleach plant to storage into input and output streams. In addition, the WinGEMS control blocks were turned off. The combined effect of these changes was to enable the model with dynamic data exchange to converge in less than 30 minutes. NPE Modeling The mill WinGEMS model was updated to current operation by adjusting chemical flows and washer displacement ratios to match the average analyzed concentrations of Na+, Cl–, and K+. Sodium and chloride are obviously needed to balance the process chemical flows. Potassium provides a good reference for washing efficiency because the process inputs are small and it does not participate significantly in the ion exchange process in the bleach plant. Because the model was “tuned” on sodium without accounting for the ion exchange, it was assumed that the sodium match would deteriorate once ion exchange was included, and this was observed. However, the error was not appreciable, and the process flows and displacement ratios were not adjusted once the ion exchange was included in the modeling. The accuracy of the WinGEMs model for sodium, without and with ion exchange, is shown in Figure 1. The model accuracy on chloride and potassium are similar. Once the process flows were established, ion exchange was incorporated into the model by adding the scripts to write to and read from the Excel equilibrium spreadsheet. The NPE model was run initially with just the ion exchange and excluding the precipitation part of the model. The Excel equilibrium spreadsheets indicated that precipitation of both calcium oxalate and barium sulfate was likely in all four stages. The calcium oxalate precipitation feature was then activated. This increased the calcium content of the pulp streams and improved the overall NPE fit slightly (Figure 2) but failed to provide a good match to the calcium, magnesium, and manganese concentrations in the pulp to the D1 press and D1 press filtrate. It was postulated that the elevated calcium concentration of the press filtrate could be due to stripping calcium oxalate from the pulp because of shear in the press. Oxalate stripping was evaluated by placing a split stage in the WinGEMS model after the D1 press to move a fraction of the calcium oxalate stream component into the filtrate. Oxalate stripping was evaluated at 50%, 75%, and 100% removal. The 75% case gave the best match (Figure 3). Calcium oxalate stripping raised the press (D1) filtrate calcium concentration to 113 ppm, still 80 ppm less than the analytical data. Pulp samples around the D1 stage all remained at least 100 ppm below the sample average. However, calcium oxalate stripping reduced the estimate of the calcium concentration in the pulp to storage, and the net effect was minimal improvement in the model.
1200
Data
Model
300
1000
250
ppm
600
200 150
400
100
200
50
ra te Fi lt 2 D
St
or a
ge
ra te To
Fi lt
ou t p Eo
Eo p
D
o
Fi lt
ou t
To
Figure 1. The WinGEMS model estimates of sodium concentration compared with averages from the sampling. As expected, the fit deteriorates slightly once ion exchange is included in the modeling.
o
at e St or ag D e 2 Fi ltr at e
t Eo p
p
Fi ltr
ou
at e
o D
Eo
t
Fi ltr
ou o D
ra te
0
0
D
ppm
800
Figure 2. Calcium concentrations in the base case model analysis. The first bar is the analytical data, and the second is WinGEMS without the Excel ion exchange equilibrium capability. The third and fourth bars are the WinGEMS model using the Excel ion exchange equilibrium without calcium oxalate precipitation and with calcium oxalate precipitation, respectively.
Data 75% split Lime-75% 1500 ppm
350 300 250 ppm
Data WinGEMS ion exchange IE+ppt
350
Ion Exchange
200 150 100 50
St or ag e D2 Fi lt r at e
To
ltr at e Fi
ou t Eo p
Eo p
Fi Do
Do
ou t
lt r at e
0
Figure 3. Results of the base case models with calcium oxalate stripping in the D1 wash press, calcium carbonate precipitation in the Eo+p stage, and a hypothetical calcium input into the D1 filtrate tank. The very low calcium concentrations in the Eo+p filtrate suggested that calcium carbonate was precipitating in this stage. The mill has had routine problems with lime scale in the Eo+p stage. Unfortunately, attempts to incorporate a calcium carbonate precipitation feature into the Excel spreadsheet resulted in unstable iteration. Furthermore, a literature search failed to find papers dealing with the formation of carbonate in the bleach plant. To model carbonate formation, a react block was placed in the model before the Eo+p washer. It was used to move a fraction of the soluble calcium into an unused suspended solids stream component. A second react block was added to the D1 stage to move the calcium back into the dissolved calcium stream component. This process mimics the sequestering of calcium as calcium carbonate entrained in pulp fibers and the subsequent release of the calcium when the pH drops below 6 in the D1 stage. But it cannot model the dynamic balance between dissolved carbonate and calcium. Lime scale formation was evaluated at 50%, 75%, and 100% calcium precipitation. The 75% case proved to be the best fit, giving a soluble calcium concentration of 35 ppm in the Eo+p filtrate and 65 ppm in the second wash filtrate, compared with the average sampling values of 46 ppm and 37 ppm, respectively. The case with 75% soluble calcium entrained as calcium carbonate precipitate is included in Figure 3.
The addition of a calcium carbonate precipitation process in Eo+p raised the D1 calcium concentration to 119 ppm, still 70 ppm below the sample average. The 75% calcium carbonate precipitation case also raises the estimated calcium concentration of bleached pulp to storage about 20% above the sample average. In addition, neither calcium oxalate stripping or calcium carbonate precipitation would have much impact on other trace metals except to increase the extent to which they were carried into the D1 stage of the bleach plant. Both magnesium and manganese also increase significantly in the press filtrate and pulp stream to the press. Yet another possibility for the high calcium in the press filtrate and D1 tower is input from an unknown or unexpected source. Several machines in the mill are running alum/rosin size with calcium carbonate in the coating. So broke recycle raises the potential for high soluble calcium concentrations in the papermachine whitewater. The mill also knows that papermachine whitewater is available at the D1 washer since it was piped in for use as shower water several years earlier. So the third senerio was run to determine how big a leak would be needed to match the high press filtrate concentration and whether this improved the model fit to the rest of the bleach plant. The approach was based on a hypothetical leak of 100 gpm, and the calcium concentration was adjusted to match the sample average value in the press filtrate. The oxalate precipitation feature was used but without the assumed oxalate stripping. Because the low Eo+p filtrate concentration is good evidence that calcium was precipitating as a carbonate in this stage, the 75% transfer of dissolved calcium to a suspended solids stream component was included. The best fit to the average calcium concentration of the sample data was at 1,500 ppm calcium in this stream (the fourth model summarized in Figure 3). Statistical Quality of Fit The quality of fit can be evaluated as a root mean squared error (the square root of the average residual squared). RMSE = [(Σ (Ai – Pi)2)/n]0.5, where n is the number of sample points, A the average value obtained from the sampling, and P the concentration predicted by the model. This value has been determined for the six sample points shown in Figures 2 and 3. The quality of the fit is summarized in Table I. The model accuracy improves by about 35% when incorporating ion exchange and calcium oxalate precipitation. Stripping calcium oxalate from pulp into the press/D1 filtrate reduces the quality of the fit slightly. Accounting for calcium carbonate in Eo+p improves the accuracy by another 35%, and adding the hypothetical source of calcium further reduces the error. Table I: Base case models and the fit parameter – root mean squared residual. Model WinGEMS Ion Ex. IE + ppt 75 Split Partition No Yes Yes Yes CaC2O4 Precipitation No No Yes Yes Oxalate Stripping No No No Yes CaCO3 No No No No Addition No No No No RMSE 94 61 63 74
Lime-75 Yes Yes No Yes No 41
1,500 Yes Yes No Yes Yes 23
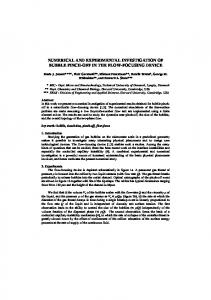
Modeling Barium The barium concentrations predicted by the model relative to the average values obtained from the sampling program are summarized in Figure 4. The model does not provide an accurate estimate of the concentrations of barium in the process. Substantially higher concentrations of barium are found in the extraction stage and finished pulps, and substantially lower concentrations of barium are found in all three filtrate streams. The changes in the calcium model including oxalate and carbonate precipitation have very little impact on the barium estimate. The low filtrate concentrations and high pulp concentrations could be accounted for by barium sulfate precipitation, and this is indicated as probable by the solubility product calculation. A second possibility is that barium enters the bleach plant as the sulfate precipitate. However, the errors observed could also be caused by a relatively small number of preferential binding sites. Because the mill has no confirmed barium scale in the locations of the testing, it is not possible to assign the error to this source and it remains to be seen which of the phenomenon is critical to improving the accuracy of the barium model. Activating the barium sulfate precipitation aspect of the Excel spreadsheet is an obvious step to improving the model, but without evidence of barium sulfate precipitation it is not much more valid than the hypothetical calcium input carried out in the calcium modeling.
400
5 4.5 4 3.5 3 2.5
Mar-03
300
dde dde+lime
ppm
ppm
Jul-02
Data Model ion exchange ppt
200
2 1.5
100
1 0.5 0
0
Do out
Do Filtrate
Eop out
Eop Filtrate
To Storage
D2 Filtrate
Figure 4. Analytical data and model results on barium. The initial column is the analytical data. The second column is WinGEMS without the Excel equilibrium capability.
Do Out
Do Eo+p out Filtrate
Eo+p filtrate
To Storage
D2 Filtrate
Figure 5: Model results relative to the average of mill sampling after the installation of the new presses.
Modeling the Bleach Plant Changes The mill had scheduled to replace the D0 and Eo+p diffusers with presses and was interested in the effect these changes would have on non-process elements and NPE scale. The presses were added to the model by replacing the wash blocks with split blocks that split off filtrate to raise the press discharge consistency to 30%. Two models were run: the ion exchange model with calcium oxalate precipitation, and with the lime precipitation model in Eo+p. Later sampling of the rebuilt mill in March of this year provided the data. These results are summarized in Figure 5. The root mean squared residuals (RMSE) for the six sample points are 53 for the model with ion exchange and oxalate precipitation and 39 for the model with reaction blocks to mimic calcium carbonate precipitation. The ability of the combined model to predict the outcome of the rebuild has been very good. Critical points in the process are the D0 stage pulp, because this is the primary concern for calcium oxalate scale, and the final pulp sent to storage. For D0 pulp, the models predict 338–346 ppm, 8% higher than the analytical value of 315 ppm. The models predict a final pulp calcium concentration of 62–88 ppm. The average observed is 83 ppm, a 6% to 25% error, depending on the model used. Because a mill is not a static environment, it is more important that the modeling predict the direction of changes than provide absolute accuracy. The relative prediction of the models on calcium is provided in Figure 6. In this graph, the new value for the WinGEMS/Excel model of the press bleach plant is divided by the value provided in the base case analysis. The data is the analytical value for the bleach plant using the presses divided by the analytical value for the base case mill. A positive value means the concentration rose or was predicted to rise at that point; a negative value means it decreased or was predicted to decrease at that sample point. WinGEMS without the Excel equilibrium capability predicts the decrease in calcium in the D1 filtrate and final bleached pulp, but it misses the increase in the calcium concentration of the D0 filtrate. Adding the equilibrium estimate to the model estimates the direction of change in all three process areas correctly. Model results with Barium are presented in Figure 7. Where most of the NPEs had similar concentrations in brown stock during the two sample periods, barium did not. In March 2003, the Decker mat contained twice the barium found during the sampling period in July 2002. Figure 7 contains data for the original model using Decker barium concentrations from the July sample period and an updated model using the higher Decker barium concentration found in March. Neither provides a good fit on pulp. With the exception of D0, both work out fairly well on the filtrates. As stated earlier, the failure to “predict” the pulp concentrations is most likely due to the formation of barium sulfate precipitates in D0, but the mill has not observed any barium sulfate scale since the rebuild. As with the model of the original mill, the method needs to be tested with the barium sulfate precipitation feature activated.
1.2
10
0.6 0.3
Mar-03
8
IE + ppt New Input
6
ppm
Press/Diffuser-1
Jul-02
Actual Change Predicted W/O dde
0.9
4
0 -0.3 -0.6
Do Filtrate Bleached D1 Filtrate Pulp
2
0 Do Out
Do Filtrate Eo+p out
Eo+p filtrate
To D2 Filtrate Storage
-0.9
Figure 6. Graph shows the ability of the WinGEMS/Excel mass and energy balance model to predict the changes in calcium concentration in critical locations in the bleach plant. Without the Excel equilibrium adjustment, WinGEMS misses the increase in calcium in the Do filtrate.
Figure 7: Press bleach plant results with Barium. The first of the WinGEMS models is using the Excel ion exchange calculator with calcium oxalate precipitation as indicated by solubility product. The second model includes a react block to mimic calcium carbonate precipitation in the Eo+p stage.
Conclusions: Progress in Modeling NPEs The WinGEMS model using dynamic data exchange to establish the equilibrium of dissolved and suspended nonprocess elements has vastly improved the ability of this mass and energy balance program to model and predict the distribution of non-process elements in the bleach plant. The model is generally accurate to about ±20% on calcium, the NPE of most concern. Model accuracy is considerably lower on manganese and magnesium, and it has failed to accurately model the distribution of barium in the bleach plant. This failure may be due to precipitation of barium sulfate in the bleach plant, or even that the dominant form of barium in the Decker pulp is insoluble barium sulfate. Barium precipitation will be tested in the future, but this feature cannot be validated using samples from this bleach plant because barium sulfate scale is not observed. Disclaimer The use of trade or firm names in this publication is for reader information and does not imply an endorsement by the U.S. Department of Agriculture of any product or service. Acknowledgments The authors thank the MeadWestvaco Corporation for project support in the form of a summer internship and assistance in sampling and sample analysis. We thank the member companies of the Institute of Paper Science and Technology and the Georgia Traditional Industries Program in Pulp and Paper for financial support. Portions of this work were used by Chris Litvay as partial fulfillment of the requirements for the Masters of Science degree at the Institute of Paper Science and Technology. References 1. Laliberte, L.H., and Sharp, W.B., “Corrosion Control in the Bleach Plant”, Pulp and Paper Magazine of Canada, 80 (2), 53-57(1979). 2. Bryant, P.S., Samuelsson, Å., and Basta, J., “Minimizing BaSO4 Scale Formation in ECF Bleach Plants”, 1997 Tappi Minimum Effluent Mill Symposium, San Francisco, CA, Oct. 23, 1997, TAPPI Press: Atlanta, 1997; 205210. 3. Ulmgren, P., and Rådeström, “Calcium Oxalate in Bleach Plant Filtrates”, 1997 Tappi Minimum effluent Mill Symposium, San Fransisco, CA, Oct. 23, 1997, TAPPI Press: Atlanta, 1997; 51-62. 4. Dexter, R., and Wang, X.H., “The Formation and Control of Bleach Plant Scale as a Result of Water Minimization”, 1998 Tappi Pulping Conference, Montreal, Oct. 25, 1998, TAPPI Press: Atlanta, 1998; 13411347
5. Rushton, J.D., “Prediction of Corrosion for Changing Bleach Plant Operating Conditions”, Tappi J., 65 (2), 115-121(1982). 6. Caron, J.R., and Fleck, J., “Metals Management in a Closed Kraft Mill Bleach Plant”, Proceedings, 1994 Tappi Pulping Conference, San Diego, CA Nov. 6, 1994, TAPPI Press: Atlanta, 1994; 1155-1160. 7. Räsänen, E.; Stenius, P., “The Sorption of Na+, Ca++, Mg++, and Mn++ on Cellulose Fibers: Prediction and Analysis of Sorption Equilibrium with Electrostatic Models”, 1997 International Symposium of Wood and Pulping Chemistry, Poster Presentations, Montreal, Canada, June 7, 1997; Technical Section, CPPA: Montreal, 1997; 94-1-5. 8. Towers, M.; Scallan, A.M., “Predicting the Ion Exchange of Kraft Pulps Using the Donnan Theory”, J. Pulp and Paper Science, 22 (9), 332-337(1996). 9. Ohlsson, A., and Rydin, S., “Washing of Pulps Part 2. The Sorption of Na, Mg and Ca on Kraft Pulp”, Svensk Papperstidning, 75 (15), 549-552(1975). 10. Ampulski, R.S., “The Equilibrium for Na/Ca Ion-Exchange reaction on Bleached Northern Softwood Kraft Pulp”, Nordic Pulp and Paper Research J., 4 (1), 38-41(1989). 11. Fernandes Diniz, J..M.B, ”Application of Chemical Equilibrium to Wood Pulp”, Holzforschung, 50 (5), 429433(1996). 12. Elsander, A., Ek, M., and Gellerstedt, G., “Oxalic Acid Formation During ECF and TCF Bleaching of Kraft Pulp”, 1997 Tappi Minimum effluent Mill Symposium, San Fransisco, CA, Oct. 23, 1997, TAPPI Press: Atlanta, 1997; 63-66. 13. Reid, D.W. and Hinck, M.L., “Factors Contributing to Calcium Oxalate Scale at the Simpson Tacoma Kraft Mill”, 2001 TAPPI Pulping Conference, Seattle, WA, Nov. 4, 2001; TAPPI Press: Atlanta, 2001. 14. Anker, L.S., Zidovec, D.F. and Korol, R.T., ”Effect of Calcium Loading on Bleach Line Scaling Potential”, 2001 TAPPI Pulping Conference, Seattle, WA, Nov. 4, 2001; TAPPI Press: Atlanta, 2001. 15. Ulmgren, P. and Rådeström, R., ”A Steady State Model Describing the Solubility of Calcium Oxalate in D(chlorine Dioxide Stage) – Filtrates”, Nordic Pulp and Paper Research J., 16 (4), 389-395(2001). 16. Persson. M. and Ulmgren, P., “Deposition of Barium Sulfate in Bleach Plants. Part 1: Solubility and Factors Affecting the Precipitation in D (Chlorine Dioxide) – Filtrates”, Nordic Pulp and Paper Research J., 17 (3), 280287(2002). 17. Severston, S.J., Duggirala, P.Y., Carter, P.W., and Reed, P.E., “Mechanism and Chemical Control of CaCO3 Scaling in Kraft Process”, Tappi J., 82 (6), 167-174(1999). 18. Räsänen, E.; Tervola, P.; Gullichsen, J.; Vuorinen, T.; Stenius, P.; Kärkkäinen, L. “Simulation of Ionic Equilibria and Mass Balances in the Fiberline”, 11th International Symposium of Wood and Pulping Chemistry, Nice, France, June 11, 2001; ATIP, 2001; 343-346. 19. Rudie, A.; Puckett, A.; Rorrer, G.L. “NPE Modeling of a Laboratory Bleach Filtrate Recycle Experiment”. In Fundamental and Numerical Modeling of Unit Operations in The Forest Products Industries Brogden, B.N., Severtson, S.J., Walker, C.C., Eds. AIChE Forest Products Symposium Series 324; American Institute of Chemical Engineers: New York, 2000; Vol. 96, 53-65. 20. Laine, J.; Buchert, J.; Viikari, L.; Stenius, P., “Characterization of Unbleached Kraft Pulps by Enzymatic Treatment, Potentiometric Titration and Polyelectrolyte Adsorption”, Holzforschung, 50 (3), 208-214(1996). 21. Rudie, A.W., Patel, N., and Ball, A., “Ion Exchange of H+, Mg2+, Ca2+, Mn2+, and Ba2+ on Wood Pulp”, to be submitted to J. Wood Chem and Tech.
1200
Data
Model
Ion Exchange
1000
ppm
800 600 400 200
St or ag D e 2 Fi ltr at e
To
p
Fi ltr
at e
t ou Eo
Eo
p
at e
Fi ltr
D
o
D
o
ou
t
0
Figure 1. The WinGEMS model estimates of sodium concentration compared to the averages from the sampling. As expected, the fit deteriorates slightly once ion exchange is included in the modeling.
Data WinGEMS ion exchange IE+ppt
350 300
ppm
250 200 150 100 50
ra te D
2
Fi lt
ge St or a
To
ra te Fi lt
ou t Eo p
Eo p
D
o
D
Fi lt
o
ou t
ra te
0
Figure 2. Calcium concentrations in the base case model analysis. The first bar is the analytical data and the second is WinGEMS without the Excel ion exchange equilibrium capability. The third and fourth bars are the WinGEMS model using the Excel ion exchange equilibrium without calcium oxalate precipitation and with calcium oxalate precipitation respectively.
Data 75% split Lime-75% 1500 ppm
350 300
ppm
250 200 150 100 50
St or ag e D2 Fi lt r at e
To
ltr at e Fi
ou t Eo p
Eo p
Fi Do
Do
ou t
lt r at e
0
Figure 3. Results of the base case models with calcium oxalate stripping in the D1 wash press, calcium carbonate precipitation in the Eo+p stage, and a hypothetical calcium input into the D1 filtrate tank.
5 4.5
Data Model ion exchange ppt
4
ppm
3.5 3 2.5 2 1.5 1 0.5 0 Do out
Do Filtrate
Eop out
Eop Filtrate
To Storage
D2 Filtrate
Figure 4. Analytical data and model results on barium. The initial column is the analytical data. The second column is WinGEMS without the Excel equilibrium capability.
400 Jul-02 Mar-03
300
dde
ppm
dde+lime 200
100
0 Do Out
Do Eo+p out Filtrate
Eo+p filtrate
To Storage
D2 Filtrate
Figure 5: Model results relative to the average of mill sampling after the installation of the new presses.
10 Jul-02 Mar-03
8
IE + ppt New Input
ppm
6
4
2
0 Do Out
Do Filtrate Eo+p out
Eo+p filtrate
To D2 Filtrate Storage
Figure 6: Press bleach plant results with Barium. The first of the WinGEMS models is using the Excel Ion Exchange calculator with calcium oxalate precipitation as indicated by solubility product. The second model includes a react block to mimic calcium carbonate precipitation in the Eo+p stage.
Press/Diffuser-1
1.2 0.9
Actual Change Predicted
0.6
W/O dde
0.3 0 -0.3 -0.6
Do Filtrate Bleached D1 Filtrate Pulp
-0.9 Figure 7. Graph shows the ability of the WinGEMS/Excel mass and energy balance model to predict the changes in calcium concentration in critical locations in the bleach plant. Without the Excel equilibrium adjustment, WinGEMS misses the increase in calcium in the Do filtrate.