Pokładowe urządzenia rejestrujące w samochodach. Wydawnictwo Politechniki Poznańskiej, 2007. 9. J. Reimpell, J Betzler. Podwozia samochodów - Podstawy ...
ANALYSIS OF VIBRATION AND DEFORMATION
1
Use of Fourier Transform for Defining Diagnostic Parameters of Car Wheel A. Augustynowicz, K. Prażnowski
Abstract— In this paper the problem of wheel imbalance is taken into consideration. An approach is presented based on spectral analysis of acceleration measured on vehicle chassis. The goal is to work out an analytical and theoretical basis for design of relatively cheap diagnostic devices for diagnostic during drive in normal road traffic conditions. It was proven that the chassis vibration amplitude are correlated with wheel imbalance and the frequency at which main peak occurs in amplitude spectrum (AS) and power spectrum (PS) spectrum is dependent on the vehicle speed. This indicated relation with acceleration signal spectral characteristic and wheel imbalance.
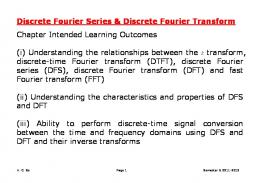
Index Terms—Wheel unbalance, amplitude spectrum, road test, Fourier Transform. I. INTRODUCTION The imbalance in the wheel and rim assembly is reflected as vibrations with the rising frequency and amplitude along with the increasing rotational speed of the wheel and, consequently, with the linear speed of the car. This type of vibrations result in the deterioration of the comfort of driving and can lead to the weakening of the driver’s concentration on driving and consequently, affect safety on the road [5,2,6]. The phenomenon of the wheel imbalance is also perceived by the driver by vibrations of the driving wheel as well the sound that is heard as rumbling from the tires. During a drive over a smooth tarmac surface the vibrations originating from the tires are transferred to the car chassis. These vibrations are most perceptible for the car velocity ranging from 75 – 100 km/h. The literature in this subject [1, 3,8,9,10] presents various methods applied for the assessment of the technical condition of the car with tires on the basis of test stand tests and static examinations. The method of measuring the vibrations of the car wheels presented in this paper is based on the attempt at finding dynamic imbalance of a wheel of a car that is in motion on a road on the basis of vibrations of car chassis. II. PURPOSE AND SCOPE OF RESEARCH The purpose of the conducted research involves comparative analysis of a balanced and imbalanced wheels for A. Augustynowicz is with the Opole University of Technology, 45-271 Opole, Poland phone: 4006224; fax: 400-6727; e-mail: a.augustynowicz@ po.opole.pl. K. Prażnowski is with the Opole University of Technology, 45-271 Opole, Poland phone: 4006186; fax: 400-6272; e-mail: author k.praznowski@ po.opole.pl.
a given vehicle mass. The experiment was conducted with regard to a middle class passenger car for a driving speed of around 110 km/h. The measurements applied 3DM-GX3-25 system, which was installed in the car cockpit and mounted on the windshield. The 3DM-GX3-25 system included a 3-axis accelerometer with the measuring axes located in the Cartesian co-ordinate system with the measurement range of +-5g and a precision scale of 0.0018 m/s2 [4]. The experiments were conducted in three phases. The first one involved the determination of inherent noise of the sensor and working engine in the tested car. The second phase consisted in the analysis of the vibrations of the chassis during drive with imbalanced wheels. Subsequently, in the third one the effect of wheel imbalance on the vibrations of car chassis was examined. The tests were conducted on public roads and motorways during drive with a constant speed. During the research the accelerations in three phases were measured with the frequency of 833Hz as well as linear and rotational speed of the engine was measured with the frequency of 100 Hz, which applied data from CAN bus for this purpose. An original program was developed in LabView environment in order to synchronize the measurements with various sampling frequencies as well as for acquisition and storage of the measured data. A screenshot of the program interface during its operation is presented in Fig. 1.
Fig. 1 Main form of road test application developed for measurement purposes.
The third phase of the test involved drive with a familiar wheel unbalance with an additionally supplemented load of 0.14 kg. For the purposes of the analysis the authors recorded signal samples for two selected speeds: 70 and 105km/h, whereas for the analysis the selected windows were four seconds in duration. The road stretch taken for the analysis
ANALYSIS OF VIBRATION AND DEFORMATION
2
was straight and without curves and without any considerable vertical inclination. The data regarding the car speed during the second and third phase are presented in Fig. 2.
greater than the ones of the sensors (Fig. 3b). Their amplitude depends generally of engine type (gasoline or diesel), and frequency of rotation speed, number of cylinders, ignition order, bores arangement and engine suspension as can be seen ou figure 5 .
Fig. 2. Changes of vehicle velocity during second and third stage of investigations.
III. METHOD OF ANALYSIS The analysis of the acceleration signal was conducted with the aid of spectral functions, in particular by amplitude spectrum (AS) and power spectrum (PS) techniques. All data were processed using MatLab software with use of native analytical spectral functions. In the examined problem of wheel vibrations it is relevant to note time t taken for the registration of the acceleration, for which a number of rotations of the wheel occur. During motion for a constant speed (v = const) the following relation between the vehicle velocity v and angular displacement of the wheel ϕ is fulfilled:
Fig. 3 Amplitude spectra of the sensor noise (a) and disturbance originating from engine operation in idle gear (b) in the longitudinal direction.
(1) where : ϕ - angle of the rotation of the wheel, t – time, rd – dynamic radius of the wheel. On the basis of this data it is possible to calculate the number of the rotations of the wheel over a given road stretch and the excitation frequency of function resulting from the projection of the centrifugal force of the wheel in the measurement direction of the acceleration sensor. The signal from the acceleration signal was subjected to discreet Fourier transformation (2) thus obtaining AS and PS [11]. (2) where: k – index of input samples in the frequency domain, n – index of input samples in the time domain, N – number of the samples in the input sequence. IV. RESULTS Noise of sensor and engine inducted disturbances As it can be seen in Figure 3a the sensor noise amplitude is relatively low in longitudinal direction (up to 1.2*10-4 m/s2) in comparison to signal changes when engine is running. The disturbances excited by the engine are characterized by strong periodic characteristics and they are from 5 to over 20 times
Fig. 4 Amplitude spectra of the sensor noise (a) and disturbance originating from engine operation in idle gear (b) in the vertical axis direction.
The amplitude spectrum does not represent a clear view of frequent signal components and it can be clearly noted as a result of comparison presented in Figure 5. Therefore, PS function will be used instead of AS in the further analysis.
ANALYSIS OF VIBRATION AND DEFORMATION
Fig. 5 Comparison of AS (a) and PS (b) of ax signal recorded when the car was in perfect stop with engine idling at 850 RPM.
3
Fig. 6. Vibrations originating from drive with balanced (a) and unbalanced wheel (b) established by experiment.
Such regularity can be also observed for acceleration in vertical direction, which is proved by the PS functions on Fig. Road tests were performed with use of two speeds 100 km/h 4a, 4b. and 110 km/h. For these velocities a excitation frequency was At higher velocities where both the excitation frequency calculated according to formula (5) and force are higher it can be observed that the first harmonic (3) related to excitation frequency is appearing. On ax signal its where: f - is an estimate of real frequency. Because in above power is still lower than the second one (Fig.8a).
Chassis body vibration during ride with unbalanced wheel
formula a constant rolling radius is assumed which is relative to on rotational velocity, wheel load and tire pressure and temperature. The AS and PS spectra were examined in frequency window of range fw +-3Hz. Additionally bands of frequencies of k*fw, where k is equal 1, 2, 3... were examined in order to find higher harmonics waves if there were any. After these tests it was observed that the balanced wheel (within +-0.4 * 10-3 kg range) produces comparable low vibrations amplitude. Its PS, when car is moving at 70 km/h, is 4*10-3( m/s2)2 at 22Hz since unbalanced wheel power is ten times so great 4*10-2(m/s2)2 at a comparable frequency. Moreover, the unbalanced wheel produces more complex spectral distribution than the balanced one. It is clearly visible in Fig. 6a and 6b if one compares the local peaks in frequency range form 10 to 100 Hz.
Fig. 7. PS of ax (a) and az (b) signals. Vibrations for drive with a balanced wheel at a velocity of 70 km/h.
Surprisingly there is a significant peak in az axis (Fig. 8b) signal PS spectrum an frequency, which is related to first harmonic of fw frequency (17Hz). Moreover the acceleration distribution for balanced wheel is more complex and peaks
ANALYSIS OF VIBRATION AND DEFORMATION power is lower as can be seen if compare figures 7 and 8 of PS of ax an az signals.
4 ay az fw ϕ V X ω
lateral acceleration in m/s2 vertical acceleration in m/s2 frequency generated by wheel in Hz angle in rad linear velocity in m/s distance in m distance in rad/s
ACKNOWLEDGEMENTS The hereby scientific study was financed from the funds of the National Centre for Research and Development in years 2009 – 2012 as a research project number N R10 0059 06 REFERENCES 1.
A. Augustynowicz: Modelowanie typu kierowcy samochodu, Studia i monografie,vol. 232, Oficyna Wydawnicza Politechniki Opolskiej, Opole 2009.
2.
Augustynowicz A., Ścięgosz H., Brol S.: Application of fractal dimension for estimation of the type of passenger car driver, Advanced Knowledge Application in Practice, ISBN: 978-953-307-141-1
3.
Fig. 8. PS of ax (a) and az (b) signals. Vibrations for drive with an unbalanced wheel at a velocity of 100 km/h. 4.
TABLE I DEFINITIONS, ACRONYMS, ABBREVIATIONS Symbol AS PS CAN: rd ax
Quantity amplitude spectrum power spectrum controller area network dynamic rolling radius longitunidal acceleration in m/s2
Archiwum Motoryzacji No 4, 2007, Wydawnictwo Naukowe Polskiego Towarzystwa Naukowego Motoryzacji, s. 293-307. S. Brol, J. Mamala, J. Jantos. Estimation of engine power during road test. W: International Congress Motor Vehicles & Motors 2010 "Sustainable development of automotive industry" Kragujevac, Serbia 07-09.10, 2010. s. 25.
V. CONCLUSIONS On the basis of the research it was indicated that the frequency of the dominant harmonic (the one with the highest frequency in a selected frequency window fw=15÷3Hz) is similar to the anticipated frequency resulting from calculations and the one gained on the basis of the relation fo= v/(7,2π rd), in which an assumption of a constant dynamic radius is made. The differences range from 0.5 Hz to 1.5 Hz and most probably originated as a result of changing the dynamic radius of the wheel during the test. The doubling of the value of amplitude in the frequency band of the spectrum corresponding to the rotational speed of the wheel makes it possible to conclude about wheel imbalance. It was observed that for low velocities (low values of excitation frequency) the dominant frequency is the second one corresponding to the rotational speed of the wheels determined from the relation in (3). For higher velocities the dominant harmonic is the first one. Both harmonics: both the first and the second one vary in the function of the rotational speed of the wheel. A drive test has to be conducted in a manner to ensure that the wheels slippage is the smallest possible one.
published by Sciyo, 2010, pp 119-130 A. Augustynowicz, S. Brol, Zastosowanie ciągłego przekształcenia falkowego do estymacji typu kierowcy w warunkach ruchu miejskiego,
5.
6.
J. Jantos, S. Brol, J. Mamala. Problems in assessing road vehicle driveability parameters determined with the aid of accelerometer. SAE Transactions, JOURNAL OF PASSENGER CAR: MECHANICAL SYSTEMS, Vol. 116, paper no 2007-01-1473, pp. 1318-1324, USA, 2008. J. Mamala, S. Brol, J. Jantos. Estimation of the characteristics of powertrain on the basis of measurement of car acceleration, Studia i Monografie, vol. 235, Oficyna Wydawnicza Politechniki Opolskiej, Opole, 2008.
7.
J. Mamala, S. Brol, J. Jantos, J. Korniak. Diagnostics of the drivetrain in a passenger car. W: 10th International Symposium on Advanced Vehicle Control. Loughborough 22-26.08, 2010. s. 508-513.
8.
J. Merkisz, S. Mazurek, J. Pielecha. Pokładowe urządzenia rejestrujące w samochodach. Wydawnictwo Politechniki Poznańskiej, 2007. J. Reimpell, J Betzler. Podwozia samochodów - Podstawy konstrukcji.
9.
WKŁ Warszawa 2004. 10. W. Siłka. Teoria ruchu samochodu. WNT Warszawa, 2002. 11. T. Zieliński, Cyfrowe przetwarzanie sygnałów , WKŁ 2005