Using Inventory Projections to Evaluate Management Options for the Nontimber Forest Product of Epiphytic Moss JeriLynn Peck, Howard Hoganson, Patricia Muir, Alan Ek, and Lee Frelich Abstract: Several US national forests have implemented moratoria on harvesting moss in the absence of management plans that can demonstrate long-term sustainability. To fill this gap, harvest schedules are presented for epiphytic moss in northwestern Oregon based on a variation of the classic volume control model. Commercial moss inventory over a 150-year simulation period was estimated as initial inventory plus biomass increment minus mortality and legal harvest. A 50-year exclusion period between harvests was chosen based on the minimum time estimated to replenish moss and to maintain acceptable species richness for the moss and the invertebrate taxa that inhabit it. Mean estimates for the input parameters were used for a “baseline” scenario and the upper and lower 95th percentile confidence intervals for the estimates were used for “optimistic” and “conservative” scenarios describing moss growth and yield estimates. Recent moss harvest permit levels exceed those that would sustain resource yield and biodiversity even under the optimistic scenario. Avoiding resource depletion would require reducing permit levels by 3.5- and 1.4-fold under baseline and optimistic scenarios, respectively. Sustained yield would require reductions of 6.8- and 1.7-fold, respectively. FOR. SCI. 54(2): 185–194. Keywords: moss harvest, bryophyte, sustainable, nontimber forest product, special forest product
W
are harvested commercially from tree boles and shrub stems in the Pacific Northwest at a rate of at least 3 million kg/yr (air-dried) (Muir et al. 2006). For decades this “moss” has been used as packing material, lining for hanging flower baskets, and as decoration in the floral industry (Peck 2006a). Although purchase costs for moss in the Pacific Northwest accounted for only $2 million in 1989 (Schlosser et al. 1991), the estimated international export value alone was up to $11 million by 1999 (Muir et al. 2006). The growth of this industry followed on the heels of agency publications and research reports emphasizing the economic and social potential for developing markets for nontimber forest products (NTFPs) (e.g., Schlosser et al. 1991, 1992, Schlosser and Blatner 1993, von Hagen et al. 1996, Lecup et al. 1998). Few forest planning documents and environmental assessments, however, have addressed the management of NTFPs (Chamberlain et al. 2002, Jones et al. 2004, McLain and Jones 2005). The sustainable management of these products requires the integration of population dynamics (Hall and Bawa 1993), market forces, management policies, and the ecosystem impacts of harvest to make realistic projections of future inventory under different management regimens. Recent legislative developments are stimulating integrative approaches to the management of NTFPs that fall under ILD MOSSES AND LIVERWORTS
the category of “forest botanicals” (H.R. 2466, Title III, Section 339, 106th Congress, 1st Session 2000). This legislation stipulates that commercial harvest permit revenues can be directed back to the national forest of origin for the purpose of “conducting inventories of forest botanical products, determining sustainable levels of harvest, monitoring and assessing the impacts of harvest levels and methods, [and] conducting restoration activities.” Some agencies, concerned about the paucity of such activities and information for their NTFPs, have imposed moratoria on harvesting products such as moss (e.g., Siuslaw, Monongahela, Pisgah, and Nantahala National Forests). The future of NTFP industries dependent on these products may rest, therefore, with our ability to develop sustainable harvest schedules. Sustainability of NTFP harvest has usually been linked to the relationship of overstory management to NTFP production (Minore 1972, 1984, Cherkasov et al. 1993, Amaranthus and Russell 1996) or continuity of resource yield (Geldenhuys and van der Merwe 1988, Minore and Weatherly 1994, Anderson 1998, Pilz et al. 1999, Endress et al. 2004, Nakazono et al. 2004). Sustained yield, however, is not necessarily the same as “sustainable levels of harvest.” Awareness of the risks of overharvesting, resource depletion, and negative impacts on the structure and composition of the forest and community function (Gould et al. 1998, Neumann and Hirsch 2000) has led to a consensus in the
JeriLynn Peck, School of Forest Resources, Penn State, 207 Forest Resources Building, University Park, PA 16802—Phone: (814) 865-4508, Fax: (814) 865-3725;
[email protected]. Howard Hoganson, Department of Forest Resources, University of Minnesota, 1861 Hwy 169E, Grand Rapids, MN 55744 —
[email protected]. Patricia Muir, Department of Botany and Plant Pathology, Oregon State University, Cordley Hall 2082, Corvallis, OR 97331-2902—
[email protected]. Alan Ek, Department of Forest Resources, University of Minnesota, 1530 Cleveland Ave., St. Paul, MN 55108-6112—
[email protected]. Lee Frelich, Center for Hardwood Ecology, University of Minnesota, 1530 Cleveland Ave., St. Paul, MN 55108-6112—
[email protected]. Acknowledgments: Technical support was provided by D.R. Clauson, C. McCain, B. McCune, B. Nowak, and especially Bill Becker, Don Harrison, and the staff of the Hebo Ranger District. Thanks also to T.E. Burk, F.N. Davis, and E.K. Zenner. Support was provided by the Siuslaw National Forest, the University of Minnesota Graduate School, the Penn State School of Forest Resources, and the US Environmental Protection Agency (EPA) under the Science to Achieve Results (STAR) Graduate Fellowship Program. EPA has not officially endorsed this publication and the views expressed herein may not reflect the views of the EPA. The manuscript was improved by the comments of two anonymous reviewers. Manuscript received November 13, 2006, accepted September 12, 2007
Copyright © 2008 by the Society of American Foresters Forest Science 54(2) 2008
185
NTFP community that sustainable harvest requires both sustained production and “no loss in species and no irreversible changes in ecosystem processes” (Boot and Gullison 1995). Maintenance of a future commercial moss industry in the Pacific Northwest requires both sustainable even-flow harvest levels and safeguarding of the ecosystem functions provided by large inventory volumes of epiphytic moss, which enhance biodiversity, provide habitat, and contribute to nutrient and hydrologic cycling (Nadkarni 1984, Coxson et al. 1992, Peck and Moldenke 1999). We attempt here to develop harvest schedules that take both of these aspects of sustainability into consideration. In contrast to modern forest planning, which involves implementing timber harvest schedules in stands of known inventory (e.g., Borges et al. 1999, Borges and Hoganson 2000), forest managers are generally unable to specifically control which stands are harvested for moss or when harvest takes place, and rarely know where exactly on the landscape harvestable volumes occur. Because moss prices are low (Peck 2006a), most public land management agencies deem it uneconomical to invest in detailed site-specific sale practices. Although this precludes detailed stand-level management of moss, harvest scheduling is still possible to help evaluate broader forestwide opportunities and impacts associated with alternative forestwide policies. Volume control models, in which the annual moss harvest volume level is applied over the appropriate acreage, can facilitate a stable harvest through the development of a more “regulated forest” (Davis et al. 2001). Such models require data describing the available land base for moss harvest in terms of its initial moss inventory and associated future moss growth (increment) rate and mortality rate. These data are now emerging for epiphytic moss, enabling the first complete application of the identified managerial steps for NTFPs, including planning, inventory, yield studies, and a definition of what constitutes sustainable harvest (Peters 1996). Using a traditional approach common for timber management, we developed a simple volume control model in which the initial inventory in each planning period is augmented by growth and reduced by mortality and legal harvest to project ending inventory. We then consider resulting harvest schedules under differing management scenarios over a 150-year period on one US Forest Service Ranger District in the Pacific Northwest. Our objective was to identify the level of commercial moss harvest that will allow resource sustainability in light of our understanding of the population dynamics of this nonvascular plant, the ecosystem impacts of harvest, and the dependence of this NTFP on a changing overstory forest composition.
Constructing the Harvest Schedules We began by focusing on portions of the district suitable for commercial moss harvest (see “Area in Moss Production” below). We then drew on the literature to determine the approximate biomass of legally available commercially harvestable moss (“Initial Inventory”), an estimate of the future annual increase in that biomass (“Biomass Increment”), and the approximate natural mortality rate for commercially harvestable moss mats (“Mortality”). The exclu186
Forest Science 54(2) 2008
sion period, the length of time between harvests on a given portion of the district, was chosen as 50 years after considering both continuity of yield and maintenance of biodiversity (“Harvest Interval”). This period influenced the time frame of our simulation period (three 50-year cycles of exclusion periods, 2006 –2156). The harvest volume simulated was initially set low and then incremented upward between repeated simulations until the harvest level was set so high as to deplete moss inventories sometime during the planning horizon. In response to district managers who desired to restrict the geographic area of harvest to facilitate enforcement and minimize poaching by concentrating harvest activity, this harvest level control model also assumed that only one-fifth of the available moss production area was available for harvest in any one decade of the planning horizon, shifting harvest to the next block with each 10-year time-step (after Peck 2006a). Such rotational extraction, in which each block is open for moss harvest for one decade and then lies fallow for four full decades before again becoming open to commercial moss harvest, may facilitate industry stability, ensuring even-flow harvest by allowing plants time to regain harvestable size (cf., Wolf and Konings 2001).
Area in Moss Production The Hebo Ranger District (Hebo RD)(45°0⬘26⬙– 45°13⬘14⬙N, 123°58⬘41⬙–123°43⬘43⬙W) on the Siuslaw National Forest in the Oregon Coast Range is probably the largest single source of commercially harvested epiphytic moss in North America. Most of the Hebo RD is below 610 m in elevation and within 10 km of the Pacific Ocean. It contains a mosaic of stands that include regeneration [⬍40 year old Douglas-fir (Pseudotsuga menziesii [Mirbel] Franco)], mature mixed forest [approximately 80- to 130-year-old postfire naturally regenerated Douglas-fir, western hemlock (Tsuga heterophylla [Raf.] Sarg.), Sitka spruce (Picea sitchensis [Bong.] Carr.), and red alder (Alnus rubra Bong.)], and a small amount of coniferous forest more than 200 years of age. Epiphytic bryophytes are ubiquitous in the region but are most abundant and accessible for harvest on red alder and understory shrubs (e.g., vine maple [Acer circinatum Pursh] and red huckleberry [Vaccinium parvifolium Smith]), which are scattered within the mature and older forests. Previous work on the Hebo RD has characterized the species composition of harvestable moss (Peck 1997a) and its associated host tree and shrub species (Peck 1997b), estimated accumulation rates (Peck and McCune 1998, Peck 2006b), and evaluated the impacts of various intensities of commercial harvest on abundance, species richness, and species composition (Peck and Christy 2006). Nearly one-third of the 59,174 ha on the Hebo RD are either nonforested or excluded from commercial moss harvest because of special protection (e.g., experimental forest and riparian buffers). Late successional reserves (USDI Bureau of Land Management 1997), which are mostly less than 110 years of age on the Hebo RD, are not excluded as they are open for the extraction of NTFPs such as moss. A total of 2,055 ha of high elevation forest were excluded
from our calculations because harvestable biomass is generally not found higher than 600 m in elevation (Peck and McCune 1998, Peck and Muir 2001a). The remaining 39,745 ha are available for commercial moss harvest and form the basis of our projections. Because the capacity to support harvestable quantities of moss does not appear to decline as mature coniferous forest ages (Peck and McCune 1998), all currently mature coniferous forest is assumed to remain in production throughout the simulation period. Moss harvest schedules are first presented under the assumption that the area of the forest producing moss will not change over time. However, the moss production capacity of hardwood, mixed, and young coniferous forest varies, and many changes are anticipated over the next century and a half that will affect the acreage of forest potentially in moss production as the hardwood component of these forests ages, senesces, and is replaced by coniferous forest (Table 1). First, the 115 ha of currently mature hardwood forest is assumed to senesce to young conifer forest as of 2026, remain out of production while young, and reenter production as mature conifer forest in 2106. Second, currently young forest, not yet suitable for moss production, is excluded during the initial years of our simulation period (conifer forest ⬍80 years of age [13,948 ha] and mixed (4,255 ha) and hardwood forest [4,320 ha] ⬍40 years of age) (after Peck and Muir 2001a). As these stands mature, they will become suitable for moss production: half of these conifer stands and all of these hardwood and mixed stands will be included in the production acreage starting in 2026 and the remainder of conifer stands will be included in 2056. Third, the hardwood forest maturing into production in 2026 will senesce to young conifer forest by 2066 and remain out of production until the conifer forest reaches maturity in 2146. Fourth, because of a long natural disturbance interval and active fire suppression, stand-replacing disturbances are assumed to be negligible, such that mature moss-producing mixed and coniferous forest is converted to young, nonproductive forest only due to limited timber
harvesting activities (simulated at a rate of 100 ha/yr). This would be adjusted in future refinements if increased disturbances arose from windthrow, fire, or timber harvesting. Finally, the acreage thus harvested of timber early in the simulation period (2006 –2066) is again included in the production acreage as mature coniferous forest starting in 2086. A second set of moss harvest schedules are presented that reflect these changes in the area of the forest potentially producing moss over time.
Initial Inventory Only two inventories of commercial moss have been conducted on the Hebo RD. In the first the average biomass in stands known to be very mossy was estimated (Peck and McCune 1998), which would therefore be a substantial overestimate of inventory across the entire district. The second, which was used as the starting inventory for our analyses, was based on simulated commercial harvest of 21 stratified random plots (Peck and Muir 2008) within the moss production acreage described above (i.e., low elevation forests of suitable age classes). Further, the simulated commercial harvest followed the current standards and guidelines for commercial moss harvest on the Hebo RD (excluding harvest in riparian areas, moss more than 6 m above the ground, or moss from logs, rocks, or the forest floor) and thus represents the biomass of legally available moss. Only 38% of the 21 plots supported commercial quantities of moss, averaging 51 kg/ha (95th percentile confidence interval [CI] 35– 66 kg/ha) (Peck and Muir 2008) (fresh weight ⫽ 26% moisture content; Peck and Christy 2006). Our baseline analysis assumes an initial inventory of harvestable volume of 51 kg/ha for land in the current overstory composition. However, purely coniferous forest supports less harvestable moss than the current mixture of forest compositions: only 19% of the 16 inventoried sites with fewer than 100 hardwood trees/ha bore commercial quantities of moss. Thus, the inventory work demonstrated that the forest area actually producing harvestable
Table 1. Input parameters for moss harvest schedules
All scenarios
2006–2025 2026–2045 2046–2055 2056–2065 2066–2085 2086–2105 2106–2145 2146–2155 Initial inventory (Y) (kg/ha)* Growth rate (Gt), for all t (kg/ha/decade) Mortality rate (Dt), for all t % Volume/decade Total volume at start (V*,0) (kg)
Potential (At) (ha)
Producing (Pt) (%)
3,244 6,331 6,331 7,726 6,862 7,062 7,085 7,949
38 38 19 19 19 19 19 19
Conservative
Baseline
Optimistic
35 3 0.15
51 17 0.1
66 47 0.05
215,753
314,382
406,848
The acreage of forest potentially producing moss (summed across all management blocks, b) and the percentage of that acreage actually in moss production varies with time as a function of the age and composition of the overstory. Input values for the Baseline scenario are the means for each parameter. Conservative and Optimistic values are the upper or lower 95th percentile confidence interval for the parameter that will result in either the lowest or highest final moss biomass inventory, respectively. * Fresh weight of 26% moisture content. Forest Science 54(2) 2008
187
quantities of moss is only a fraction of the moss production area outlined above. We therefore adjusted our inventory calculations by applying the 51 kg/ha inventory to only 38% of the area potentially in moss production. Once hardwoods become scarcer on the landscape (as of 2046, when the current hardwood component of the mixed and coniferous forests is expected to senesce), this proportion is reduced to 19%. Although no data are available on which to base estimates of the error for these proportions, we suspect that these values may be slight overestimates of the actual area in moss production based on field observations and experiences with inventories of other moss-producing areas (e.g., Peck and Muir 2001a).
Biomass Increment Most biomass increment estimates of harvestable moss have been based on a retrospective approach in which it was assumed that a moss mat growing on a shrub stem could not have taken longer to accumulate mass than the shrub stem was old. Applied in mossy areas of the Hebo RD, this approach resulted in a minimum biomass increment estimate of 1.6 g/m-stem/yr (dry weight; Peck and McCune 1998). Application of a similar methodology on sites in the drier Cascade Range resulted in a minimum biomass increment estimate of 1.2 g/m-stem/yr (Peck and Muir 2001b). These estimates, however, are known to underestimate actual biomass increment because of the variability in the time when a colony establishes on a substrate; although a substrate may have been available for 80 years, it may have only begun to support harvestable epiphytes within the past 30 years. We chose instead to use an estimate of increment based on an experimentally determined biomass growth rate from six sites in moss production areas on the Hebo RD. Individual shrub stems were harvested of their original moss mats in 1994 (Peck 1997a, 1997b , Peck and McCune 1998), monitored over the course of a decade to determine the rate of cover regrowth (Peck 2006b), and partially harvested in 2004 to determine biomass regrowth (Peck and Muir 2008). Although it is not known whether established moss mats accumulate at a faster (due to hydrologic self-buffering) or slower (due to increased decomposition) rate than these young regrowth mats, we feel this is the most accurate rate estimate currently available. Based on the observed rate of regrowth of 3.8 g/m/yr (CI 1.5–5.9) fresh weight and estimates of the average length of a harvestable moss mat, the average number of moss mats per shrub stem, and the density of mossy shrubs stems per hectare, a stand-level biomass increment was calculated of 17 kg/ha/decade (CI 3– 47) fresh weight (Peck and Muir 2008). Periodic increment on the Hebo RD, therefore, is calculated as this growth rate applied to the percentage of area in moss production (Table 1).
Mortality The mortality of epiphytes observed in long-term growth studies and population monitoring has frequently been inferred from the disappearance of individual colonies (e.g., 188
Forest Science 54(2) 2008
Wiklund and Rydin 2004). The large epiphyte mats that form in the Pacific Northwest have been thought to be vulnerable to displacement to the ground from disturbances such as treefall and strong winds. Although this mortality has been anecdotally observed for large mats on vertical tree boles (e.g., red alder), over the course of two 8- and 10-year long epiphyte studies on the Hebo RD (Peck and Christy 2006, Peck 2006b), not a single incidence of individual mat mortality was observed for mats on variously inclined understory shrubs. Observations during these studies have instead suggested that the primary cause of mortality is the demise of the shrub stem on which the mat grows, which affects all of the mats on that shrub simultaneously. The primary host species, vine maple (Acer circinatum), is a long-lived, resilient, shade-tolerant shrub that is commonly older than the overstory. Over an 8-year monitoring period on the Hebo RD, 40 of 240 vine maple stems were crushed by falling overstory trees (typically red alder, Alnus rubra) and none died in the absence of disturbance (Peck 2005). These 40 stems supported 103 of the 980 moss mats present on the 240 stems at the beginning of the monitoring period, such that roughly 1.1% of all moss mats were lost to mortality each year. However, because this rate is based on estimates for moss mats under hardwood overstories, as stands transition to longer-lived conifer cover types, the rate of mat mortality could decline (with lower rates of tree-fall). Because the error on this estimate is unknown and no other data are available, we have included mortality rates of 0.5, 1, and 1.5%/yr in constructing potential harvest schedules (Table 1).
Harvest Interval The appropriate harvest interval (exclusion period) for commercially harvestable moss has been a contentious issue. Harvesters accustomed to large reserves of epiphytic moss once insisted that harvest intervals as short as 5 years were adequate to permit continued harvest, yet reports of declines in inventory (moss buyer D. Baird, pers. comm., Aug. 15, 2005) have suggested that longer intervals are necessary. Data from several sources support this. First, the historic reserves of moss that once enabled harvesters to only partially harvest the available moss and return to the same site for a repeat harvest within a few years are now reportedly completely gone on the Hebo RD (moss harvester D. Harrison, pers. comm., Aug. 3, 2005). Second, the forests that support the greatest biomass of epiphytic moss, hardwood forest and mixed forest, have largely been either converted to conifer forest in recent decades or have naturally succeeded to a conifer-dominated cover type. Third, long-term monitoring of harvestable stands suggests that over an 8-year period, approximately 17% of stems of host species died of natural causes (Peck 2005). The resulting natural rotation period (8 ⫼ 0.17; after Frelich 2002) for these hosts is approximately 47 years, which can be viewed as a natural upper limit for the harvest interval. Fourth, in the sites from which the biomass increment was estimated, an average of 27 years (CI 16 –38) would be required to reaccumulate the biomass of a harvestable moss mat (Peck and Muir 2008).
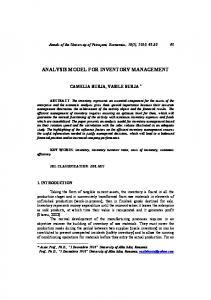
To further refine the rotation period and incorporate ecological aspects of sustainability, we took biodiversity into consideration by examining species richness of both epiphytic taxa and moss mat inhabiting macroinvertebrate taxa in moss mats of known ages (as inferred from host stem age). A primary ecosystem function of moss is the provision of voluminous and persistent living space for bacteria, fungi, rotifers, and nematodes (Merrifield and Ingham 1998), as well as for macroinvertebrates (e.g., springtails and beetles)(Peck and Moldenke 1999), mollusks, and amphibians (salamanders and frogs). Commercial harvest of these mats reduces habitat availability for this virtually unexplored epiphytic animal community. We first determined that 75% of sampled moss mats had more than two epiphytic plant taxa (N ⫽ 133) and more than three macroinvertebrate taxa (N ⫽ 55) (Figure 1). We then defined a future population of moss mats to have a minimum acceptable species richness when at least 75% of mats exceeded these levels of richness (rounding up to three epiphytic plant taxa and four macroinvertebrate taxa). Examining each 10-year moss mat age class at a time, these criteria are not met until a mat is at least 40 years of age for macroinvertebrate richness and 50 years of age for epiphyte richness. Another criterion to consider for ecological sustainability was the presence of late-successional epiphyte species (defined as moisture-loving taxa such as Leucolepis and Plagiothecium and all vascular taxa). With time, particulate matter and litter accumulate within moss mats, feeding decomposers and creating a layer of epiphytic soil, into which trees have been known to extend adventitious roots (Nadkarni 1981) and that serves as a rooting medium for vascular plants such as licorice fern (Polypodium glycyrrhiza D.C. Eat.) (Peck 1997a, Nadkarni et al. 2000). No late-successional taxa appeared in any moss mats younger than 20 years of age, but they did occur in at least 25% of moss mats after mats were at least 50 years of age. Moss also directly controls a large proportion of nutrients carried in intercepted stemflow and throughfall (Brown and Bates 1990, Nadkarni 1984), which are either permanently incorporated into the moss structure and made available again only on decomposition (Turetsky 2003), or temporarily stored in porous cells and released in pulses during significant rain events (Coxson et al. 1992). Field observations and studies in other ecosystems (e.g., the tropics; Coxson et al. 1992) also suggest that epiphytic mosses can
regulate aboveground hydrology as water intercepted by these suspended populations is not available to ground level vascular vegetation. This effect is presumed to be greater for larger volume mats, but large mats can take decades to develop: after 10 years of postharvest regrowth, most mats remained less than 3 mm deep (Peck 2006b), indicating that 30 –100 years would be required to regain the depth of the originally harvested mats (J. Peck, unpublished data, 2005). Because both habitat quality and hydrologic cycling are affected by the size (and particularly depth) of moss mats, older mats are favored over younger mats to maintain these functions. Data on the many other ecosystem functions that may be affected by harvest (e.g., genetic diversity [CruseSanders et al. 2005] or vertebrate population dynamics [Moegenburg and Levey 2003]) are unavailable. Based on all of these criteria, we chose to build the moss harvest schedules using a 50-year moss harvest exclusion period as sufficient for most moss mats to reaccumulate biomass and depth and enhance species richness of both epiphytes and macroinvertebrates as well as for at least some mats to add late-successional epiphyte taxa. For each fifth of the Hebo RD to have 50 years to recover between each harvest, we chose to estimate moss inventory in 10-year intervals, starting with 2006, for a period of 150 years or three complete rotations for each fifth of the district. In other words, each fifth of the district would be open for harvest for a decade, after which harvest would be rotated to the next fifth of the district for the next decade, and so on such that the first fifth would begin a second rotation in the 50th year after the initial harvest. Because data on when most of the district was last harvested are lacking and many areas are known to have been harvested within the past 15 years, the entire district would be placed on the 50-year rotation with the awareness that future decades would have higher harvestable volumes as the moss landscape became more regulated.
Harvest Levels Annual permit sales for commercially harvestable moss on the Hebo RD were limited to 49,895 kg/yr (110,000 lb/yr fresh weight) between 1995 and 2005 (US Forest Service 1995). We first simulated a harvest level at 454 kg/yr (1,000 lb/yr) and through repeated simulations increased this level by 2,270 kg/yr (5,000 lb/yr) until the harvest level was greater than the moss inventory in the available block in any decade of the 150-year planning horizon.
Harvest Level Control Model
Figure 1. Cumulative frequency distributions (black) and 95th percentile confidence intervals (gray) for the number of epiphytic plant taxa (left; N ⴝ 133) and macroinvertebrate taxa (right; N ⴝ 55) in harvestable epiphyte mats. Three quarters of all mats (dashed boxes) had more than 2ⴙ epiphytic plant species and more than 3ⴙ macroinvertebrate taxa.
The model tracked inventory volume estimates for commercially harvestable moss by time period (decade) for each fifth of the district (management block). Planning period t starts at time t ⫺ 1 and ends at time t, where time is in planning periods. For each run of the simulation, the starting moss inventory volume (Vb,0) for each management block b was estimated as Vb,0 ⫽ Y ⫻ Pt ⫻ Ab,t
(1)
where Y is the average inventory (kg/ha) of moss for areas Forest Science 54(2) 2008
189
in actual moss production at the start of the planning horizon (time ⫽ 0), Pt is the percentage of potential moss-producing area actually producing moss at time t, and Ab,t is the area (ha) of management block b that has the potential to produce moss at time t. The periodic volume increment (Ib,t) of moss for each management block b during time period t is estimated as Ib,t ⫽ Pt⫺1 ⫻ Ab,t⫺1 ⫻ Gt
(2)
where Gt is the growth rate (kg/ha) over time period t. The periodic moss mortality (Mb,t) for each management block b during time period t is estimated as Mb,t ⫽ Dt ⫻ Vb,t⫺1
(3)
where Dt is the percentage of moss lost to mortality during time period t. For each management block, the moss inventory volume at the end of each planning period was estimated as Vb,t ⫽ Vb,t⫺1 ⫹ Ib,t ⫺ Mb,t ⫺ Hb,t
(4)
where Hb,t is the volume of moss harvested (kg) from block b during time period t. In the simulations, it was assumed that moss harvest could occur in only one management block during each time period. Blocks were sequenced for harvest such that blocks with the oldest moss were harvested first. Total volume inventory (V*,t), the sum of Vb,t across all blocks at time t, is tracked in each simulation. In the summary of results that follow, V*,t is reported as zero whenever the volume inventory of any block (Vb,t) drops to zero. Although the best available data were used to estimate model input parameters, owing in part to the relative paucity of these data, several parameter estimates have wide confidence intervals. We chose to incorporate that error into our estimates by presenting estimated harvestable biomass inventories for three scenarios (Table 1). The first scenario (“baseline”) uses the average value for each input parameter, assuming that an approximation of the central tendency of each variable will produce an approximation of the central tendency for the final biomass inventory. The second scenario (“optimistic”) uses either the upper or lower confidence interval value for each input parameter such that moss production estimates would be maximized. In this scenario, the highest increment value would be used along with the lowest mortality rate estimate. The third scenario (“conservative”) uses either the upper or lower confidence interval value for each input parameter such that moss production estimates would be minimized. Refinement of these projections would be aided in the future by stand-specific inventory data (for both moss and the overstory) as well as data on ingrowth of moss volumes and on the relationships of growth and mortality to specific stand conditions and moss age classes.
Moss Harvest Schedules The model was first applied for all three scenarios under the simplifying assumption that the area of the forest producing moss in each management block will not change 190
Forest Science 54(2) 2008
over time. The corresponding projected inventory of harvestable moss at the end of each decade between the years 2006 and 2155 is shown for each scenario in Figure 2. Under the conservative scenario, the moss resource declines under even the lowest simulated harvest level. In contrast, under the optimistic scenario, which assumed low mortality and high increment, moss inventory failed to even remain above zero at moss harvest levels beyond 25,424 kg/yr, which is approximately half of the historic harvest level on the Hebo RD (49,895 kg/yr; US Forest Service 1995). Under the baseline scenario, the scenario using our current best estimates for input parameters, inventory remained only above zero at harvest levels not exceeding a mere 9,534 kg/yr. However, the area of the forest producing moss is expected to change over time. Relatively soon, more area is expected to produce moss because of young hardwood stands reaching production age. Longer term, but well within our 150-year planning horizon, moss production areas will decline as more stands succeed to conifer and lose much of the hardwood understory supportive for moss. Projected moss biomass inventories under a changing forest are shown for the optimistic scenario (Figure 3) and the baseline and conservative scenarios (Figure 4). Moss inventory increases substantially after 2026, when moss production acreage increases and declines in 2046 when most hardwoods are assumed to have senesced. Other minor fluctuations in production acreage are reflected in dips and rises in inventory in 2056 and 2136 (Table 1). Overall these changing forest conditions increase the potential for moss production, such that inventory remains above zero until harvest exceeds 34,504 kg/yr in the optimistic scenario and 11,804 kg/yr in the baseline scenario. Thus, even under the most optimistic conditions and taking into account changes in forest composition, the historic harvest level was beyond the maximum level possible to sustain any moss inventory at all, as predicted by local harvesters and buyers (Peck and Christy 2006). Under the most pessimistic conditions, no harvest level maintained continuity of resource yield and the estimated moss inventory never exceeded 200,000 kg. At the historic harvest level, this would represent less than a 4-year supply of moss, again in keeping with the predictions of local harvesters that current supplies would be exhausted in less than 5 years (D. Harrison, pers. comm., Aug. 3, 2005). Inventories, however, must not only remain above zero but preferably remain at or above the starting inventory (Table 1). Under the optimistic scenario, this occurs at harvest levels up to 29,964 kg/yr and under the baseline scenario at levels up to 7,264 kg/yr (Figure 5).
Management Implications For several decades, all moss production acreage on the Hebo RD was open for legal harvest and permits were sold for nearly 50,000 kg (fresh weight) of moss each year (US Forest Service 1995). Briefly, before imposing the moratorium on moss harvest the fall of 2005, the Hebo RD reduced the available acreage open for moss harvest, thus enabling annual rotations, but continued to sell permits for the same
Figure 2. Future moss inventory projections for the three parameterization scenarios based on the current forest composition of the Hebo RD (fresh weight ⴝ 26% moisture content [mc]). Estimates are shown for the entire district at the end of each decade, when harvest is rotated onto a different fifth of the district, until all areas on the district have been rotated three times. Harvest levels begin at 454 kg/yr (1,000 lb/yr) and increment by 2,270 kg/yr.
poundage of moss. The harvest schedules clearly show, however, that even after accounting for changes in forest
Figure 3. Future moss inventory projections for the optimistic scenario based on a varying future forest composition (fresh weight ⴝ 26% moisture content [mc]). Estimates are shown for the entire district at the end of each decade, when harvest is rotated onto a different fifth of the district, until all areas on the district have been rotated three times. Harvest levels begin at 454 kg/yr (1,000 lb/yr) and increment by 2,270 kg/yr.
composition and under optimistic conditions, the 49,895 kg/yr historic harvest level is not sustainable. Now that historic accumulations of moss have been depleted, future harvest levels must more closely match actual moss growth. Forest Science 54(2) 2008
191
Figure 4. Future moss inventory projections for the baseline and conservative scenarios based on a varying future forest composition (fresh weight ⴝ 26% moisture content [mc]). Estimates are shown for the entire district at the end of each decade, when harvest is rotated onto a different fifth of the district, until all areas on the district have been rotated three times. Harvest levels begin at 454 kg/yr (1,000 lb/yr) and increment by 2,270 kg/yr.
Figure 5. Future moss inventory projections for potentially sustainable scenarios based on a varying future forest composition on the Hebo Ranger District (fresh weight ⴝ 26% moisture content [mc]). Only the highest harvest level that provided an ending inventory greater than the starting inventory is shown. Estimates are shown for the entire district at the end of each decade, when harvest is rotated onto a different fifth of the district, until all areas on the district have been rotated three times. Harvest levels begin at 454 kg/yr (1,000 lb/yr) and increment by 2,270 kg/yr.
Given the low percentage of the forest actually producing moss and the low increment rate, sustainable harvest levels will necessarily be substantially lower than in the past. The 7,264 kg/yr harvest level, which maintained inventory levels at or above the starting inventory, would enable even-flow harvest and thereby facilitate stability in an industry currently suffering from a sudden complete moratorium on harvest on the primary source lands. However, from a socioeconomic perspective, it is unclear if this harvest level (16,014 lbs/yr) is sufficient to maintain the local moss 192
Forest Science 54(2) 2008
harvest industry. Coming on the heels of demographic changes in recent decades that have already seen a shift from long-term industry participation to seasonal and migratory activity (Lynch and McLain 2003, Peck and Christy 2006), resumption of harvest activity at a level one-sixth the historic harvest level could reduce product supplies below the threshold required for local buying sheds to maintain distributor contracts. Further, a mere $800 in permit revenues (at $0.05/lb) would be generated, which is clearly insufficient to cover even a portion of the costs incurred in maintaining a commercial moss harvest management program. Permit revenues could be increased if the harvest level were adaptively adjusted to match increased moss production during decades of greater inventory. For instance, because of an increase in moss production area, inventories climb substantially after 2026. If the harvest level were increased from 7,264 to 18,614 kg/ha for the subsequent 20-year period, moss harvest volumes and permit revenues would be maximized while resource continuity was maintained (i.e., inventory never drops by ⬎5% and ends higher than it starts) (Figure 5). However, it is uncertain whether this short-term increase would be beneficial to the industry in the long term. Further, if current inventory levels are determined to be insufficient to provide the ecosystem functions attributed to moss mats, a long-term increase in inventory may be preferred. Harvest could also be increased if the riparian buffer, in which moss harvest is excluded, were reduced, thereby increasing the production acreage of the most highly productive portion of the forest. The first 30 m of lowland forest immediately adjacent to a Coast Range stream is typically overgrown with salmonberry (Rubus spectabilis), which can form dense thickets several meters tall that block enough light to prevent moss growth in the understory. In the next zone of forest on the toe-slope, from 30 to 60⫹ m out from a stream, understory shrubs such as vine maple are able to out-compete the salmonberry. In this zone, which is still close enough to the stream to maintain high humidity levels, moss growth is often most luxuriant. However, halving this buffer zone would only allow a small increase in harvest levels while still maintaining a constant or increasing inventory (up to 9,534 kg/ha under the baseline scenario) (Figure 5) while, precisely because this zone bears the greatest volume of moss, the ecosystem impacts would be higher. The percentage of land in moss production would also probably be higher if the riparian buffer were reduced, potentially further increasing the sustainable harvest level. A higher harvest level could also be facilitated if the transition to the regulated forest were accommodated by allowing greater time for inventories to build before reinitiating harvest. Extending the moratorium for another 20 years to enable the accumulation of greater initial inventories would allow a small increase in harvest levels thereafter and still maintain a constant or increasing inventory during the simulation period (up to 9,534 kg/ha under the baseline scenario) (Figure 5), but the trajectory suggests that inventories would continue to fall at this harvest level. Further, such a long moratorium would jeopardize the stability of the industry: substitute products would probably be found in the
meantime and/or harvest would shift to another region. Because moss harvest in the other national center of production (Appalachia; Muir et al. 2006) is centered on logs and rocks, impacts to tree regeneration and small terrestrial vertebrates may be more significant (Studlar and Peck 2007). Another argument for not attempting to maximize moss harvest is that illegal harvest will already reduce the moss inventory beyond our projections. Although no hard data exist on which to base projections, poaching may be the most important factor affecting inventory (Muir et al. 2006, Peck and Christy 2006). Industry members estimate that poaching increases the total harvest up to four times the legal harvest level (D. Harrison, pers. comm., Aug. 3, 2005). Thus, if the sustainable harvest level is 7,264 kg/yr the legal harvest rate, assuming a possibly conservative 2⫻ poaching factor, could be no more than 2,424 kg/yr. Perhaps the only input parameter over which much control can be exerted is that of the area in moss production, which is largely determined by overstory age and composition. Silvicultural prescriptions that promote hardwood overstories would also promote understory shrubs such as vine maple and subsequently the moss that grows on them. Several studies in recent years have pointed toward the need to enhance the abundance and distribution of hardwood patches on the landscape (Neitlich and McCune 1997, Muir et al. 2002) and implementation of this policy would promote commercial moss as well. If some mature hardwoods were present in most stands such that the proportion of the forest in moss production remained high throughout the simulation period, twice the moss could be harvested sustainably (18,614 kg/yr) (Figure 5). The continued harvest of epiphytic moss as a NTFP will be possible on the Hebo RD in the future only if harvest levels are substantially reduced and/or action is taken to increase the area in moss production.
Literature Cited AMARANTHUS, M., AND K. RUSSELL. 1996. Effect of environmental factors and timber and mushroom harvest on Cantharellus production on the Olympic Peninsula, Washington State. P. 73–74 in Managing forest ecosystems to conserve fungus diversity and sustain wild mushroom harvests, Pilz, D., and R. Molina (eds.). US For. Serv. PNW Research Station PNWGTR-371, Portland, OR. ANDERSON, P.J. 1998. Using ecological and economic information to determine sustainable harvest levels of a plant population. P. 137–155 in Incomes from the forest, Wollenberg, E., and A. Ingles (eds.). Center for International Forestry Research, Bogor, Indonesia. BOOT, R.G.A., AND R.E. GULLISON. 1995. Approaches to developing sustainable extraction systems for tropical forest products. Ecol. Appl. 5(4):896 –903. BORGES, J.G., AND H.M. HOGANSON. 2000. Structuring a landscape by forestland classification and harvest scheduling spatial constraints. For. Ecol. Manag. 130(1/3):269 –275. BORGES, J.G., H.M. HOGANSON, AND D.W. ROSE. 1999. Combining a decomposition strategy with dynamic programming to solve spatially constrained forest management scheduling problems. For. Sci. 45(2):201–212. BROWN, D., AND J. BATES. 1990. Bryophytes and nutrient cycling. Bot. J. Linnean Soc. 104:129 –147. CHAMBERLAIN, J., R. BUSH, A. HAMMETT, AND P. ARAMAN. 2002.
Eastern National Forests: Managing for nontimber products. J. For. 100:8 –14. CHERKASOV, A., K. MIRONOV, AND V. SHUTOV. 1993. Response of the berry plants of the genus Vaccinium to anthropogenic stress in the European southern taiga of Russia. Aquilo Ser. Bot. 31:9 –12. COXSON, D.S., D.D. MCINTYRE, AND H.J. VOGEL. 1992. Pulse release of sugars and polyols from canopy bryophytes in tropical montane rain forest Guadeloupe French West Indies. Biotropica 24:121–133. CRUSE-SANDERS, J.M., J.L. HAMRICK, AND J.A. AHUMADA. 2005. Consequences of harvesting for genetic diversity in American ginseng (Panax quinquefolius L.): A simulation study. Biodiv. Conserv. 14(2):493–504. DAVIS, L.S., K.N. JOHNSON, P.S. BETTINGER, AND T.E. HOWARD. 2001. Forest management, 4th ed. McGraw-Hill, New York, NY. 804 p. ENDRESS, B.A., D.L. GORCHOV, AND M.B. PETERSON. 2004. Harvest of the palm Chamaedorea radicalis, its effects on leaf production, and implications for sustainable management. Conserv. Biol. 18(3):822– 830. FRELICH, L.E. 2002. Forest dynamics and disturbance regimes. Cambridge University Press, New York, NY. 266 p. GELDENHUYS, C.J., AND C.J. VAN DER MERWE. 1988. Population structure and growth of the fern Rumohra adiantiformis in relation to frond harvesting in the southern Cape forest. S. Afr. J. Bot. 54(4):351–362. GOULD, K., A.F. HOWARD, AND G. RODRIGUEZ. 1998. Sustainable production of non-timber forest products: Natural dye extraction from El Cruce Dos Aguadas, Peten, Guatemala. For. Ecol. Manag. 111:69 – 82. HALL, P., AND K. BAWA. 1993. Methods to assess the impact of extraction of nontimber tropical forest products on plant populations. Econ. Bot. 47(3):234 –247. JONES, E.T., R. MCLAIN, AND K.A. LYNCH. 2004. The relationship between nontimber forest products management and biodiversity in the United States. Rep. Inst. Culture Ecol., Portland, OR. LECUP, I., K. NICHOLSON, H. PURWANDONO, AND S. KARKI. 1998. Methods for assessing the feasibility of sustainable non-timber forest product-based enterprises. P. 85–106 in Incomes from the forest, Wollenberg, E., and A. Ingles (eds.). Center for International Forestry Research, Bogor, Indonesia. LYNCH, K.A., AND R.J. MCLAIN. 2003. Access, labor, and wild floral greens management in Western Washington’s forests. US For. Serv. Res. Station PNW-GTR-585, Portland, OR. MCLAIN, R.J., AND E.T. JONES. 2005. Nontimber forest products management on national forests in the United States. US For. Serv. Res. Station PNW-GTR-655, Portland, OR. MERRIFIELD, K., AND R.E. INGHAM. 1998. Nematodes and other aquatic invertebrates in Eurhynchium oreganum from Mary’s peak, Oregon Coast Range. Bryologist 101:505–511. MINORE, D. 1972. The wild huckleberries of Oregon and Washington—A dwindling resource. US For. Serv. Forest and Range Experiment Station Res. Paper PNW 143, Portland, OR. MINORE, D. 1984. Vacinium membranaceum berry production seven years after treatment to reduce overstory tree canopies. Northwest Sci. 58(3):208 –212. MINORE, D., AND H.G. WEATHERLY. 1994. Effects of partial bark removal on the growth of Pacific yew. Can. J. For. Res. 24(4):860 – 862. MUIR, P.S., R. MATTINGLY, J. TAPPEINER, J. BAILEY, W. ELLIOTT, J. HAGAR, J. MILLER, E. PETERSON, AND E. STARKEY. 2002. Managing for biodiversity in young Douglas–fir forests in western Oregon. Biol. Sci. Rep. USGS/BRD/BSR-2002– 0006, Corvallis, OR. Forest Science 54(2) 2008
193
MUIR, P.S., K.N. NORMAN, AND K.G. SIKES. 2006. Quantity and value of commercial moss harvest from forests of the Pacific Northwestern and Appalachian regions of the U.S. Bryologist 109(2):197–214. MOEGENBURG, S.M., AND D.J. LEVEY. 2003. Do frugivores respond to fruit harvest? An experimental study of short-term responses. Ecology 84(10):2600 –2612. NADKARNI, N.M. 1981. Canopy roots: Convergent evolution in rainforest nutrient cycles. Science 214:1023–1024. NADKARNI, N.M. 1984. Biomass and mineral capital of epiphytes in an Acer macrophyllum community of a temperate moist coniferous forest, Olympic Peninsula, Washington State. Can. J. Bot. 62:2223–2228. NADKARNI, N.M., A.R. COBB, AND R. SOLANO. 2000. Interception and retention of macroscopic bryophyte fragments by branch substrates in a tropical cloud forest: An experimental and demographic approach. Oecologia 122:60 – 65. NAKAZONO, E.M., E.M. BRUNA, AND R.C.G. MESQUITA. 2004. Experimental harvesting of the non-timber forest product Ischnosiphon polyphyllus in central Amazonia. For. Ecol. Manag. 190(2–3):219 –225. NEITLICH, P.N., AND B. MCCUNE. 1997. Hotspots of epiphytic lichen diversity in two young managed forests. Cons. Biol. 11:172–182. NEUMANN, R.P., AND E. HIRSCH. 2000. Commercialization of non-timber forest products: review and analysis of research. Center for International Forestry Research, Bogos, Indonesia. PECK, J.E. 1997a. Commercial moss harvest in northwestern Oregon: Describing the epiphyte communities. Northwest Sci. 71(3):186 –195. PECK, J.E. 1997b. The association of commercially harvestable bryophytes and their host species in northwestern Oregon. Bryologist 100(3):383–393. PECK, J.E. 2005. Final Report the Moss Harvest Monitoring Plan: Descriptions and results for special forest products stewardship areas SA1 and SA2. Rep. to the Siuslaw National Forest, Corvallis, OR. PECK, J.E. 2006a. Towards sustainable commercial moss harvest in the Pacific Northwest of North America. Biol. Conserv. 28:289 –297. PECK, J.E. 2006b. Regrowth dynamics of understory epiphytic bryophytes 10 years after simulated commercial moss harvest. Can. J. For. Res. 36:1749 –1757. PECK, J.E., AND J.A. CHRISTY. 2006. The Stewardship concept in practice: Commercial moss harvest in northwestern Oregon, U.S.A. For. Ecol. Manag. 225(1–3):225–233. PECK, J.E., AND B. MCCUNE. 1998. Commercial moss harvest in northwestern Oregon: Biomass and accumulation. Biol. Conserv. 86:299 –305. PECK, J.E., AND A. MOLDENKE. 1999. Describing and estimating
194
Forest Science 54(2) 2008
the abundance of macroinvertebrates in commercially harvestable moss. Eugene District Bur. Land Manag., Eugene, OR. PECK, J.E., AND P.S. MUIR. 2001a. Estimating the biomass of harvestable epiphytic moss in Central Western Oregon. Northwest Sci. 75(2):99 –106. PECK, J.E., AND P.S. MUIR. 2001b. Harvestable epiphytic bryophytes and their accumulation in central western Oregon. Bryologist 104(2):181–190. PECK, J.E., AND P.S. MUIR. 2008. Biomass inventory and regrowth rate of harvestable epiphytic moss in the Oregon Coast Range. West. J. Appl. For. 23(3):34 –39. PETERS, C.M. 1996. The ecology and management of non-timber forest resources. World Bank Tech. Paper 322, Washington, DC. PILZ, D., J. SMITH, M.P. AMARANTHUS, S. ALEXANDER, R. MOLINA, AND D. LUOMA. 1999. Mushrooms and timber: Managing commercial harvesting in the Oregon Cascades. J. For. 97(3):4 –11. SCHLOSSER, W., K. BLATNER, AND R. CHAPMAN. 1991. Economic and marketing implications of special forest products harvest in the coastal Pacific Northwest. West. J. Appl. For. 6(3):67–72. SCHLOSSER, W., K. BLATNER, AND B. ZAMORA. 1992. Pacific Northwest forest lands potential for floral greenery production. Northwest Sci. 66:44 –55. SCHLOSSER, W., AND K. BLATNER. 1993. Critical aspects of the production and marketing of special forest products. Manuscript for the President’s For. Conf. Committee. 73 p. (On file with Social and Economic Values Research Program, PNW Research Station, FSL, PO 3890, Portland, OR 97208-3890.) STUDLAR, S.M., AND J.E. PECK. 2007. Commercial moss harvest in the Appalachian mountains of West Virginia: targeted species, incidental take, and ecological implications. Bryologist 110:752–765. TURETSKY, M.R. 2003. Role of bryophytes in carbon and nitrogen cycling. Bryologist 106(3):395– 409. USDI BUREAU OF LAND MANAGEMENT. 1997. Northern Coast Range adaptive management area guide. BLM/OR/WA/PL97/008⫹1792, Tillamook, OR. US FOREST SERVICE. 1995. Special forest product program environmental assessment. Siuslaw National Forest, Corvallis, OR. VON HAGEN, B., J.F. WEIGAND, R. MCLAIN, R. FIGHT, AND H.H. CHRISTENSEN. 1996. Conservation and development of nontimber forest products in the Pacific Northwest: An annotated bibliography. US For. Serv. PNW-GTR-375, Portland, OR. WOLF, J.H.D., AND C.J.F. KONINGS. 2001. Toward the sustainable harvesting of epiphytic bromeliads: A pilot study from the highlands of Chiapas, Mexico. Biol. Conserv. 101(1):23–31. WIKLUND, K., AND H. RYDIN. 2004. Colony expansion of Neckera pennata: Modelled growth rate and effect of microhabitat, competition, and precipitation. Bryologist 107(3):293–301.