Use of SAR data for hydro-morphological characterization in subSaharan Africa: a case study M.N. Papa*a, F. Ciervoa, Y. Koussoubeb, G. Di Martinoc, A. Iodicec, , D. Riccioc, G. Ruelloc, I. Zinnoc a Dipartimento di Ingegneria Civile, Università di Salerno, Italy; b Departement de Geologie, UFR/SVT - University of Ouagadougou, Burkina Faso c Università di Napoli “Federico II”, DIBET, Via Claudio 21, 80125, Napoli, Italy ABSTRACT In this paper we present the rationale and the preliminary results of a research project devoted to the appropriate and innovative use of remotely sensed data for water management in semi-arid regions. The study area is the district of Yatenga, northern Burkina Faso in the sub- Saharan belt of West Africa, where extreme climate conditions cause several problems: drought, floods, soil erosion. The data comes from the Italian Space Agency (ASI) Cosmo-Skymed program, which provides high resolution (1 meter) Synthetic Aperture Radar (SAR) images. Crucial peculiarity of the project is the use of open source software for data processing and hydrological modeling. Two different hydrological models have been selected. The Soil and Water Assessment Tool (SWAT) to be employed for the design of appropriate water management plans and soil erosion mitigation measures. The Width Function Instantaneous Unit Hydrograph (WFIUHD) model can to employed for the prevision of flood events and therefore for the planning of risk mitigation. The paper shows the preliminary results of the project obtained by the processing of the first available high resolution SAR data. In particular, the first step is the realization of a Digital Elevation Model (DEM). GIS tools have been set up for the DEMprocessing in order to derive the needed hydro-morphological basin attributes to support the geo-morphological rainfall– runoff (WFIUHD) modeling. Keywords: developing countries, water management, remote sensing
1. INTRODUCTION The integrated management of the geographical information is a crucial requirement for an appropriate analysis of the hydrological problems on large-scale basin analysis1. In literature, significant efforts have been made for linking of GISapproaches and hydrological assessment models2. Moreover, an increasing research of several scientific divisions has been dedicated to improve the use of information extracted from remotely sensed images with SAR interferometric techniques3. The paper aims to provide the first results of a research project devoted to retrieve from satellite images physical information useful for calibrating hydrological models. In particular, the project is focused on the northern area of Burkina Faso, in the sub-Saharan region of West Africa. The country is one of the poorest in Africa, with a climate characterized by the alternation of rainy (3 months) and dry (9 months) seasons. Such a climate provokes several problems for the occurrence of floods in the rainy season and intense drought in the dry season. The identification, storage and distribution of water resources on one side and the mitigation of flood risk on the other, are crucial elements for the improvement of the local people standard of living. Any management policy that could interfere with the local climate balance needs a hydrological assessment to calibrate and to forecast the future effects. Therefore, in order to mitigate both drought and flood risk, appropriate hydrological models must be set up, for the simulation of rainfall-runoff transformation. In this perspective, the use of remotely sensed data can be very important, because it can provide many of the input data that are necessary to run the models. The remote sensed data constitute a crucial font of data especially in West Africa, or in similar contest, where the field data are quite scarce.
*
[email protected]; phone 0039 089 964074
The remote sensed data used in this work are supplied by the Italian Space Agency (ASI) in the framework of a research project, selected by the Agency, after a call for proposal. In particular, the Cosmo-SkyMed program provides high resolution (1 meter) Synthetic Aperture Radar (SAR) images. A set of strip-map, spotlight and scan-sar data is provided from April 2010 to March 2012. The acquiring of remote sensed data is still ongoing, therefore only preliminary elaboration are reported in the present paper. The models for the retrieving of information from SAR images are presented in more detail, by the same authors, in the paper “Use of high resolution SAR data for the monitoring of water resources in Burkina Faso” 4. In the present paper the hydrological modeling approach is focused.
2. THE CONTEXT Burkina Faso is a continental country located in West Africa more than 1000 km far from the Gulf of Guinea. It has approximately 14 milion people5. Almost 80% of the population lives in rural areas depending from agriculture and livestock. Burkina Faso is a Sahelian country characterized by strong inter-annual variability of rainfall. The last years of the 20th century (from 1970 to 2000) were marked by a long period of drought. A return to normal rainfall rates is experienced since the beginning of the 2000s2 when the average rainfall ranges from 350 mm per year in the North to 1200 mm per year in the South of the country, according to a latitudinal gradient3. The rainfall distribution is highly seasonal, with a rainy season from May to September and a dry season from October to April. These precipitations come from the Gulf of Guinea air moisture (monsoon). The air temperature varies with a maximum monthly average of 41 ° C (March - April) and a minimum monthly average of 17 ° C (December – January) for the period 1965-2006. The evaporation is about 2000 mm per year so that at the end of the dry season only the surface water bodies with water depth more than 3 m survive. Rapid regime of rainy event causes a crusting of the soil and a significant runoff. Moreover, the long drought period and some inadequate cultivation practices resulted in a degradation of land contributing to high runoff rates. The infiltration of water is so limited.
3. HYDROLOGICAL MODELING Many different rainfall-runoff models have been developed in order to reproduce the complex nature of hydrologic processes, determined by a number of highly interconnected water, energy and vegetation processes at various spatial scales. The different rainfall-runoff models may be classified as Deterministic (the same input data lead to the same result) or Stochastic models (random input variables lead to an output range with a certain probability distribution of the results). Hydrologic models may be Conceptual (based on physical laws) or Empirical (based on empirical laws). Many models mix the Conceptual approach, employed for some of the hydrological processes, with the Empirical one, employed for the others. In dealing with the spatial resolution, the hydrological model differentiates as Distributed (depending on space and time), Lumped (the spatial dimension is ignored) or Semidistributed (models subdivide the watershed in subcatchments with hydrologic similar units). Lumped models do not need as detailed input data as distributed models, but they need long time series of observed rainfall and runoff for the calibration of the model parameters. Distributed models have the advantage to predict hydrologic information on every spatial point depending on the resolution. They need detailed maps of different basin characteristics, but they can be used also when historical series of rainfall and runoff measurements are not available. The choice between Lumped and Distributed models depends on model purposes, on the data basis (resolution, quality), and on the available resources (time, computer power, etc.). In dealing with the temporal resolution, a main difference apply between models capable of simulating long-term Continuous time series and model devoted to the simulation of a Single-Event. The temporal resolution selected for the model must be adequately lower than the Time of Concentration (time from the beginning of a storm event until the entire basin is contributing to the flow at the outlet). The Continuous models are useful for the evaluation of long-term
effects of change in land use, agricultural management and reservoir management, while the Single-Event models are employed to reproduce the effect of a single storm event in terms of possible flooding. Table 1: Classification of hydrological models input-output → governing laws → spatial resolution → temporal resolution →
Deterministic
Stochastic
Conceptual
Empirical
Distributed Continuous
Lumped
Semidistributed Single-Event
Choosing a suitable hydrologic model is a complex process that depends on three main factors: the objectives of the model application, the model capability of depicting the peculiar hydrologic processes of the basin and the available data basis. The peculiar climate of the studied region is responsible of floods in the rainy season and intense drought in the dry season. Consequently, one purpose of the hydrological model is to find a strategy to mitigate the effect of unfavorable rainfall distribution on the rainfed agriculture. Storing a part of the excess water of the rainy season can enable the farmers to cultivate their land longer in a year. Therefore the implemented hydrologic model should be able to include water reservoirs and to simulate water release rules. Because of the high rate of soil erosion, the reservoir sedimentation is one major problem. Thus another important feature of the selected model is the capability of simulating storage loss over time. Engineering structures may be built to hamper the sedimentation and to mitigate the soil erosion. The design of those structures requires the estimation of the expected amount of sediment income. As a consequence, another key feature of the selected model is the capability of modeling erosion processes. Beside this, another model is necessary, for the prevision of possible flood event in the rainy season and for the planning of mitigation measures such as alert systems, engineering structures and so on. The overriding need, in the choice of the proper hydrological model, is the possibility of a widespread diffusion of the tools, developed in the framework of the present work, between local Burkinabè users. This consideration drove the choice to software’s freely available to the public. In dealing with the data basis, one crucial problem is that only few catchments are provided of gauges for the measures of runoff. This difficulty may be overcome by the implementation of Distributed models. The main feature of this family of hydrological models is that they can be employed also in ungaged basins. The main difficulty, of the distributed approach, is generally linked with the availability of distributed estimations of basin characteristics. One of the focus points of the present project is the attempt of overcoming this difficulty by employing the remote sensed data for the derivation of thematic maps, for the basin characteristics, relevant for hydrological modeling. In order to achieve all the required tasks two different simulation models have been selected. A DeterministicDistributed-Continuous model (SWAT) and a Deterministic-Distributed-Single-event model (WFIHU). the two models are briefly described in the following sections.
3.1 Model for water resources management The SWAT, Soil and Water Assessment Tool, model (Arnold et al., 19986; Srinivasan et al., 19987), developed by the USDA (Agricultural Research Service at the Grassland, Soil and Water Research Laboratory in Temple, Texas, USA) has been selected. This model was developed to predict the impact of land management practices on water, sediment, and agricultural chemical yields on large, complex watersheds with varying soils, land use, and management conditions over long periods of time. The model is deterministic, combines empirical and physically-based equations, it is semi distributed and continuous over long time series. It can perform reservoir management simulation, simulate erosion process and reservoir sedimentation. It is available for the public as open source software and it has a good user support. SWAT has been used extensively in hydrologic research worldwide (Arnold and Fohrer8, 2005; Jayakrishnan et al. 9, 2005) and its positive performances are well documented in the hydrologic modeling literature.
The SWAT model subdivides the watershed into sub-basins. Each sub-basin is further divided into hydrological response units (HRUs) that have the same combinations of land cover, soil and management. The model calculates for each HRU separately and routes the water, sediment and nutrients from HRU outlets to the sub-basin outlets and then to the basin outlet to obtain total basin loadings. The SWAT model is based on the following water balance equation: t
SWt = SW0 + ∑ ( Rday − Qsurf − Ea − Wseep − Qgw )
(1)
i =1
where, SWt is the final soil water content (mm), SWo is the initial soil water content (mm), t is the time (days), Rday is the amount of precipitation (mm), Qsurf is the amount of surface runoff (mm), Ea is the amount of evapotranspiration (mm), Wseep is the seepage water from the soil profile (mm), and Qgw is the amount of groundwater return flow (mm), each of which are calculated for the day i. Two methods are implemented into the model for estimating surface runoff: the Soil Conservation Service (SCS) curve number (CN) method (USDA-SCS, 1972) 10 and the Green–Ampt infiltration method (Green and Ampt, 1911) 11. The SCS Curve Number equation is written as:
Qsurf =
(R − I a )2
(2)
R − Ia + S
where Ia is the initial abstraction such as infiltration and interception prior to runoff (mm), S is a retention parameter based on the combination of soil, land use and land cover. Many different equations, widespread used in literature, are included in the model for the estimation of the evapotraspiration component. The subsurface flow routing is based on the soil water balance. If the water in the vadose soil layer exceeds the field capacity, water percolates into the shallow aquifer (recharge). If the shallow aquifer recharge then exceeds a threshold value, the base flow is calculated with the assumption of a linear relationship to the water table fluctuation. Otherwise, the outflow from the stored soil water is calculated with a recession constant (exponential function). A part of the shallow aquifer recharge enters the deep aquifer, estimated by a threshold value. This water is lost from the system. The maximum runoff rate that occurs with a given rainfall event, is an indicator of the erosive power of a storm. It is used to predict sediment loss. SWAT calculates peak runoff rate with the rational method. Therein it is assumed that the rate of runoff increases until the elapsed time is equal to the time of concentration (TOC). The SWAT model employs the Modified Universal Soil Loss Equation (MUSLE) developed byWilliams and Brendt (1977) 12 to compute sediment yield for each sub-basin. Water bodies like ponds, wetlands and reservoirs can be implemented into the model The simulation of runoff through a system with internal ponds or reservoirs is obtained by adding a storage-discharge function for each storage point.
3.2 Flood formation model In the hypothesis of stationary and linear behavior of the catchment (Dooge13, 1973), the outlet discharges may be estimated through the Instantaneous Unit Hydrograph (IUH) method. The (IUH) is the outlet discharge consequent to a unit volume of effective rainfall generated instantaneously and uniformly over the basin. The IUH may be also regarded as the time probability distribution function of a drop of water once it enters the channel network. In the above hypotheses, the convolution of the IUH with the actual rainfall may provide the hydrograph of outlet discharge. Many studies have investigated the possibility of linking the IUH with the geomorphological features of the catchment. The catchment geomorphology may be represented by the Width Functions WF(x) (Mesa & Mifflin14, 1986) that is the relative proportion of basin area at a distance x from the outlet, whit x measured along the network. In other words the WF(x) is the probability density function of the hydrologic-travel distances (x). The Width Functions WF(x), depend on
the structure of the flow paths which are known to have fractal characteristics15 and inherits from them significant mathematical properties which were widely studied in literature into the flood formation process context. The WF(x) must be rescaled in term of drainage-water travel times WF(t); to do it a velocity of surface runoff has to be fixed. Van der Tak & Bras16 e Rinaldo17 proposed to rescale WF(x) into WF(t) using two different runoff velocities one for the flow in the river network and the other for the hillslope flow. Maidment et al. 18 proposed to derive the hydrograph from a spatially distributed velocity field. The Mesa & Mifflin method introduces the hydrodynamic dispersion of the processes of runoff formation. The Inverse Gaussian distribution is used to depict the travel time distribution for one travel-path distance x. In fact the inverse Gaussian function is the solution of the linear advection-dispersion equation which is often used as a simplified model of channel flow. The Width Function Instantaneous Unit Hydrograph (WFIUHD) is then obtained through the convolution of the WF(t) with the Inverse Gaussian distribution. The final equation is: t i −t
− T = max 4 Dt WFIUH D = 1 WF ( t ) t exp ∑ i i 3 4 πDt i =1
(3)
where D is the diffusive parameter related to the average flow conditions. The implementation of the model requires the evaluation of two parameters, the velocity of surface runoff and the diffusive parameter. Although these parameters have a physical meaning, in this contest they cannot be evaluated for any single reach but they must reflect the average flow conditions of the river network.
4. DATA INPUTS AND GIS TOOLS The complexity of the physical processes to be simulated requires a great number of information, both as input data and calibration parameters. Most of these information can efficiently be acquired via remote sensing instruments, with a great advantage in the space and time resolution and also with a huge economic saving. Both the two selected hydrological models require a detailed digital elevation model (DEM). The DEM can be extracted from a couple of SAR images if the time interval between the two is small enough to assume static conditions. A great advantage of using the remote sensed data is the possibility to input the time evolution of relevant basin characteristics. This is the case, for example, of the land cover and land use. In contest similar to the studied one, in which the climatic seasonality determines a huge variation on time of vegetation, the remote sensed data may play a crucial role. Another dynamic data, that may be provided by the remote sensed images, is the soil moisture. The soil moisture maps, at different times along the year, constitute an important element for the models calibration and verification. The width of water bodies, derived from the SAR images, can provide useful information about the volumes of surface water retained into stream and reservoirs. This can be a great advantage especially in areas where there are only few or none instrumentation for continues measurements of water levels and water discharges. Differently from traditional systems, which may give only point information, these measures, obtained with remote sensing tools, are spatially distributed. One of the aim of the project, here presented, is the linkage of remote sensing, geographic information systems (GIS) and hydrological models. In this contest the use of GIS tools may improve the management of great bulk of data and allow for rapid parameter estimation. Over the past decade numerous significant advances have been made in the linkage of GIS and hydrological modeling. These GIS-based systems have greatly enhanced the capacity to develop and apply models due to the improved data management and rapid parameter estimation tools that can be built into a GIS driver. In the framework of hydrological model, numerous approaches have been developed for automated extraction of watershed structure from grid digital elevation models (e.g. Band19, 1986; Mark et al. 20, 1984). The most widely-used method for the extraction of stream networks is to compute the contributing area, upslope of each pixel, through a network of cell-to-cell drainage paths. A threshold contributing source area is fixed to define a channel. The watershed is then subdivided into upland and channel elements.
With the aim of providing tools for widespread and free use, the t GRASS open-source source GIS was chosen. chosen Information, technologies and tools, from both the hydrological and remote sensing fields, will be integrated in the system. All the above cited information and instruments have to be available on the web, for guaranteeing an almost real-time real data sharing.
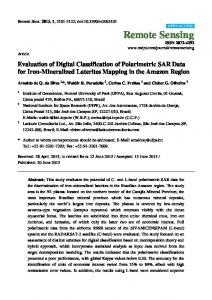
5. REMOTE SENSING The use of SAR images for hydrological applications is often limited by the difficulty of extracting physical information from the speckled data. Innovative nnovative models for the retrieving of information from SAR images are necessary, based on efficient and innovative vative algorithms for the image interpretation. The results of the models are used as a starting point for the development of techniques for the production of value added information. In particular, we provide the image interpreter the chance to use simple relations between the image characteristics and the geometric and dielectric parameters of the observed surfaces. The innovative character of the proposed method is the intensive use of fractal models. It requires the development of new models for the electromagnetic scattering from fractal surfaces21. In the framework of the project, the Italian Space Agency (ASI) provides high resolution images from the CosmoSkyMed mission. A set of strip-map, map, spotlight and scan-sar scan sar data is provided from April 2010 to March 2012. CosmoSkyMed is one of the most advanced Synthetic Aperture Radar (SAR) missions in orbit around our planet. It allows the acquisition of SAR images at X band with a resolution resol of the order of the meter.
b) a) Figure 1. a) Example of an acquired stripmap; b) Detail of the Tougou dam.
The images cover an area of about 40 km x 40 km, near the city of Ouahigouya, capital of the Yatenga district, district in the North of Burkina Faso. In Figure 1 (a) we show the SAR image acquired acquired on the 14th of July, 2010. 2010 The original image resolution is 3m x 3m; the pixel spacing is 1.22m x 1.9m. The images were then averaged by a 8 x 8 factor. A further average is due to the image compression In the bottom left corner of the image, the artificial lake that feeds the city of Ouahigouya is visible. In the bottom right corner another big reservoir (called the Tougou basin) is easily recognized. The area is crossed from the he upper right corner to the city of Ouahigouya by the watershed contour that separates the Black and the White Volta basins. In order to appreciate the image full resolution, in Figure 1 (b) we show a detail of the Tougou dam. Figure 1 (b) shows that the SAR image presents a detail that allows distinguishing objects of the size of the trees. This variety of details is absolutely new for data acquired from satellites, and its characterization is still object of scientific discussion. The data carries physical physical information on the area topography, morphology, morphology vegetation soil moisture, etc…
6. PRELIMINARY RESULTS At the actual state of the project, only the first images have been acquired and a complete processing chain is in progress, in order to retrieve as much information as possible. In the paper4 “Use Use of high resolution SAR data for the monitoring of water resources in Burkina Faso”, ”, the same authors present innovative techniques for extracting part of this information. In this Section we limit our attention on the first results of the integration between remote sensing techniques, GIS tools and hydrological approach. In this first step the topographic information has been derived from SAR images, the hydrohydro morphological features of the basin have been then extracted extracted by GIS tools and processed by the WFIUH hydrological model.
6.1 Topographic information A couple of SAR images were acquired at the beginning of June, 2010, with a temporal separation of 1 day. Such a couple allowed the extraction of a digital elevation elevation model (DEM) that was used to extract the main topographic information. Thank to the limited temporal shift and to the absence of significant vegetation at the beginning of the rainy season, the interferometric coherence, presented in Figure 3 is very high high in most of the observed area. Some topographic characteristics can be already identified in the coherence information. The river streams can be noted as the dark, non coherent areas. Some villages, not easily visible in the intensity image, can be identified identified as bright spots.
Figure 2. Interferometric coherence in the Tougou basin area.
A complete interferometric chain was implemented via standard techniques. In Figure 4 the interferometric phase, after flat Earth removal (a) and the obtained georeferenced DEM (b) are presented. The data presented in Figure 4 (b) represent a first 30m x 30m digital elevation model of the observed area. A complete error budget analysis is still in the implementation phase. A measurement campaign is also planned, so that we expect that we could discuss its results during the conference conferen presentation. Further data acquisition and elaborations will allow for the extraction of a DEM with significantly higher resolution.
a)
b)
Figure 3.. a) Interferometric coherence in the Tougou basin area. b) Georeferenced digital elevation model of the Tougou area.
6.2 Preliminary GIS elaborations The topographical data obtained has been further elaborated in order to derive a first hydrological characterization of the studied catchment. The processing of the DEM allowed for the the derivation of a GIS including some relevant hydrological data. Significant features like drainage contribution areas and drainage direction have been produced from catchment morphometric attributes processing (elevation, slope, curvature) providing the needed drainage network information and rendering the stream morphometric shape. The sub-catchments delineation, the network-stream stream definition and the its hierarchical classification have been obtained. obtained The he DEM (resolution 30x30m) of the catchment is reported in Figure 4 and the isochorones map is reported in Figure 5. General information about the catchment are shown in Table 2. Table 2. General basin information: S (Area), L (Main channel chann lenght), Hm (mean Elevation). S [km2]
460
L [km]
≈35
H m [a.m.s.l.]
333
Figure 4. DEM (30×30m) of the catchment catchme (13°41’01”N, 2°12’19”O – Yatenga region, Burkina Faso).
Figure 5. Isochrone map.
6.3 Preliminary hydrological elaborations The maps of basin physical characteristics, the rainfall data and the hydrometric data having the proper time resolution are not yet available for the study. As a consequence, only preliminary hydrological elaborations could be performed pe moving from the topographical data. As a first step in the perspective of the estimation of the outlet water discharge, the hydrological model of the Width Function Instantaneous Unit Hydrograph (WFIUH) has been implemented. The WF(x) has been obtained ined by the distribution of the number of equidistant raster-cells raster cells (normalized) from the basin outlet. The calibration parameters of WFIUHD are the surface runoff velocity (m/s) and the diffusivity (m2/s). In the present application, cause to the low DEM resolution and to the extremely low slope of the area, a preliminary result has been reached fixing a uniform velocity value. In doing so the drainage-water drainage water travel times WF(t) distribution maintains the same shape of the probability density function of the hydrologic-travel travel distances WF(x). The uniform value of the surface velocity has been estimated by the ratio between the longest flow path of the basin and the time of concentration, (Tc) that is defined as the time from the beginning of a storm event until until the entire basin is contributing to the flow at the outlet. Tc has been estimated trough the widespread Giandotti equation22:
Tc =
4 Ω + 1 .5 L 1 .8 ∆ Z
(4)
where Tc is expressed in hours, Ω (km2) is the total surface of the basin, L (km) is the length of the main water course and ∆Z (m) is the difference between the mean elevation of the basin and the elevation of the basin outlet. The obtained Tc value was about 10 hours. A velocity value of about 1m/s has been estimated. The flat basin conformation and the presence of width wetland areas and lakes during the rainfall seasons, induce to consider a significant influence of the diffusive parameter (D) in the runoff wave formation23. A sensitivity analysis has been performed in order too assess the effect of D. Figure 6 displays the WFIUHD obtained varying D between 10-3 m3/s (b), 10-2 m3/s (c) and 10-1 m3/s (d). It can be noted how that the variation of D are quite influent on the resulting IUH. Particularly the increments in D value involve a lower peak value of the WFIUH, which comports lower peak discharges and consequently a lower risk of flooding events. The calibration of the proper D value will be focused in the further developments of the study.
Figure 6. The WFIUH of the the study cathcment (a). The WFIUHD affected by dispersion effects with D=10-3 m3/s (b), D=10-2 m3/s (c) and D=10-1 m3/s (d).
7. CONCLUSIONS In this paper we presented the rationale and the preliminary results of a project devoted to use high reolution COSMOSkyMed data for implementation, calibration and verification of hydrological models. The hydrological model, as well as most of the remote sensing processing, was developed with open source instruments, in order to guarantee the availability at almost no cost of the final results to the final users. In particular, we presented the preliminary results relative to the extraction of topographic information and the derivation of geo-morphological parameters for the set up of the Width Function Instantaneous Unit Hydrograph (WFIUH) model. The obtained results encourage following the idea that the new high resolution SAR data can provide an innovative and powerful instrument for the implementation of hydrological models, in developing countries, at a limited cost with a benefit for the living condition of local people. The complete series of SAR data, which will be available after March 2012, will allow for many further developments of the study. A satellite image sequence will contribute to the WFIUH model calibration supporting the comparison of flooded areas during the rainy season with model results. The extraction of maps for different soils parameters will allow for the implementation of the SWAT model.
REFERENCES [1] Koussoubé Y. 2010, “ Hydrogéologie des séries sédimentaires de la dépression piézométrique du Gondo, (Bassin du Sourou) – Burkina Faso / Mali”, Thèse de Doctorat, UPMC Sorbonne Universités, (2010). [2] Springer, D.,”Towards integrating GIS Modelling and Software”, pp. 451-459, (2000). [3] Di Martino, G. , Iodice, A., Riccio, D. , Ruello, G. ,“A Novel Approach for Disaster Monitoring: Fractal Models and Tools”, IEEE Geosci. Remote Sens., vol. 45, pp. 1559-1570, (2007).
[4] Ciervo, F. , Di Martino, G. , Iodice, A. , Koussoube, Y. , Papa, M.N. , Riccio, D. , Ruello, G. , Zinno, I. “Use of high resolution SAR data for the monitoring of water resources in Burkina Faso”. Proceedings of SPIEE Remote Sensing, 19 - 22 September, Prague, Czech Republic (2011). [5] AAVV, “Recensement général de la population du Burkina Faso”, Institut national de la statistique et de la démographie du Burkina Faso INSD, (2006). [6] Arnold ,JG, Srinivasan, R, Muttiah, RS, Williams, JR.. “Large area hydrologic modeling and assessment part I: model development”. Journal of the American Water Resources Association 34: 73–89, (1998). [7] Srinivasan, R, Ramanarayanan, TS, Arnold, JG, Bednarz, ST, “Large area hydrologic modeling and assessment part II: model application”. Journal of the American Water Resources Association 34: 91–101, (1998). [8] Arnold, J.G., Fohrer, N., “SWAT 2000: current cap abilities and research opportunities in applied watershed modeling”. Hydrological Processes 19 (3) 563-572. (2005). [9] Jayakrishnan, R., Srinivasan, R., Santhi, C., Arnold, J.G., “Advances in the application of the SWAT model for water resources management”. Hydrological Processes 19 (3) 749-762. (2005). [10] AAVV, “National Engineering Handbook, Section 4 Hydrology”. USDA: Washington, DC. (1972). [11] Green, WH, Ampt, GA. “Studies on soil physics: Part I. The flow of air and water through soils”. Journal of Agricultural Science 4: 1–24. (1911). [12] Williams, JR, Brendt, HD. “Sediment yield prediction based on watershed hydrology”. Transactions of the ASAE 20: 1100–1104. (1977). [13] Dooge, J. C. I. “Linear theory of hydrologic systems”, Tech. Bull. n° 1468, Agricultural Research Service, USDA, Washington. (1973). [14] Mesa, O. J. and Mifflin, E. R., “On the relative role of hillslope and network geometry in hydrologic response”, in Gupta V. K., Rodriguez-Iturbe I. and Wood E. F. (EDS), Scale Problems in Hydrology. Reidel, Dordrecht. pp 159-184 (1986). [15] Rodriguez-Iturbe, I., Gonzalez-Sanabria, M, Bras, R. “A geomorphoclimatic theory on the Instantaneos Unit Hydrograph”, Water Resour. Res. 18(4), pp 877-886. (1982). [16] Van der Tak, L.D., Bras, R.L., “Incorporating hillslope effects into the geomorphological instantanous hydrogaph”, Water Resources Research, 26 (10): 2393-2400. (1990). [17] Rinaldo, A., Marani, A., Rigon, R., “Geomorphological dispersion”, Water Resources Research. 27 (4) 513-525 (1991). [18] Maidment, D.R., Olivera, F., Calver, A., Eatherall, A. “Unit Hydrograph derived from a spatially distributed velocity field”, Hydrological Processes, 10, pp 831-844. (1996). [19] Band, L.E., “Topographic partition of watersheds with digital elevation models”. Water Resources Research 22 (1) 15-24. (1986). [20] Mark, D.M., Dozier, J., Frew, J., “Automated basin delineation from digital elevation data”. GeoProcessing, 2, 299-311. (1984). [21] Franceschetti, G. and Riccio, D., “Scattering, Natural Surfaces and Fractals”, Elsevier, (2006). [22] Giandotti, M. “Previsione delle piene e delle magre dei corsi d’acqua”, Ministero del LL.PP., Servizio Idrografico Italiano, Memorie e studi idrografici, vol.8, Roma, Pubbl.n.2, SII, (1934) [23] Rigon, R. “Influenza della morfologia di un bacino montano sui caratteri della risposta idrologica”, 23° Convegno di idraulica e costruzioni idrauliche, D.337, Firenze (1996).