Remote Sens. 2013, 5, 3101-3122; doi:10.3390/rs5063101 OPEN ACCESS
Remote Sensing ISSN 2072-4292 www.mdpi.com/journal/remotesensing Article
Evaluation of Digital Classification of Polarimetric SAR Data for Iron-Mineralized Laterites Mapping in the Amazon Region Arnaldo de Q. da Silva 1,*, Waldir R. Paradella 2, Corina C. Freitas 2 and Cleber G. Oliveira 3 1
2
3
Institute of Geoscience, Federal University of Pará(UFPA), Rua Augusto Corrêa, 01-Guamá, Caixa postal 479, Belém-PA, 66075-110, Brazil National Institute for Space Research (INPE), Av. dos Astronautas, 1758-Jardim da Granja, Caixa Postal 515, São Josédos Campos-SP, 12227-010, Brazil; E-Mails:
[email protected] (W.R.P.);
[email protected] (C.C.F.) Latitude Consultoria Ltd., Av. São João, 2400-C-201-Jardim Colinas, São Josédos Campos-SP, 12242-000, Brazil; E-Mail:
[email protected]
* Author to whom correspondence should be addressed; E-Mail:
[email protected]; Tel.: +55-91-3201-7393; Fax: +55-91-3201-7609. Received: 28 April 2013; in revised form: 12 June 2013 / Accepted: 13 June 2013 / Published: 20 June 2013
Abstract: This study evaluates the potential of C- and L-band polarimetric SAR data for the discrimination of iron-mineralized laterites in the Brazilian Amazon region. The study area is the N1 plateau located on the northern border of the Carajás Mineral Province, the most important Brazilian mineral province which has numerous mineral deposits, particularly the world’s largest iron deposits. The plateau is covered by low-density savanna-type vegetation (campus rupestres) which contrasts visibly with the dense equatorial forest. The laterites are subdivided into three units: chemical crust, iron-ore duricrust, and hematite, of which only the latter two are of economic interest. Full polarimetric data from the airborne R99B sensor of the SIVAM/CENSIPAM (L-band) system and the RADARSAT-2 satellite (C-band) were evaluated. The study focused on an assessment of distinct schemes for digital classification based on decomposition theory and hybrid approach, which incorporates statistical analysis as input data derived from the target decomposition modeling. The results indicated that the polarimetric classifications presented a poor performance, with global Kappa values below 0.20. The accuracy for the identification of units of economic interest varied from 55% to 89%, albeit with high commission error values. In addition, the results using L-band were considered superior
Remote Sens. 2013, 5
3102
compared to C-band, which suggest that the roughness scale for laterite discrimination in the area is nearer to L than to C-band. Keywords: polarimetric Carajás Province
SAR;
digital
classification;
geology/laterites
mapping;
1. Introduction The use of radar images in geological surveys is a well-established procedure, and has been employed in several studies in the moist tropics, such as integrated, multisource data procedures [1–5], monoscopic and stereoscopic visual analysis [6], and digital classification based on textural attributes [7]. In all these cases, the data were analyzed based on the amplitude or intensity of the backscattered signal. These approaches exploit primarily the brightness and texture of the images in different configurations of viewing geometry, polarization, and frequencies. However, when using intensity, only part of the signal attributes is available for deriving target information. This limitation can be overcome through the use of polarimetric data, on which intensity and vector phase representing the electromagnetic wave polarization of each pixel are fully measured and recorded. Techniques based on the target decomposition theory and statistical properties of the backscattered signal constitute the primary approach to the radar polarimetric classifications, which are used mainly in environmental applications, particularly for forest type classifications [8]. On the other hand, geosciences applications using polarimetric data are still scarce in radar literature, given that this kind of data has only become available with the advent of ALOS (2004) and RADARSAT-2 (2007) satellites. Trisasongko et al. [9] presented one of the few examples of the application of SAR polarimetry in geology using classification techniques for tailing deposits mapping on a mining area in Indonesia. Hugenholtz and van der Sanden [10] also used airborne C-band polarimetric images to map different types of coastal environments in the intertidal zone of Bay of Fundy, Canada. Ramsey III., et al. [11] applied decomposition in L-band polarimetric images acquired by unmanned airborne vehicle to assess environmental impacts on coastal marshes of Barataria Bay disaster caused by the oil spill in the Gulf of Mexico. This technique was also used by Yonezawa et al. [12] to examine landslides caused by an earthquake in northern Japan using L-band images from PALSAR/ALOS. Thus, the objective of the present investigation is to evaluate the potential of polarimetric L- and C-bands data for discrimination of iron-mineralized laterites in the N1 iron deposit, located in the Carajás Mineral Province, easternmost border of the Brazilian Amazon region. This study is an outgrowth of previous researches of the authors focusing on the use of orbital SAR data to improve the critical lack of environmental and geological information in Carajás Province. Due to the economic importance of this area, there is a practical need to provide accurate and up-to-date surface maps to support mineral exploration and environmental programs.
Remote Sens. 2013, 5
3103
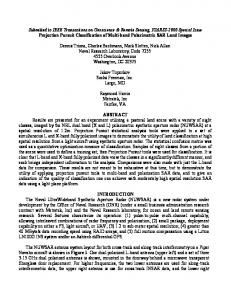
2. Study Area Fully owned by Vale mining company, the world’s biggest producer of iron ore and pellets and the world’s second largest miner, Carajás Province contains known reserves of the order of 18 billion tons with an average grade of 65.4% Fe content. Following these discoveries, numerous other metalliferous deposits have been identified including manganese, alumina, nickel, tin, gold, platinum group elements and copper. More recently, the area has been recognized as a major copper-gold province, after the discovery of a number of world-class iron oxide, copper-gold deposits, and an emerging nickel laterite district, making Carajás an important and under-explored metallogenic province. The N1 deposit is the first of a series of similar plateaus located in the northern border of the Carajás Mineral Province (CMP), in the central-southern region of Parástate (Figure 1). This deposit is part of a 24 km2 plateau that contains approximately 854 million tons with 66.4% iron concentration [7]. Since 1967, when the deposit was discovered, a remarkable geobotanical control has been characterized, which is expressed by the iron-mineralized laterites and low-density savanna-type vegetation (campus rupestres) contrasting markedly with the dense rainforest found in the surrounding area [13]. Figure 1. Location of the study area in the Brazilian state of Pará.
The CMP is part of the Archean tectonic domain known as the Itacaiúnas Shear Belt, found in the eastern portion of the Amazonian craton, which is composed of high-grade metamorphic complexes, volcanic-sedimentary sequences, and granite-greenstone terrains [14]. The Carajás Belt is a highly mineralized province, with enormous reserves of iron and manganese, as well as Au-Cu deposits encompassing the Carajás gold-copper belt [15]. The N1 area has rocks of the Grão ParáGroup, and has been subdivided into two units: volcanic rocks of the Parauapebas Formation [16], and the ironstones of the Carajás Formation [17]. The volcanic-sedimentary sequences of the Carajás region are covered by a thick layer of laterite, which was probably formed during the lower Tertiary. During
Remote Sens. 2013, 5
3104
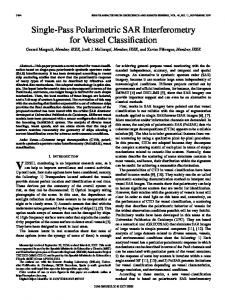
the upper Tertiary and the Quaternary, the area was subjected to a regional uplifting that led to the dissection of the lateritic cover and the formation of the individual plateaus observed in the present day [18]. The ironstones of the Carajás Formation are composed of distinct types of iron ore from oxide facies, mainly jaspelite and interlayered hematite and silica types. Due to a deep lateritic weathering caused by the humid tropical climate conditions, ferruginous lateritic duricrusts and latosoils are well developed in the whole plateau, showing varying degrees of weathering expressed by differences in mineral composition, hardness and texture. The lateritic crusts are covered by a specific low-dense savanna-type vegetation (―campus rupestres‖), characterized by a dominance of low bushes (mostly herbaceous grass-like plants, shrubs and herbs). The presence of arboreal components is restricted [13]. The N1 plateau was mapped in the late 1960s (Figure 2(a)) during the economic evaluation of the iron reserves in the Province [19] and the ferruginous crusts were classified as: duricrust (in situ duricrusts with limonite blocks), chemical crust (hematite fragments with goethitic pisolites), iron-ore duricrusts (hematite ore blocks and subordinately specularite, cemented with hydrous ferric oxides) and hematite (mainly outcrops). However, for field operational purposes, the laterite crusts are currently classified by Vale mining company, in just two classifications: a chemical crust which covers the volcanic rocks, and an iron-ore duricrust, consisting of iron mineralization, with a 15–20 m thick layer, and considered to be a good indicator for surveying of deposits [20]. For the purpose of this investigation, an integrated surficial geological map was produced, which took into account the previous and the current information produced by Vale. This map was used as the reference map for the validation of the products generated by the digital classification (Figure 2(b)). In this map, the hematite and iron-ore duricrust classes were grouped as a single entity—referred to as the economic interest ore class—while the remaining classes from the original map were grouped together as the chemical crust class. Figure 2. (a) Map of the surface geology of the N1 plateau presented by Resende and Barbosa (1974) [19]; (b) Reference map for this study adapted from [19] used for the validation of the classifications.
(a)
(b)
Remote Sens. 2013, 5
3105
3. Material and Methods The present study was based on the analysis of L-band images obtained from the airborne SAR-R99B sensor, and C-band images from the orbital RADARSAT-2 sensor. For the acquisition of L-band data, the airborne sensor SAR-R99B from the Brazilian SIVAM (Amazon Surveillance System) was used. The SAR-R99B was developed by MacDonald Dettwiler and was installed on a modified EMBRAER jet (EMB-145) presenting fully polarimetric L-band mapping mode attributes. The SAR-R99B images used in the present study were provided through an extensive airborne acquisition campaign carried out in 2005, as part of the simulation mission MAPSAR, a German-Brazilian feasibility study focusing on an L-band light SAR [21]. The calibration of the airborne images was done in three steps, the first one was the antenna pattern correction, the second was the polarimetric calibration and the last one was the estimation of the sigma nought based on the response of the trihedral corner reflectors deployed in the field during the flight campaign. Details of these procedures can be found in [22]. The polarimetric calibration was based on the method of Quegan [23], in which the system noise is corrected using the crosstalk and imbalance channel techniques, in addition to absolute calibration based on the peak potential technique using the backscattered cross-section of the corner reflectors. The values obtained in the calibration of the R99B images were considered to be satisfactory by Mura et al. [22] and the quality of the images was reinforced by crosstalk levels of less than −30 dB. On the other hand, the quality of the RADARSAT-2 polarimetric images is supported by the values of the 0.3 dB imbalance channel and −40 dB crosstalk [24]. The RADARSAT-2 images available for the investigation were provided under the Science and Operational Applications Research (SOAR) programme, and refer to a Fine Quad Pol mode (FQP) coverage in ascending orbit, acquired over the study area in November 2008. It is important to mention that both SAR data can be considered as related to the dry season, since no relevant variation of moisture was associated with the acquisitions. The main characteristics of the SAR dataset are shown in Table 1. Table 1. Characteristics of the SAR images acquired by the R99B and RADARSAT-2 sensors. Sensor
Parameter
R99B
RADARSAT-2
Frequency GHz (Band)
1.28 (L)
5.40 (C)
Wave length (cm)
23.9
5.6
Polarization
HH/HV/VH/VV
HH/HV/VH/VV
(Acquisition mode)
(Quad-Pol)
(Fine-Quad-Pol)
Processing level
SLC *
SLC *
Type of data (n. de looks)
Polarimetric (8)
Polarimetric (1)
Resolution/m (rg × az.)
6.0 × 0.5
5.2 × 7.6
Pixel spacing/cm (rg × az.)
2.5 × 1 (slant)
4.73 ×4.98 (slant)
Orbit
Descending
Ascending
Acquisition date
15/June/2005
15/Nov/2008
Incidence angle interval
53.37°–67.23°
31.297°–32.987°
* SLC—Single Look Complex.
Remote Sens. 2013, 5
3106
The R99B and RADARSAT-2 images were processed in Single Look Complex (SLC) format. The images were converted to scattering matrix [S] and then to covariance [C] and coherence [T] matrices. In order to reduce speckle the modified Lee filter (5 × 5 window) was then applied to the data. The polarimetric classifiers evaluated here were based on the target decomposition theorem. The principal aim of this theorem is to characterize the target polarimetric responses as a combination of polarimetric responses to canonical scattering mechanisms, in which the proportional contribution of each scattering to the mean response is represented by the scattering coefficient [25]. The techniques proposed by Freeman and Durden [26] and Cloude and Pottier [27] were evaluated in this investigation. The Freeman-Durden approach decomposes a measured covariance matrix [C] into three scattering matrices corresponding to rough surface scatter (first-order Bragg surface scatter), volume scatter (canopy scatter from randomly oriented dipole), and a double bounce scatter based on physical model. These components are the principal elements in the backscattering from natural terrain [28]. The covariance matrix [C] for reciprocal media (or isotropic natural targets) is defined as: (1) where and are a target vector and transpose, respectively, * denote complex conjugate, denote ensemble averaging operation. Sij is the scattering coefficient, transmitted in the j polarization plane, and received in the i polarization plane. The model estimates the contribution of each of these components to total scattering as: (2) where is the covariance matrix of the volumetric scattering, is the covariance matrix of surface scattering, and is the covariance matrix of double-bounce scattering. The terms , , and are the surface, double-bounce, and volume scatter components, respectively, and correspond to the individual contribution of each scattering component to the final matrix of covariance. The contribution of each scattering mechanism to the total power P is estimated as: (3) where (4) α and β are a ratio of hh backscatter to vv backscatter concerning the double bounce and surface scattering. The technique developed by Cloude and Pottier [27] considers that the information contained in the coherence matrix [T] is the result of the contribution of the three types of scattering mechanisms, in which each scattering is modeled by a canonical target represented by its scattering matrix , based on the expression: (5)
Remote Sens. 2013, 5
3107
where are the eigenvalues of and its related eigenvector. The relative importance of each scattering to the value of is given by the eigenvalue derived from the coherence matrix [27]. In order to simplify the analysis of the physical information provided by the eigenvector-eigenvalue decomposition procedure, three secondary parameters are defined as a function of the eigenvectors and eigenvalues of (i) Entropy (H), which measures the degree of randomness or statistical disorder of the scattering process (H = 0 indicates the presence of a totally polarized signal, which implies that the scattering is controlled by a pure or localized target, whereas H = 1 implies that scattering is due to a number of well-distributed targets); (ii) Anisotropy (A), defined as a complementary parameter to entropy, which provide information on the relative importance of the second and third scattering mechanisms based on the relationship between their respective eigenvalues (λ2 and λ3). In practical terms, anisotropy may be used as a source of discrimination when H > 0.7. This is because, when entropy is low, and are affected considerably by noise, as is anisotropy [29]; (iii) Mean alpha angle ( ) stands for the indicator of the mean scattering mechanism. A value close to zero relates surface reflection for scattering, from a dipole equals π/4 and reaches π/2 when the target consists in a metallic dihedral scatterer. The H and parameters clearly define the scattering characteristics of a medium, and the plane formed by these values is used as a reference for the classification procedures. The H- is divided into nine zones [27]. The limits of each zone are arbitrary and the absolute magnitude of the eigenvalues and other angles are not incorporated into the classification scheme [29]. Table 2 shows a nine-zone segmentation scheme and represents scattering mechanisms on the H- plane [12]. Table 2. The H- plane partioned into nine zone (adapted from Cloude and Pottier [27]). Zone
Entropy, H
Alpha,
(°)
Scattering Type
1
0.9–1.0
55–90
High Entropy Multiple Scattering
2
0.9–1.0
40–45
High Entropy Vegetation Scattering
3
0.9–1.0
0–40
High Entropy Surface Scattering
4
0.5–0.9
50–90
Medium Entropy Multiple Scattering
5
0.5–0.9
40–50
Medium Entropy Vegetation Scattering
6
0.5–0.9
0–40
Medium Entropy Surface Scattering
7
0–0.5
47.5–90
Low Entropy Multiple Scattering Events
8
0–0.5
42.5–47.5
Low Entropy Dipole Scattering
9
0–0.5
0–42.5
Low Entropy Surface Scattering
Cloude and Pottier [27] developed an approach derived from the reference system based on the H plane by aggregating a new dimension provided by the anisotropy values. Each valid zone on the H plane was divided into two, with an anisotropy value of 0.5 being accepted as an arbitrary cutoff point. According to the authors, this new 3D reference space permits the resolution of ambiguities in entropy which may arise in the scattering mechanisms which have different eigenvalue distributions, but similar values of intermediate entropy.
Remote Sens. 2013, 5
3108
A second category of classifiers evaluated in the study, was the hybrid methods that use the results derived from the target decomposition methods as input data for a combined classification scheme based on statistical properties. The pixels are classified based on the statistical distance derived from the complex Wishart multivariate distribution, calculated from the covariance matrix [30]. Lee et al. [31] proposed a method that uses the classes resulting from the target decomposition scheme of Cloude and Pottier (H- plane) as input. Pottier and Lee [32] subsequently introduced anisotropy A into the reference space and increased the number of initial training classes to 16. In both algorithms, however, the final classification may be substantially different from the initial version, which means that pixels originally allocated to one zone may migrate to a different one, characterized by distinct mechanisms of scattering. According to Lee et al. [33], this is due to the fact that the Wishart interactions are based solely on the statistical characteristics of each pixel, without taking its physical scattering characteristics during the interactions into account. Lee et al. [33] presented a new classification system, in which the decomposition method developed by Freeman and Durden [24] is used initially to generate the training classes for the subsequent interactions of the Wishart K-mean classifier, grouping the pixels into three classes based on the predominant scattering mechanism (volumetric, double-bounce or surface). The advantage of this approach is that it preserves the characteristics of the pixel scattering mechanisms. For this, the Wishart interactions were restricted to the pixels present in each class, avoiding the possibility that a pixel initially allocated to one class, e.g., volumetric, might be classified differently by the end of the process. Following the final classification, each class is automatically assigned to a color, according to the predominant scattering mechanism—blue (surface), green (volumetric), and red (double-bounce). The variation in the brightness of the tone of each color corresponds to the mean potential of the class within each category. The error matrices obtained from the cross-referencing of the classified images with the reference map were used to analyze the results of the classification quantitatively [34]. The processed images were orthorectified to a Universal Transverse Mercator (UTM) Zone-22 projection with a WGS84 datum. The images were orthorectified after the polarimetric analysis was completed because orthorectification could corrupt the phase information contained in the polarimetric images. The orthorectification process was performed with the Rational Function Model function of the Orthoengine module of PCI Geomatica. A SRTM DEM and ground control points (GCPs) extracted from Landsat-7 ETM+ images were used in the process. The planimetric accuracies expressed by Root Mean Square Error (RMSE) were 7.54 m and 7.75 m to R99B and RADARSAT-2, respectively. During the validation process, the classes resulting from the classifications were also combined. This is allowed for a range of possible combinations, given that it is a subjective procedure, but in order to minimize the subjectivity of this procedure, it was based on the arrangement that best coincided spatially with the units of the combined geological surface map of Resende and Barbosa (Figure 2(b)). Measurements of superficial roughness were taken from 74 sites on the N1 plateau, of which 28 coincided with the chemical crust, 28 with the mineral crust, and 18 with hematite. The parameter used here was the standard deviation of the vertical height of the terrain profile Hrms [35]. A meshboard technique was used that involved placing a thin plastic gridded board (1.2 m long × 20 cm height and 2 cm intervals grid) on the surface, taking a picture of the plate, and digitizing the picture [36]. Six profile measurements were taken continuously at each site, producing a 7.2 long transect (multisite database of 1.2 m profiles). The use of this long length was necessary to avoid
Remote Sens. 2013, 5
3109
profile too short so that the roughness data could be smaller than the intrinsic values. In addition, this dimension was also close to the spatial resolution of the orbital and airborne SAR data. 4. Results and Discussion 4.1. Polarimetric Decomposition Method 4.1.1. Cloude-Pottier Method The images corresponding to the parameters entropy, anisotropy, and mean alpha angle derived from the Cloude-Pottier decomposition method applied to the R99B data are shown in Figure 3. The entropy image (Figure 3(a)) indicates that on N1, the targets present a high degree of randomness, which suggests that at least two scattering mechanisms make a major contribution to the backscattering value, except for the areas adjacent to lakes, where the surface of the rocks is probably smoother. The values are clustered around the 45°mark (37°< < 54°). However, the asymmetric histogram in Figure 3(b), in which the mode is among the larger angles, indicates that the majority of the targets present a scattering mechanism resulting from a combination of volumetric with double-bounce (to a much lesser extent). The anisotropy values (Figure 3(c)) were mainly low, with a mode of approximately 0.20. This indicates that the second and third scattering mechanisms have a similar contribution to the total backscattering, and are far less important than the first mechanism. According to Lee and Pottier [29], this situation may correspond to a simple dominant scattering mechanism or a type of random scattering. The total scattering of the areas in which anisotropy values are close to the mean is affected by two mechanisms. Figure 3. Images resulting from the parameters derived from the eigenvalue-eigenvector decomposition model for the R99B image: (a) entropy; (b) mean alpha angle; (c) anisotropy.
The results of the classification based on the H- reference plane are shown in Figure 4(a). It is observed that the majority of the area of N1 is located in zone 2 (blue), characterized by high entropy and scattering of the volumetric type, with some double-bounce. Zone 5 was also characterized by volumetric component, which can be identified in the image as magenta color, which appears in the domain of the smoother surfaces. This class is different from the former one due to its lower entropy
Remote Sens. 2013, 5
3110
values, which indicates reduced randomness of the scattering contained in the resolution cell of the image. In addition to these two classes, which predominate over most of the surface of the N1 plateau, classes 4 and 8 can be observed in restricted areas. Class 4 is characterized by multiple scattering type with medium entropy, while class 8 is characterized by dipole scattering with low entropy. The incorporation of anisotropy contributed very little to the results of the final classification. Once again, only two classes were predominant, despite the fact that the number of reference zones doubled (Figure 4(b)). These classes correspond to classes 2 and 5 in the H- plane, with anisotropy above 0.5. Figure 4. Classification of the R99B image by the decomposition method based. (a) the H- reference plane; (b) the H- -A reference space.
The maps derived from the RADARSAT-2 images based on entropy (H), the mean alpha angle ( , and anisotropy (A), are shown in Figure 5, respectively. These figures show that entropy is high throughout most of the N1 plateau, indicating that at least two prominent scattering mechanisms affect each cell at the resolution. In contrast with the results obtained for the R99B images, anisotropy has a complementary function for the RADARSAT-2 image, and its use is recommended when H > 0.7 [29]. The values are clustered around 25°, that is, within a range which is affected by volumetric and surface components. Figure 6(a) shows the results of the classification based on the zones defined by the H- plane. The majority of the pixels were assigned to zones 5 and 6, that is, of medium entropy, but with predominance of volumetric, and to a lesser extent, surface components. The pixels that correspond to lakes were assigned to zone 7, characterized by low entropy and scattering of the double-bounce type. The N1 plateau is also characterized by zone 2 pixels, which are dispersed and discontinuous. This zone is associated with low entropy and volumetric component. The incorporation of anisotropy into the H- plane classification scheme (Figure 6(b)) did not improve the performance of this algorithm for the mapping of the lateritic crusts of the N1 plateau. What can be observed in this image is a random distribution of the reference classes, which makes the establishment of a relationship with the geological reference map difficult.
Remote Sens. 2013, 5
3111
Figure 5. Images resulting from the parameters derived from the eigenvector-eigenvalue decomposition model applied to the RADARSAT-2 image: (a) entropy; (b) mean alpha angle; (c) anisotropy.
Figure 6. RADARSAT-2 image classified by the decomposition method: (a) based on the H- reference plane; (b) the H- -A reference space.
4.1.2. Freeman-Durden Polarimetric Decomposition Method The Freeman-Durden polarimetric decomposition method was applied to the analysis of the polarimetric R99B image, resulting in the maps in Figure 7(a–c), which show the individual contribution of the volumetric, superficial, and double-bounce scattering mechanisms, respectively. The color scale in these figures represents the backscattering values, on a linear scale, associated with the respective scattering mechanism. The volumetric component presents the highest absolute values, followed by surface and double-bounce mechanisms. The relative contribution of the different mechanisms to the reflected signal of each pixel can be better observed when an RGB combination is applied (Figure 8). The colors resulting from the combination of the R (volumetric—Pv), G (superficial—Ps), and B (double-bounce—Pd) mechanisms help to understand the relative importance of each mechanism in the backscattered response of the
Remote Sens. 2013, 5
3112
targets. The reddish color indicates the pixels in which volumetric component is predominant. Where the double-bounce mechanism also contributes to total response, the pixels present tones towards magenta, as can be observed in the northwestern and eastern portions of N1 (indicated by the letter A in Figure 8(a)). In the areas in which the color green predominates, scattering component is primarily surface, whereas in the darkened areas, scattering is of the speculate type, indicating the presence of very smooth surfaces. The rocky outcrops in these areas are associated to a flatter surface showing low roughness, and normally represent the chemical duricrust with small lakes. Specular component is detected in the north sector of the plateau, where the terrain was compressed for the construction of a small aircraft landing strip. Figure 7. Images resulting from the Freeman-Durden decomposition method applied to the R99B images, showing the intensity of the different mechanisms in the total backscattering: (a) volumetric; (b) superficial; (c) double-bounce.
Figure 8. (a) RGB combination of the scattering mechanisms derived from the Freeman-Durden for the R99B images. The letters A, B, and C indicate colors associated with the relative contribution of the component mechanisms, as described in the text; (b) Classes labeled according to the relationship between the types of scattering mechanisms derived from the Freeman-Durden decomposition model.
Remote Sens. 2013, 5
3113
There is also a greater contribution of volumetric scattering in the areas where the pixels have been assigned an orange-ochre color (indicated by the letter B in Figure 8(a)), although there is a slight predominance of the surface scattering component over the double-bounce type (Pv > Ps > Pd). The areas around lakes are assigned a bluish color, indicating a greater contribution of double-bounce type over other mechanisms (indicated by the letter C in Figure 8(a)). This is due to the presence of aquatic vegetation in the lakes and on their margins, which grows above the water line. This favors the double-bounce contribution to the backscattered signal, involving the water surface and the plant stems. In addition, the presence of lateritic blocks along the margins of the lakes also contributes to the double-bounce scattering. The reddish color observed in localized areas of the plateau is related to the predominance of volumetric scattering over the other types (Pv >> Ps > Pd). Overall, the Freeman-Durden decomposition results indicates that in large sectors of N1 plateau the total backscattering is related to a medium degree of entropy with effective contribution of at least two types of scattering mechanism. The predominant mechanism in most of N1 is volumetric (or multiple) type, which is evident in Figure 8(b), where different classes were defined and labeled according to the relative contribution of the Freeman-Durden scattering mechanisms to the total backscattering of the resolution element. The relationships that define each class are shown in the figure legend, together with the percentage of the area of each class in N1. The multi-reflection that characterizes the volumetric scattering mechanism is mainly due to the interaction of the microwaves with the highly rough surfaces due to the abundance of rocky blocks resulting from the disintegration of laterites, duricrusts, particularly within the spatial domain of the mineral duricrusts and hematite, and subordinately with the architecture of the bushes of the savanna vegetation. The results of the Freeman-Durden decomposition with RADARSAT-2 data are shown in Figure 9(a–c). Only volumetric scattering has a direct relationship with the surface roughness, providing a reasonable characterization of the smoother areas with lower values of scattering intensity. However, in comparison with the results obtained for the R99B images, the classification results obtained from RADARSAT-2 data can be considered inferior. It is important to mention that RADARSAT-2 images were acquired under wetter conditions and the contribution of moisture and vegetation (leaves) in the detected responses are higher. These influences can explain the poor performance of the orbital data for the laterite discrimination. In Figure 9(d), volumetric, superficial, and double-bounce scattering mechanisms are related to RGB colors. Clearly, the volumetric component contributes most here, given that reddish colors dominate most of the N1 plateau surface, and is in fact more widespread than in the equivalent color composite product derived from the R99B sensor. The areas in cyan indicate an equivalent contribution of the superficial and double-bounce mechanisms. Overall, the results of the Freeman-Durden decomposition of RADARSAT-2 images presented a lower performance compared to R99B data, and suggested that the L band is more sensitive to the variation in the surface roughness on the N1 plateau due to its longer wavelength.
Remote Sens. 2013, 5
3114
Figure 9. Intensities corresponding to the Freeman-Durden decomposition derived from the RADARSAT-2 image: (a) volumetric scattering Pv; (b) surface scattering Ps; (c) double-bounce scattering Pd; (d) the mechanisms are combined through a color composite image (R—Pv, G—Ps, B—Pd); (e) Classes labeled according to the relationship between the types of scattering mechanism derived from the Freeman-Durden decomposition model.
4.2. Classification Methods Based on Hybrid Processes 4.2.1. Wishart-Cloude-Pottier Classification The images resulting from the H- and H- -A methods were used as input for the algorithm based on the Wishart statistical distance as the criterion for the pixels aggregation. The Wishart-Hclassification is shown in Figure 10(a). In order to validate the classification, classes 1, 3, 5, 6, and 7 were combined and assigned to the chemical laterite crust unit, while classes 2, 4, and 8 were considered to represent the class of economic interest (Figure 10(b)). The cross-referencing of the combined classification image with the reference geological map generated an error matrix with a general Kappa value of 0.16, and 55.5% accuracy for the class of economic interest, with omission and commission errors, respectively, of 44.4% and 57.5% (Table 3). Figure 10(c) shows the classification based on the Wishart-H- -A method. The resulting image has 16 classes due to the input from anisotropy. In the color composite product, classes 7, 8, 10, and 16 were considered to represent the
Remote Sens. 2013, 5
3115
economic interest class, while all other classes were defined as chemical crust. For this configuration, the general Kappa value was 0.14, accuracy for the economic interest class was 68%, and omission and commission errors were 32% and 60%, respectively. Figure 10. Classifications of the R99B images using hybrid methods: (a) image classified by the Wishart-H- method; (b) composite image of the classification by the Wishart-H- method; (c) image classified by the Wishart-H- -A method; (d) composite image of the classification by the Wishart-H- -A method.
Table 3. Parameters derived from the error matrix for the evaluation of the performance of the hybrid algorithms of polarimetric classification for the R99B and RADARSAT-2 images: global Kappa, accuracy for the class of economic interest, omission and commission errors. Sensor
Algorithm Wishart-H-
R99B
Global Kappa
Accuracy (%) for the Class of Economic Interest
Omission
Commission Error
Error (%)
(%)
0.16
55
44
58
Wishart-H- -A
0.14
68
32
60
Wishart-Freeman-
0.16
69
31
60
Durden
Remote Sens. 2013, 5
3116 Table 3. Cont.
Sensor
Algorithm Wishart-H-
RADARSAT-2
Global Kappa
Accuracy (%) for the Class of Economic Interest
Omission
Commission Error
Error (%)
(%)
0.09
38
62
59
Wishart-H- -A
0.08
42
58
60
Wishart-Freeman-
0.08
51
50
61
Durden
4.2.2. Wishart-Freeman-Durden Classification The classification result by the Wishart-Freeman-Durden algorithm is shown in Figure 11(a). The greenish and bluish colors indicate the predominance of volumetric and superficial scattering mechanisms. The variation in the brightness of the tone of each color corresponds to the mean potential of the class within each category. Combined classes were also used here in order to produce a labeled image with only two classes, one corresponding to the substrate of economic interest, and the other to country rocks (Figure 11(b)), for comparison with the combined geological reference map. The error matrix of the cross-referencing of the two maps had a global Kappa index of 0.16, but accuracy of 69% for the economic interest class, omission error of 31%, and commission error of 60%. Figure 11. Classification of the R99B images using hybrid methods: (a) image classified by the Wishart-Freman-Durden method; (b) composite image classified by the Wishart-Freman-Durden method.
The hybrid methods were also applied to the RADARSAT-2 images. The results proved to be inferior to those of the images of the R99B sensor, as shown through the statistical parameters derived from the error matrix, shown in Table 3. 4.3. Discussion The results of the present study provide a way to evaluate the importance of the phase attribute aiming at the discrimination of the lateritic crusts in the study area. In order to address this subject, it is
Remote Sens. 2013, 5
3117
necessary to consider the results of Morais et al. [37] dealing with L-band SAR images for lateritic mapping in the same plateau. In this previous study, textural classification attributes were derived from first and second order measurements obtained from the matrix of co-occurrence of the gray levels (MCGL), using the multipolarized L-band images from the same sensor (R99B). The textural approach was based solely on the amplitude attribute of the microwave signal. While the validation procedures adopted in this previous study were not strictly the same of the present research, it is possible to make some comparisons. In this work the authors obtained an accuracy of 19% for iron-ore crust and hematite. The identification rate (Accuracy (%) in Table 2 (column 4)) for the class of economic interest clearly indicates that the inclusion of phase attribute had a positive effect, considering that, even with the classification that produced the worst result (Wishart-H- ) has provided an accuracy of 55% for the unit of economic interest. When the performance of the classifiers for the L and C band images is evaluated, the results for the L band are clearly superior. So far, few studies were published focusing on the evaluation of polarimetric classifiers for geological mapping, which makes it difficult to establish a discussion with our results. Some works have been developed relating polarimetric signatures with rock types [38] or with lava flows changes over time, closely related to roughness variation [38,39]. One of the conclusions from Evans et al. [38] showed that an extremely rough surface would yield similar polarimetric characteristics to those observed in vegetated areas due to multiple scatter. This explains the predominance of volume scattering observed in both Freeman-Durden and Cloude-Pottier decompositions caused by multiple scattering of rough surfaces of duricrusts. A recent article from Shelat et al. [40] assessed the effect of RADARSAT-2 incidence angle on polarimetric classifications for mapping surficial materials (bedrock, boulders, organic deposits, sand and gravel, thick till with dense vegetation, thick till with sparse vegetation, and thin till) in Arctic Canada. Polarimetric analyses included computation of polarimetric signatures, Wishart supervised classification, as well as Wishart-H- , Wishart-H- -A and Wishart-Freeman-Durden unsupervised classifications. One of conclusions of this research is that RADARSAT-2 images with medium incidence angle (around 32 degrees) produced the best overall polarimetric classification accuracy. This incidence angle was almost the same used in Carajás and it suggests that the low RADARSAT-2 performance in our research cannot be attributed to viewing geometry. Given that the surface moisture presented small variation between the acquisition dates for RADARSAT-2 and R99B imageries, the difference in performance is probably due to way that roughness of the landscape is perceived by the sensors. The effective classification of roughness surface depends on the sensor wavelength and incidence angle. One of the criteria for surface roughness classification was proposed by Peake and Oliver [41], which establishes three categories—smooth, intermediate, and rough—based on the limits defined by the following expressions: Smooth surface hrms
Intermediate surface
25cos inc
25cos inc
hrms
4cos inc
Rough surface hrms
4cos inc
(6)
where λ and θinc are the wavelength and the incidence angle, respectively, and hrms is the standard deviation of the surface height variation [35]. Table 4 shows the limits between the roughness categories, based on the Peake and Oliver [41] criteria for the SAR configurations in the present study.
Remote Sens. 2013, 5
3118
Table 4. Limits of the roughness categories calculated according to the criterion of Peake and Oliver [41] for the RADARSAT-2 and R99B images. The first column shows the wavelength (λ) and angle of incidence (θi) values for each type of image. Roughness Smooth
Intermediate
Rough
hrms