Use of Tangible and Augmented Reality Models in ...
Recommend Documents
... 3D virtual objects by manipulating a tangible object; such as a simple paper card. .... they would use normal playing cards, such as turning them over, rotating them ..... view, multiple camera transformations will be found, one for each marker.
Macromedia Director. Many designers from traditional design disciplines such as industrial and graphical design are contributing to the development of HCI by ...
clear, the fits or benefits of a specific application or interface can be only validated ... evaluationâ and âreal settingâ to mean that the technology was used by participants in .... augmented with a wireless button and a retro-reflecting sur
tangible user interface and interactive media art. We simplified the ... Multimedia authoring tools, such as ... MIDAS stands for Media Interaction Design Authoring.
that a need exists for more efficient development tools. Most current AR applications are built using low level programming with dedicated tracking and graphics.
The evolving technology of computer auto-fabrication. ("3-D printing") now makes it possible to produce physical models for complex biological molecules and.
Previously, the difference between a workstation and a hand- held device required a different ... to the standard OpenGL 3.2 API, which makes it attractive to use advanced shader-based ... http://www.khronos.org/opengles/sdk/docs/ · man/.
These will include notepad computers and PDAs together with 3D immersive displays. .... The current system uses a Dell Inspiron 8000 Laptop. It has an Nvidia ...
Keywords: Augmented Reality, Ambient Interfaces, Tangible Interfaces. ... Similar to this earlier work, Ambient Intelligence [4] has the goal of embedding.
They demonstrate that these techniques can be run on hand- ..... and the weights to provide real physical sources and only run ... Cannonball Game.
tion logic, and is produced on the fly through view gener- ation, so .... The canonical tour guide application was our first choice as an ..... context wall. Context of.
Sean White Levi Lister Steven Feiner. Columbia University. ABSTRACT. Tangible Augmented Reality (AR) systems imbue physical ob- jects with the ability to ...
variants of âelectronic strippingâ were then proposed, culminating. Air traffic control. (ATC) guides aircraft to maintain safe distances and to optimize traffic fluidity.
Abstract. In this demonstration we show a computer vision based Augmented Reality system called Magic Paddle. This system has been designed to support a ...Missing:
Apr 18, 2017 - [6] used a haptic device for surgical simulation to reduce a protruded zygoma and to in- sert an implant into a chin. Mandibular angle reduction ...
offers the opportunity to train the surgical gesture before carrying it out. ... bone landmarks are very reliable and allow an eased registration of the virtual .... This method is based on the domain decomposition theory and is optimized so.
{wlee, wwoo}@gist.ac.kr. Jongweon Lee. Department of Digital ... merging augmented reality with computer entertainment. In Magicbook, users can interact with ...
systems: head, body, and world. The in-situ menu also serves as a 3D model selection/placement tool and a collaborative feature between an outdoor AR user ...
manipulates the model to view it from different angles (Zoom,. Pan, Rotate). With the unique capabilities of HoloLens, i
lations which allow people to access an online world, called simply 'the Net'. Within ... computer graphics that exist in essence or effect, but not formally or actually .... Examples for AR systems that support remote collaboration can be found in.
The Call for Presentations is open through July 15, 2012. ...... tudinal and cross-cultural studies. Some- .... art as a category to the Arts Olympiad in 2004. At the ...
... the user carried out interactive spatial tasks using 3 different size/shape to prop ... showed users preferred and performed better when tangible props were used ... remaining details of the experiment due to lack of space and ask you to refer to
... of the Manipal Technologies Ltd, is a content service company that provides end-to-end services across the content v
... in terms of pre-media solutions, web and app development, gaming, anima- .... At Manipal Digital, we work with some
Use of Tangible and Augmented Reality Models in ...
Author keywords: Engineering graphics; Tangible model; Augmented reality. Introduction. In general ... tive multimedia computer tutorials (Lieu 1999), and 3D solid mod- .... orthogonal and pictorial illustrations drawn on paper or displayed.
Use of Tangible and Augmented Reality Models in Engineering Graphics Courses
Downloaded from ascelibrary.org by National Taiwan University on 08/20/14. Copyright ASCE. For personal use only; all rights reserved.
Yi-Chen Chen1; Hung-Lin Chi2; Wei-Han Hung3; and Shih-Chung Kang4
Typically, the development of skills in viewing and drawing engineering graphics is an essential component of technology courses for second year undergraduate students at universities. Engineering graphics is, thus, an indispensable and compulsory course in civil engineering and other areas of study that involve mechanics or chemistry. For such courses, educators spend most of their time teaching students how to use software quickly and efficiently for designing digital engineering graphics. However, building spatial transfer abilities are still the most important component of graphics courses (Ciupaila and Zemkaukas, 2005) and is also the most difficult to be taught effectively (Salkind 1976). The traditional method for teaching spatial skills is to let students analyze and compare pictorial and orthogonal views on paper. However, this method has limited use for conceptualizing the structure owing to a lack of interaction between the reader and the images. The “interaction” herein refers to the way students use images to understand the geometric properties of the described object. Using merely two-dimensional images to teach spatial skills, students’ perceptions are limited to partial views and information provided on paper. The relationships of different faces of an object are represented by different shapes and lines. Hence, the traditional method of teaching does not allow students to acquire such spatial transfer skills (in-plane images to real structures) in an optimal way. As such, the problem of strengthening these skills is an ongoing topic in engineering education. Past research into the application of spatial ability in engineering education has suggested that motor activity contributes to the comprehension of the concept of space (Onyancha et al. 2009). This includes deconstructing and constructing objects, and observing and describing objects from various visual angles and relative positions. Recently, researchers have integrated various computer
J. Prof. Issues Eng. Educ. Pract. 2011.137:267-276.
Downloaded from ascelibrary.org by National Taiwan University on 08/20/14. Copyright ASCE. For personal use only; all rights reserved.
technologies, such as Web3D, augmented reality (Liarokapis et al. 2004), virtual and augmented reality (Dünser et al. 2006), interactive multimedia computer tutorials (Lieu 1999), and 3D solid models (Martín-Dorta et al. 2008) into engineering education. The research presented in this paper makes use of the augmented reality model and tangible model approaches to develop teaching methods that develop the spatial ability of students in engineering graphics in an optimal way. Tangible models refer to physical objects which are used as teaching aids, such as molecular models in chemistry and organ models in medical science. The tangible model we developed to aid the teaching of engineering graphics comprises a set of eight differently shaped pieces of wood. Students can hold, rotate, and join the pieces together, allowing them to rotate or disassemble the models they construct. As the model is physical, the tangible model allows for the rotation and inspection of each piece from an infinite array of angles, which stimulates the students’ multiple senses and thus provides a more complete view and understanding than 2D representations. We expected that the experience of handling a physical model would help students to better comprehend the corresponding graphics and assist them in developing abstract spatial concepts. This would also allow students to draw deeper connections between 2D representations, the geometric features of the physical model, and their spatial perceptions. In addition to the tangible model, we developed an augmented reality model using integrated augmented reality (AR) technology. Augmented reality is a computer technology which can superimpose 3D virtual models on media that captured images from the real world. The augmented reality models are the virtual model with typical graphics geometries used in the augmented reality environment. Augmented reality models add virtual objects into the real world to simulate an actual model (Azuma 1997). There is, thus, potential to build teaching models that incorporate this technology in the classroom (Kaufmann 2003; Weghorst 2003). Interaction between users and computers occurs at the interface, and a userfriendly interface allows the user to operate the software and hardware with ease (Strong and Smith 2001; Stone et al. 2005). As with the tangible model approach, the human-computer interface allows students to inspect and interact with the model (Nirmalakhandan et al. 2007). Felder and Silverman (1988) showed that such supplementary teaching materials can raise students’ levels of curiosity and intention to learn and allows them to touch and actively participate with the model. The application of augmented reality models, thus, encourages students to integrate the knowledge drawn from both their visual and spatial experiences. In this study, students used the tangible and augmented reality models in a supervised test environment. The results of the test were compared with the traditional training method for interpreting 3D-rendered images and orthogonal diagrams to determine whether the models we proposed were helpful in increasing the efficiency with which students developed their spatial abilities.
Research Focus and Steps This research investigates learning effectiveness and learning efficiency for spatial organization and focuses on three modeling aids: (1) tangible models; (2) augmented reality models; and (3) traditional pictorial and orthogonal drawings. Using these models in a user test, we determined the relative effectiveness of each as a teaching method in strengthening students’ spatial abilities in perceiving relationships between orthogonal views, pictorial views, 3D-rendered images, and physical models. The research steps are summarized as follows:
1. Determination of a set of geometric features: Commonly used textbooks for engineering graphics courses (Luzadder and Duff 1993; Giesecke et al. 1994; Bertoline et al. 1995; Bertoline 2009) were examined to determine a set of fundamental geometric features that should be studied. 2. Development of a tangible model: We collected and analyzed recent studies regarding engineering graphics and spatial ability to establish the theoretical models of this research. A tangible model suitable for engineering graphics courses was designed. 3. Development of an augmented reality model: We created a model using augmented reality and developed a user-friendly interface suitable for engineering graphics courses. 4. Question and answer test: We developed a test to measure a student’s ability to use each model to interpret orthogonal and pictorial views as well as 3D-rendered images. The test results were used to determine the most effective teaching method for engineering graphics courses.
Research Subjects As the study was designed to determine the degree to which the proposed methods could increase students’ spatial abilities, all students tested were required to have a basic knowledge of engineering graphics, including general projection theory, 2D engineering drawings, and the classification of line styles. Against this level of basic knowledge, the results of the user tests could, thus, be used to accurately identify the difference in effectiveness between tangible models, augmented reality models, and the traditional methods for interpreting orthogonal and pictorial views.
Consideration for Model Development Traditionally, engineering graphics courses are taught using orthogonal and pictorial illustrations drawn on paper or displayed on computer screens. These traditional aids, herein referred to as the paper-based model, tend to require more time than available to students for proper interpretation. For the tangible and augmented reality models to achieve the design goal, we considered and included the fundamental topics and typical geometries encountered in a typical engineering graphics course. According to the book, Technical Drawing (Giesecke et al. 2003), these topics included features such as normal surfaces, inclined surfaces and edges, oblique surfaces, curved lines and surfaces, and hidden lines. According to the textbook, Fundamentals of Engineering Drawing (Luzadder and Duff 1993), typical geometries include 2D shapes such as rectangles, polygons, and arcs, and solids such as prisms, spheres, and wedges.
Development of Tangible Model Tangible models have been used extensively as teaching aids in many fields such as medical science, chemistry, and geography. While engineering graphics courses similarly require good spatial ability, the tangible models currently available lack the variety of geometrical possibilities that such courses generally address. Therefore, this research aims to develop a tangible model for engineering graphics courses that addresses the existing shortcomings.
Development Procedures As the proposed models are intended to be used as teaching aids, they should represent the typical geometries and fundamental
J. Prof. Issues Eng. Educ. Pract. 2011.137:267-276.
Downloaded from ascelibrary.org by National Taiwan University on 08/20/14. Copyright ASCE. For personal use only; all rights reserved.
topics typically covered in engineering graphics textbooks and in teaching and learning materials. To build a prototype model, we first experimented with the use of styrofoam. Because of the nature of this material, it proved difficult to carve the shapes desired. Therefore, we divided the styrofoam into 27 small cubes. In addition to the convenient transportation and storage of the cubes, the small pieces could also be combined to form a larger cube. The small cubes were cut and combined with others in order to produce several different shapes. During the prototype period, the model’s shape was revised numerous times to address the range of geometries and topics covered in engineering graphics courses. After designing the details of every piece, the sketch model was drawn up as a computer-aided drawing model to prepare for the manufacturing of the models. The tangible models were made from wood because wood models have a long lifetime and can survive damage from dropping and improper handling. The model was manufactured by hand so that it could be assured that every piece would fit together. The tangible model also has a container in which the models can be stored for easy transportation. A draft of the tangible model can be seen in Fig. 1.
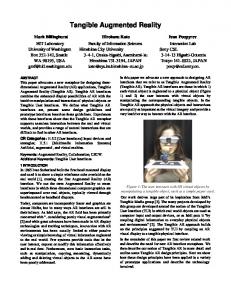
Components of Tangible Model As Fig. 2 shows, the model includes eight unit parts with different shapes that can be combined into a cube. This design allows different shapes to be stored and carried easily. It is clear to the user when a part of the model has been lost, because every part has a fixed and unique position. Users may increase their ability to discern direction, position, and scale by observing, rotating, and moving the unit parts of the model. The part shown in Fig. 2(a) is a typical cylinder, one of the solid modeling primitives because it contains both a curved surface and a
line. The planar surfaces of a cylinder are a rectangle and a circle, which are the typical plane geometries. The circle surface can, thus, be used to teach students about the centerline. In addition, the inclined cutting plane of a cylinder is an ellipse, which is difficult to sketch because of its varying curvature. The part shown in Fig. 2(b) combines two prisms and one wedge. This is quite a simple model and includes only one inclined surface. An important line style of engineering drawing, the hidden line, is presented in one of the side views. The part shown in Fig. 2(c) includes two wedges and one prism. The two wedges point in different directions, which often confuses students as to whether the side views show a hidden line and whether the plane is triangular or rectangular. Furthermore, the different depths of the cutting plane show different scales of the rectangle. The part shown in Fig. 2(d) is half of a cylinder subtracted from a cuboid. It contains a curved surface from a perspective view. The curved surface forms a rectangular shape, and the curved line forms a straight line when the model is projected onto a 2D plane. The part shown in Fig. 2(e) is the result of the addition of one prism and half of a cylinder. The cylinder’s diameter is equal to the prism’s diagonal line. The part shown in Fig. 2(f) has three solid model primitives, that is, a prism, half of a cylinder, and a wedge. The unique characteristic of this model is that, although the six side views always form an “L” shape, this shape arises from different solids. It also has hidden lines that users cannot see and often ignore. Furthermore, it contains both inclined surfaces and curved surfaces. The part shown in Fig. 2(g) is a complicated model which contains more than three solid primitives. This model has a circular hole, a major topic in engineering graphics, and allows instructors to teach the drawing of a centerline. It also has surfaces that are oblique to all planes of projection.
Fig. 1. Draft of tangible model: (a) styrofoam model; (b) wooden model
J. Prof. Issues Eng. Educ. Pract. 2011.137:267-276.
Table 1. Topics and Geometries of Components of Tangible Model Parts
Downloaded from ascelibrary.org by National Taiwan University on 08/20/14. Copyright ASCE. For personal use only; all rights reserved.
(a) (b) (c) (d) (e) (f) (g) (h)
Normal surfaces/edges
Inclined surfaces/edges
× × × × × × × ×
Oblique surfaces/edges
Curved surfaces/lines
Hidden lines
No. of typical geometries
× × × × × × ×
1 2 2 2 3 2 3 3
× × × × × ×
× ×
The part shown in Fig. 2(h) is also a complex model. It has oblique surfaces, the subtraction of a cylinder from part of the model, inclined edges, and a pyramid shape. This model demonstrates numerous basic drawing techniques, including hidden lines, centerlines, holes, and curves. As shown in the summary in Table 1, each unit model demonstrates at least one basic graphical feature or a basic diagram. Beginners learn to draw basic graphical features by relying on illustrations in textbooks. The use of the tangible model helps to demonstrate various basic graphical features, allowing students to practice drawing by observing the graphical features of the models. As can be seen, the tangible model is an effective teaching aid because it can be decomposed and combined into various shapes. Students can rotate the model and observe it, enabling them to increase their spatial abilities through tactile sensations and visual observations of the model. The model has different levels of difficulty and can assist with the teaching of engineering graphics concepts such as basic shapes and view drawing. The model is expected to assist teachers to improve their teaching quality and help students to increase their spatial organization abilities to transform physical objects onto a 2D plane.
Augmented Reality Modeling Augmented Reality Augmented reality technology is envisaged to be an effective application of the human-computer interface through the insertion of virtual objects into the scene of a predominantly real world, thereby enhancing an individual’s perception of his or her environment. In our research, we applied ARToolKitPlus (Langlotz 2010), a software library used to calculate the camera position and orientation relative to physical markers in real-time to insert virtual objects into the real world. This software library enables the development of a wide range of augmented reality applications with ease. Users can
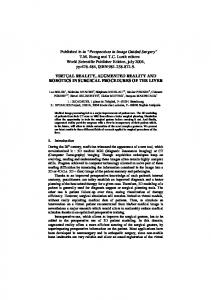
observe the virtual objects inserted using the computer’s display monitor. When a user moves the marker, the virtual object appears to be attached to the real object as it moves correspondingly with the marker, as shown in Fig. 3. To interact with the augmented reality model, the users would have papers with printed markers and run the program on the computer. The view generated by the program shows the video captured by the webcam. To display the augmented reality model, the markers should in view of the webcam. When markers are captured by the webcam, the model would superimpose the image on the markers. As the markers move, the virtual object moves with it, thus enabling users to rotate the markers and to observe the different perspective views of models. Augmented Reality Models The augmented reality models are also intended to address the fundamental topics taught in engineering graphics courses, including an inclined surface, oblique surface, curved line and surface, hidden line, and the typical geometries, as mentioned in the “Consideration for Model Development” section. The augmented reality models are more flexible than the tangible models because augmented reality uses a computer programming language, allowing models to be constructed with less time. We constructed eight models in the augmented reality environment as shown in Fig. 4. The complexity of these models ranged from the simple to the more complicated. However, they all addressed important topics and typical geometries encountered in engineering graphics courses. The model shown in Fig. 4(a) is a cuboid with the subtraction of a cylinder. Although the model is quite simple, it can be used to teach students about the centerline, as well as the drawing and labeling of the circle. In addition, the model also demonstrates a normal surface and curved line. The model shown in Fig. 4(b) is the union of a cylinder and a wedge, containing an inclined and curved surface. The intersection plane is an ellipse and consists of a curved line. The utility of this model is that it can assist students in understanding the relationships among various different shapes. The model shown in Fig. 4(c) contains two inclined faces pointing in different directions. Although the model does not appear to contain an inclined surface when observed from the top view, it is clear that it contains an inclined surface when observed from several alternative views. As such, this model can be used to introduce students to the concept of an inclined surface. The model shown in Fig. 4(d) is a block of normal difficulty and is suitable as a starting point for studying more complex models. The model contains two typical geometries, that is, a wedge and a combination of prisms, and consists of a normal surface, inclined surface, and hidden lines. The models shown in Figs. 4(e) and 4(f) are models of greater complexity and consist of several geometries, inclined faces, and
J. Prof. Issues Eng. Educ. Pract. 2011.137:267-276.
Downloaded from ascelibrary.org by National Taiwan University on 08/20/14. Copyright ASCE. For personal use only; all rights reserved.
Fig. 4. The augmented reality models
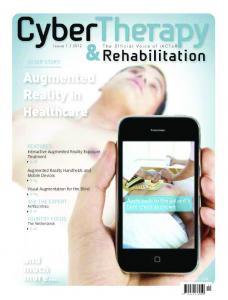
cavities. These models can assist in training students in the observation of the models and the drawing of the necessary views. When viewed from the top, the model shown in Fig. 4(g) is a hexagon with a triangle missing and another triangle inclined. This model is of greater complexity when viewed on its side owing to the presence of the hidden lines, although its top view is symmetric. The model shown in Fig. 4(h) is a relatively simple model. The model consists of an oblique surface connecting the two inclined surfaces together. This model is a helpful aid in teaching students the concept of an oblique surface without being confused by the presence of other concepts. The features of each model are listed in Table 2. Interface of Augmented Reality Model The interface for the augmented reality model developed in our research contains two major sections. As shown in Fig. 5, the left side consists of a window which displays a combination of the virtual object and the video captured from the attached webcam. The right side of the interface displays pictures which show the side views of the virtual object. When a user places the marker in the webcam’s field of vision, the video displayed on the left section shows the augmented reality object, while pictures on the right side display the corresponding side views. When users move the marker, the virtual object moves with it so that users can observe it from any point of view. Users can observe the physical object and match it to the 2D side views, allowing for the efficient mental transformation between physical objects and 2D views. A slider bar is available at the bottom of the window which allows users to scale the size of the virtual objects.
User Test We conducted a user test in order to measure the usability of both the tangible and augmented reality models, as well as for determining whether the models improved the spatial ability of students.
Test Design Procedures The case study focused on transformations from 2D images into 3D objects and projections. The types of 3D objects in the test included the tangible model, the augmented reality model, and the paperbased model. The aim was to compare the efficiency of the three models in teaching students about transformations and projections. Five steps were involved in designing the test: Step 1: Question types—We decided to employ a multiple choice question format and divided the questions into several parts. Step 2: Question design—The questions were designed to be of different difficulties, as well as to address basic graphical features. Step 3: Computerization—After designing the questions, the images and 3D models were drawn using computer software, and a user-friendly interface was designed for the test. Step 4: Preliminary test—We undertook a preliminary test to adjust the difficulty and suitability of the test, as well as solving the problems arising from the preliminary test. Step 5: Formal test—After the above-mentioned steps were completed, a formal test was held, with the results collected for analysis.
Table 2. Topics and Geometries in Components of Augmented Reality Models Part
J. Prof. Issues Eng. Educ. Pract. 2011.137:267-276.
Downloaded from ascelibrary.org by National Taiwan University on 08/20/14. Copyright ASCE. For personal use only; all rights reserved.
Fig. 5. Augmented reality interface used in this research
Test Participants Thirty-six third year students in a vocational school participated in the study. All of the test participants were enrolled in a course related to engineering graphics and had no previous experience with augmented reality applications. Before the actual test, the participants were taught how to use the tangible model and the augmented reality model. Similarly, they were guided to familiarize themselves with the test process and operation of the test system.
Test Procedures The test focused on spatial transformations, which included transforming 2D images into 3D objects and mapping 3D objects into 2D images. As shown in Fig. 6, the test contained five parts: mapping tangible models to 2D images, mapping augmented reality models to 2D images, mapping paper-based models to 2D images, transforming 2D images into 3D paper-based models, and transforming 2D images into 3D augmented reality models. The questions were multiple choice; participants observed an object and then chose the answer option which corresponded with the objects presented in the question. Every part of the test had a time limit and contained questions of varying difficulty. All participants needed to go through all five parts in five different orders of taking
Fig. 6. Test structure
the test. At the conclusion of the test, to gather opinions about the test, participants were asked to complete a questionnaire. The test results detail whether each question was answered correctly, the time required to answer each question, and the questionnaire results. The score was defined as the number of correct answers divided by the total number of questions answered. The time required to answer questions was calculated in seconds, and the calculated efficiency in answering the questions was the reciprocal of the time taken to answer the question. It should be noted that “learning efficiency” is defined as the time required for participants to make answer choices, presumably affected by how well the models were able to provide sufficient knowledge for the participants to be able to choose an answer. We did not consider the correctness of the answers in this case. Both qualitative and quantitative data analyses were performed on the results. The quantitative data included scores and answering efficiencies. The qualitative data was collected from the questionnaire in order to understand the participants’ opinions of the test.
Test Results Scores The scores represent the accuracy of the participants’ answers after viewing the question, recognizing the problem, considering the solution, and selecting the desired answer. Participants selected their answers according to their observations of the different model types presented. Scores were only calculated on the basis of questions actually answered by the participants. The score can thus be thought of as an indicator of the effectiveness of the different types of models in assisting the participants in choosing the correct answer through recognizing the graphical features and shapes present in each object. The high scoring group represents participants whose scores were higher than the mean of all the scores and the low scoring group represents participants whose scores were lower than the mean of all the scores. The maximum score was 10; the mean score
J. Prof. Issues Eng. Educ. Pract. 2011.137:267-276.
Downloaded from ascelibrary.org by National Taiwan University on 08/20/14. Copyright ASCE. For personal use only; all rights reserved.
was 7.53 for transforming 2D images into 3D objects, and 7.09 for mapping 3D objects to 2D images. As shown in Table 3, for participants mapping 3D models to 2D images, the scores show that the tangible models (avg. 7.79; SD 1.38) scored higher than the augmented reality models (avg. 7.08; SD 1.62), and the augmented reality models scored higher than paper-based models (avg. 5.67; SD 1.49). When transforming 2D images into 3D models, the paper-based models (avg. 7.64; SD 1.20) scored higher than the augmented reality models (avg. 7.50; SD 1.51). As shown in Table 4, the results for participants mapping 3D models to 2D images in the high scoring group show that the tangible models (avg. 8.37; SD 0.91) scored higher than the augmented reality models (avg. 7.62; SD 1.03), and the augmented reality models scored higher than paper-based models (avg. 7.07; SD 1.25). When transforming 2D images into 3D models, the augmented reality models (avg. 8.54; SD 1.32) scored higher than the paper-based model (avg. 8.27; SD 0.88). As shown in Table 5, for participants in the low scoring group who mapped 3D models to 2D images, the scores show that the tangible models (avg. 7.03; SD 1.41) scored higher than the augmented reality models (avg. 6.37; SD 1.70), and the augmented reality models scored higher than paper-based models (avg. 4.69; SD 1.26). When transforming 2D images into 3D models, the paper-based models (avg. 7.12; SD 1.18) scored higher than the augmented reality models (avg. 6.62; SD 1.02).
The efficiency with which questions were answered was calculated as the reciprocal of the time taken to answer a question. It represents the efficiency of the different model types in showing the graphical features which allow participants to recognize
the shapes needed to choose the answer. The efficiency with which questions were answered was calculated using both correct and incorrect answers but ignored questions which were not answered. The time taken to answer a question was measured in seconds. The efficiency with which questions were answered is shown in Table 6 for all participants mapping 3D models to 2D images. Paper-based models (avg.0.054; SD 0.018) were more efficient than the tangible models (avg. 0.047; SD 0.011), and the tangible models were more efficient than the augmented reality models (avg. 0.042; SD 0.014). When transforming 2D images into 3D models, the paper-based models (avg. 0.056; SD 0.017) were more efficient than the augmented reality models (avg. 0.030; SD 0.013). The efficiency with which questions were answered for participants in the high scoring group is shown in Table 7. When mapping 3D models to 2D images, participants using the augmented reality model (avg. 0.047; SD 0.013) were faster than those using the tangible models (avg. 0.046; SD 0.011), and the tangible models were faster than the paper-based models (avg. 0.045; SD 0.012). When transforming 2D images into 3D models, participants using the paper-based models (avg. 0.055; SD 0.018) were faster than those using the augmented reality models (avg. 0.030; SD 0.016). The efficiency with which questions were answered for participants in the low scoring group is shown in Table 8. When mapping 3D models to 2D images, participants using the paper-based models (avg. 0.059; SD 0.020) were faster than those using the tangible models (avg. 0.050; SD 0.012), and those using tangible models were faster than those using augmented reality models (avg. 0.044; SD 0.015). When transforming 2D images into 3D models, participants using the paper-based models (avg. 0.057; SD 0.017) were faster than those using the augmented reality models (avg. 0.031; SD 0.012).
Table 3. Scores of All Participants
Table 6. Efficiency of All Participants in Answering Questions
Efficiency with which Questions Were Answered
Tangible 3D → 2D Paper-based 3D → 2D AR 3D → 2D 2D → paper-based 3D 2D →AR 3D
Minimum
Maximum
Mean
Std. deviation
3.57 2.67 1.54 5.00 5.00
10.00 9.09 9.44 10.00 10.00
7.79 5.67 7.08 7.64 7.50
1.38 1.62 1.49 1.20 1.51
Table 4. Scores of High Scoring Group
Tangible 3D → 2D Paper-based 3D → 2D AR 3D → 2D 2D → paper-based 3D 2D → AR 3D
Maximum
Mean
Std. deviation
.0308 .0211 .0191 .0254 .0077
.0714 .0948 .0733 .0897 .0627
.0470 .0540 .0423 .0569 .0308
.0116 .0182 .0135 .0174 .0138
Table 7. Efficiency of High Scoring Group in Answering Questions
Minimum
Maximum
Mean
Std. deviation
5.83 5.00 5.29 7.00 5.00
10.00 9.23 9.44 10.00 10.00
8.37 7.08 7.63 8.27 8.55
0.91 1.26 1.03 0.88 1.33
Table 5. Scores of Low Scoring Group
Tangible 3D → 2D Paper-based 3D → 2D AR 3D → 2D 2D → paper-based 3D 2D → AR 3D
Tangible 3D → 2D Paper-based 3D → 2D AR 3D → 2D 2D → paper-based 3D 2D → AR 3D
Minimum
Tangible 3D → 2D Paper-based 3D → 2D AR 3D → 2D 2D → paper-based 3D 2D → AR 3D
Minimum
Maximum
Mean
Std. deviation
.0243 .0211 .0193 .0254 .0077
.0712 .0826 .0754 .0897 .0627
.0465 .0454 .0467 .0560 .0302
.0111 .0126 .0133 .0183 .0164
Table 8. Efficiency of Low Scoring Group in Answering Questions
Minimum
Maximum
Mean
Std. deviation
3.57 2.67 1.54 5.00 5.00
9.09 7.50 9.09 10.00 8.33
7.04 4.69 6.37 7.13 6.62
1.41 1.26 1.70 1.19 1.03
Tangible 3D → 2D Paper-based 3D → 2D AR 3D → 2D 2D → paper-based 3D 2D → AR 3D
Difference between the two numbers is significant Mapping 3D objects to 2D images. c Transforming 2D images into 3D objects.
b
b
Significance Test We used a t-test to detect if a significant difference existed between the different types of models. The t-test is any statistical hypothesis test in which the test statistic follows a Student’s t distribution if the null hypothesis is true. As shown in Table 9, according to the results, most of the differences between the models were significant when mapping 3D objects to 2D images but were not significant when transforming 2D images into 3D objects. As shown in Table 10, in terms of the efficiency with which questions were answered, the differences between the models were significant when transforming 2D images into 3D objects. When mapping 3D objects to 2D images, the differences were significant between paper-based models and other models but were not significant in the high scoring group. Questionnaire After the test, the participants were requested to complete a questionnaire in order to collect their opinions of the test. Most participants successfully completed all the steps of the test and thought that it took more time to answer complex graphical figures such as curved surfaces and nonvertical intersections. More than 90% of the participants thought that the tangible model was helpful for gaining spatial ability and enhanced their interest in the subject. Around 75% of the participants agreed that the augmented reality model can enhance their interest in learning and contributes to a diversified curriculum. The results of the questionnaire can be seen in Table 11.
Findings From the case studies and analysis conducted, the following conclusions can be reached: the tangible model contributes to the effective mapping of 3D objects to 2D images; the augmented reality model type has little effect on transforming 2D images into 3D objects; paper-based models lead to higher efficiency when answering
questions; it is important to have better hardware and software equipment and environment; and the new teaching aids increase students’ interest in learning. Tangible Models Enhance Mapping from 3D Objects to 2D Images According to the results of the test scores in mapping 3D objects to 2D images, the tangible models scored higher than augmented reality models, and the augmented reality models scored higher than paper-based models in both the high scoring and low scoring groups. Furthermore, the tangible models scored significantly higher than the augmented reality models and paper-based models based on the t-test results. In mapping 3D objects to 2D images, the tangible models are more advantageous for learning. These results fit well with our observations. The participants who used the tangible models were able to touch, move, and rotate the models and observe any complex or particular views they wanted. The tangible models provide greater sensory stimulation and show all the possible views, allowing participants to obtain more information about the models. The augmented reality models also allow participants to manipulate the objects. However, they are less useful than the tangible models because they provide no tangible sensation and can only be manipulated according to the markers’ available viewing angles. The paper-based models only show particular views of the model. Therefore, users cannot see customized views and also cannot observe the overall model. In addition to the results of the test scores, the standard deviation of the tangible models is smaller than that of the paper-based models. This means that when participants mapped 3D objects to 2D images using the paper-based model, participants with good spatial senses produced better results, whereas participants with poor spatial senses still produced worse results. However, the use of tangible models helped participants with poor spatial senses to obtain better scores.
J. Prof. Issues Eng. Educ. Pract. 2011.137:267-276.
Table 11. Results of Questionnaire Strongly agree (%)
Agree (%)
Neither agree nor disagree (%)
Disagree (%)
Strongly disagree (%)
Part I. Please answer the following questions according to the contents of this test. 1. All steps can be completed successfully. 2. The difficulty of questions in this test is moderate. 3. Visible and hidden lines can be distinguished on planes. 4. Operation of the tangible model is simple. 5. Operation of augmented reality is simple. 6. It takes more time to answer questions containing figures with curved surfaces. 7. It takes more time to answer questions containing figures with nonvertical intersections. 8. It takes more time to answer questions containing figures with nonparallel lines. 9. Questions containing irregular figures take more time to answer. 10. The difficulty of questions in this test is difficult.
5.4 2.7 8.1 18.9 2.7 5.4 10.8 8.1 43.2 10.8
40.5 37.8 43.2 48.6 27.0 54.1 56.8 56.8 37.8 51.4
45.9 51.4 45.9 24.3 48.6 37.8 32.4 32.4 16.2 35.1
8.0 2.7 2.7 8.1 18.9 2.7 0.0 2.7 2.7 2.7
0.0 5.4 0.0 0.0 2.7 0.0 0.0 0.0 0.0 0.0
Part II. Please answer following questions according to the contents of this study. 1. Adding the tangible model to the curriculum can enhance interest in learning. 2. The tangible model can help in developing spatial ability. 3. The tangible model contributes to a diversified curriculum. 4. Adding augmented reality to the curriculum can enhance interest in learning. 5. The augmented reality model can help in developing spatial ability. 6. The augmented reality model contributes to a diversified curriculum. 7. Augmented reality technology still requires improvement.
35.1 51.4 51.4 40.5 29.7 29.7 32.4
56.8 40.5 45.9 35.1 43.2 48.6 24.3
8.1 8.1 2.7 18.9 24.3 18.9 40.5
0.0 0.0 0.0 5.4 2.7 2.7 2.7
0.0 0.0 0.0 0.0 0.0 0.0 0.0
Downloaded from ascelibrary.org by National Taiwan University on 08/20/14. Copyright ASCE. For personal use only; all rights reserved.
Questions
Augmented Reality Model Has Little Effect on Transformation of 2D Images into 3D Objects In the test of transforming 2D images into 3D objects, the scores of the augmented reality models were higher than the scores of the paper-based models in the low scoring group, but these scores were lower than the scores of the paper-based models in the high scoring group. However, both results led to no significant difference. This situation may be caused by the following reasons: When transforming 2D images to 3D objects, the participants observed the 2D views, mentally transformed them into 3D objects, and matched this with the provided answers. This proved to be the most difficult and time-consuming part of the process. No matter what kind of visualization technologies used, paper-based or augmented reality, the participants always had to answer the test questions by going through this process. In this test item, the only difference between the augmented reality and paper-based 3D answer is that augmented reality answers provide a rotate function for the user to more easily match particular features with the model in their mind. However, this expected benefit is not significant in our results. Therefore, the augmented reality model offers no significant advantages in this case. Paper-Based Models Reduce Time for Answering Questions When transforming 2D images into 3D objects, the efficiency of paper-based models is higher than the efficiency of the augmented reality models. The difficult and time-consuming part of the process was the mental transformation of the image into a 3D model. As additional time is required to operate augmented reality models, paper-based models have an advantage in their efficiency in helping users in answering test questions. When mapping 3D objects to 2D images, the efficiency results of the paper-based models were also higher than the tangible and augmented reality models. It is our opinion that the participants were accustomed to the paper-based models that provided less
information, allowing participants to answer questions faster and with less distraction. The tangible models and augmented reality models provide more information, requiring the participants to spend more time carefully observing the models. In addition, it took greater time to operate the system since participants were not familiar with the augmented reality model. The high scoring group of participants had a higher efficiency when answering questions using the augmented reality models. However, the results are not significant. We believe that participants in the high scoring group possess better spatial ability and, in turn, the effect of using different model types is insignificant. New Teaching Aids Increase Students’ Interest in Learning The results of the questionnaire suggested that more than 90% of the participants agreed that the tangible models enhanced their interest in learning and helped in the development of their spatial abilities. About 70% of the participants thought that the augmented reality model resulted in the same improvement as that provided by the tangible models. New teaching aids can thus enhance the participation and interest of students in engineering graphics courses. Students displayed curiosity to the new teaching aids and tended to actively use them. In this process, students gained additional knowledge from the use and application of the new teaching aids. Models Developed in this Research Can Be Further Improved We found that the participants often chose the wrong answer because they used the hardware inappropriately or the environment was not suitable for the use of the hardware. It is important to consider the coordination of use between the hardware and the environment. Furthermore, it is also important to consider the learning curve involved in using the teaching aids. According to the results of the questionnaire, about 67% of the participants thought that the operation of the tangible model was effortless, whereas 57% of the
J. Prof. Issues Eng. Educ. Pract. 2011.137:267-276.
participants thought that augmented reality technology still required improvement.
Downloaded from ascelibrary.org by National Taiwan University on 08/20/14. Copyright ASCE. For personal use only; all rights reserved.
Conclusion The presented research shows the use of tangible and augmented reality models to assist the delivery of engineering education. We developed a tangible model which addressed five geometric features that are the fundamentals taught in engineering graphics courses. From the user test (N ¼ 36), we found that the tangible model helps students better understand physical objects by effectively mapping 3D objects to their projections. Students can observe the features of the models from arbitrary views to increase their spatial understanding. We also developed an augmented reality interface that can display different 3D models and show great potential in enhancing students’ interest in learning. Both tangible and segmented reality models are better able to serve as an effective teaching aid for engineering graphics courses. The use of these models in engineering graphics courses also enables the development of a diversified curriculum.
Acknowledgments We thank Dr. Cho-Chien Lu and Mr. Chung-Pin Wang for gathering the subjects and assisting during the usability test of this research.
References Azuma, R. T. (1997). “A survey of augmented reality.” Presence: Teleoperators Virtual Environ., 6(4), 355–385. Bertoline, G. R. (2009). Introduction to graphics communications for engineers, McGraw-Hill, Boston. Bertoline, G. R., Wiebe, E. N., Miller, C. L., and Nasman, L. O. (1995). Engineering graphics communication, Richard D. Irwin, Chicago. Ciupaila, L., and Zemkaukas, J. (2005). “Influence of information technologies on engineering graphics models.” J. Polish Soc.
Geom. Eng. Graphics, 15, 50–56. Dünser, A., Steinbügl, K., Kaufmann, H., and Glück, J. (2006). “Virtual and augmented reality as spatial ability training tools.” Proc., 7th ACM SIGCHI Int. Conf., Association for Computing Machinery (ACM), New York, 125–132. Felder, R. M., and Silverman, L. K. (1988). “Learning and teaching styles in engineering education.” J. Eng. Educ., 78(7), 674–681. Giesecke, F. E., et al. (1994). Principles of engineering graphics, Macmillan, New York. Giesecke, F. E., Mitchell, A., Spencer, H. C., Hill, I. L., Dygdon, J. T., and Novak, J. E. (2003). Technical drawing, Prentice Hall, Englewood Cliffs, NJ. Kaufmann, H. (2003). “Collaborative augmented reality in education.” Proc., Imagina 2003 Conf. (CD), Monte Carlo, Monaco. Langlotz, T. (2010). “Handheld augmented reality.” Christian Doppler Laboratory, 〈http://studierstube.icg.tu-graz.ac.at/handheld_ar/artoolkitplus .php〉 (April 1, 2010). Liarokapis, F., et al. (2004). “Web3D and augmented reality to support engineering education.” World Trans. Eng. Technol. Educ., 3(1), 11–14. Lieu, D. K. (1999). “Using interactive multimedia computer tutorials for engineering graphics education.” J. Geom. Graphics, 3(1), 85–91. Luzadder, W. J., and Duff, J. M. (1993). Fundamentals of engineering drawing, Prentice Hall, Englewood Cliffs, NJ. Martín-Dorta, N., Saorín, J. L., and Conteo, M. (2008). “Development of a fast remedial course to improve the spatial abilities of engineering students.” J. Eng. Educ., 97(1), 505–513. Nirmalakhandan, N., Ricketts, C., McShannon, J., and Barrett, S. (2007). “Teaching tools to promote active learning: case study.” J. Prof. Issues Eng. Educ. Pract., 133(1), 31–37. Onyancha, R. M., Derov, M., and Kinsey, B. (2009). “Improvements in spatial ability as a result of targeted training and computer-aided design software use: Analyses of object geometries and rotation types.” J. Eng. Educ., Apr., 157–167. Salkind, N. J. (1976). “A cross-dimensional study of spatial visualization in young children.” J. Genet. Psychol., 129(2), 339–340. Stone, D., Jarrett, C., Woodroffe, M., and Minocha, S. (2005). User interface design and evaluation, Morgan Kaufmann, San Francisco. Strong, S., and Smith, R. (2001). “Spatial visualization: Fundamentals and trends in engineering graphics.” J. Ind. Technol., 18(1), 1–6. Weghorst, S. (2003). “Augmenting tangible molecular models.” Proc., 13th Int. Conf. on Artificial Reality and Telexistence, Tokyo.