1
Implementing Positive Behavior Support in Regular and Alternative High Schools: Use of the Team Implementation Checklist Tary J. Tobin University of Oregon Authors’ Note: Address correspondence to the first author at Educational and Community Supports, 1235 University of Oregon, Eugene, OR 97403-1235. Phone: (541) 346-1423. E-mail:
[email protected]. This project was supported in part by the U.S. Department of Education, Office of Special Education and Rehabilitation, Grants #H324D020031 and #H326S030002. Opinions expressed do not necessarily reflect the policy of the U.S. Department of Education and no official endorsement should be inferred. This paper was presented in 2006 as: Tobin, T. (2006, March 25). Positive behavior support in high schools: use of team implementation checklists. Paper presented at the Association for Positive Behavior Support’s Third International Conference on Positive Behavior Support, Reno, NV. (A pdf file of the ppt used in that presentation is available online as “Regular and Alternative” at http://uoregon.edu/~ttobin )
2 Implementing Positive Behavior Support in Regular and Alternative High Schools: Use of the Team Implementation Checklist The School-wide Positive Behavior Support Implementers’ Blueprint and Self-Assessment (Sugai et al., 2004, available online: http://pbis.org/english/handouts.htm), describes an approach to improving schools in ways that may enable more students to successfully complete high school. High school students with behavior problems often are suspended from school and may be expelled or sent to alternative schools (Morrison & D’Incau, 1997; Souza, 2000). Students’ often react to school discipline negatively (Costenbader & Markson, 1997; Herzog, 2000; Hyman, Stefkovich, & Taich, 2002; Jeffries, Hollowell, & Powell, 2004; Mayer, 1995, 2002; Skiba & Peterson, 1999, 2000). Although evidence supporting their use is lacking and costbenefit ratios have not been established (Sughrue, 2003; Tobin & Sprague, 2002), alternative high schools increasingly are being recommended for students with behavior problems (Campbell, 2000; Heller, 1996; LaFee, 2000; Reavis, 1999; Souza, 2000). School-wide positive behavior support, used systematically, is an approach that may enable high schools to more effectively maintain order while including and instructing students whose behavioral issues put them at risk for exclusion (Netzel & Eber, 2003; Scott et al., 2002; Sugai, 2003, Sugai et al., 2004). School-wide PBS The instrument used to assess the implementation of the school-wide system, the Systems Evaluation Tool (Sugai, Lewis-Palmer, Todd, & Horner, 1999; Horner et al., 2004), measures the extent to which expectations are defined, taught, and positively reinforced; systems for monitoring and responding to violations; use of data for making decisions; and administrative leadership. Although school-wide positive behavior support is not a new concept, it is best known for effective use in elementary schools and middle schools (Lewis, Sugai, & Colvin, 1998; Metzler, Biglan, Rusby, Sprague, 2001; Sugai & Horner, 2002; Sugai, Horner, & Gresham, 2002; TaylorGreene & Kartub, 2000; Tobin, Lewis-Palmer, & Sugai, 2002; Todd, Haugen, Anderson, & Spriggs, 2002). Can high schools implement school-wide Positive Behavior Support (SW-PBS)? Does implementing SW-PBS in high schools impact behavior problems, suspensions, or office discipline referral (ODR) rates? Does the location (e.g., in a city or in a rural area) affect implementation? How are high schools that are attempting to implement SW-PBS using tools and technology, such as the Team Implementation Checklist (TIC, Sugai, Horner, & LewisPalmer, 2001) and the School Wide Information System (SWIS, http://www.swis.org/ )? The reliability of the electronically submitted ODR data has been studied and reported as acceptable (Tobin et al., 2002). Office discipline referrals are valid indicators of school climate (Irvin, Tobin, Sprague, Sugai, & Vincent, 2004). The TIC has not yet been studied as a measure for research, although it appears to be valuable for formative evaluation when used by school PBS teams. The purpose of this report is to describe factors and outcomes related to the implementation of SW-PBS in high schools and to examine information provided on Team Implementation Checklists. Method This analysis used data for the 2003-2004 school year from 42 high schools who provided ODR information electronically, over the Internet, using SWIS and had given
3 permission for its use in research. About half (20) of the schools also reported their use of the Team Implementation Checklist (http://www.pbssurveys.org/pages/TeamChecklist.aspx ). Setting and Participants A range of high schools serving students in grades 9 though 12 were represented and included schools from 13 states: California, Delaware, Florida, Hawaii, Illinois, Iowa, Maryland, Missouri, New Hampshire, New Mexico, New York, North Carolina, and Oregon. A total of 38,659 students were enrolled in these schools. Table 1 presents demographic characteristics (ethnicity and free or reduced lunch) in terms of the average percentage of enrolled students in the schools, based on information available from the National Center for Educational Statistics (NCES, http://nces.ed.gov/). Information from NCES also was used to classify the schools by type (regular or alternative) and, for the regular schools, by location (urban or rural). Although NCES uses a number of categories to describe location, for this study, schools located in or on the fringe of cities were classified as “urban” and schools located in small towns or rural areas, as “rural.” The “regular” schools were all public schools, as were most of the alternative schools. Alternative schools for this study included all schools listed as “alternative” by NCES and one school not listed by NCES but identified from a web search as being a school affiliated with a hospital for youth with mental illness. NCES reported alternative schools as being “Special Education” or “Other.” All but one of the alternative schools were located in urban areas. Table 1 Demographic Characteristics
Average SD
Free or Asian / Reduced American Pacific African Islander Indian Hispanic American Caucasian Lunch 1.27% 12.82% 13.69% 17.10% 55.77% 33.35% 1.89% 2.45% 30.99% 28.94% 30.65% 22.81%
Data Collection and Analysis Schools had previously submitted the data electronically over the Internet. Only schools that had agreed to have their data used in research were included. An extant database was queried to extract records of schools providing data on ODRs and on measures related to PBS. Of the PBS measures, only the Team Implementation Checklist (TIC) had a sufficient number of records (20) for use in statistical analyses. Schools were grouped in two ways. First, as TIC schools if they provided TIC records, or as “NoTIC” schools if not. Second, schools were grouped as regular (further broken down as rural or urban) or alternative. Descriptive statistics and charts were used to study similarities and differences among the groups. In addition, correlations were calculated to study patterns of association among various measures. Two types of measures were used: (a) TIC data on implementation of PBS features and (b) ODR data on suspensions and types of behavior problems. Although there are many different
4 types of behavior problems that can lead to a trip to the principal’s office for discipline, for this study the following categories were operationally defined: “Violent” means referrals for aggression, fighting, harassment, bullying, property damage, vandalism, arson, or for weapons or combustibles. “Antisocial, nonviolent” means referrals for inappropriate language, disrespect, lying, disruption, theft, or dress code violations. “Tardy or Skipping” referred to ODRs for being late or missing classes. “Tobacco, Alcohol, Drugs” referred to ODRs for use or possession of tobacco, alcohol, or drugs. “Other & Unknown” means that that was what was listed for the offense or nothing was listed as the behavior leading to the referral. “Minor” means that the behavior was specifically listed first as “minor” and then with the following additional descriptors: (a) inappropriate language, (b) contact, (c) disrespect, (d) disruption, (e) property misuse, and (f) other. Rates of ODRs were calculated for the total number of ODRs for any reason and also for the different types of behavior problems. All rates are ((# odor/days) /students) * 100. This provides the number of ODRs for the type of behavior involved, per day, per 100 students. It makes it possible to compare across schools with different size enrollments and different numbers of school days. Suspension was studied in three ways. The percentage of enrolled students who had been suspended out of school was determined. For the whole school, at the end of the year, the number of days of out of school and of in-school suspensions was tallied. The Team Implementation Checklist has items grouped by features (see list below). For example, the feature “commitment” is measured by two items, administrative support and staff support. Respondents rate each item as being in place, partially in place, or not in place. “In place” ratings are scored as 2 points; “partially in place” as 1, and “not in place” as 0. The total number of points possible for each feature is calculated by multiplying the number of items by two. The percent of possible points for each feature can then be determined. Although it is recommended that TIC be completed quarterly, the actual number of TICs reported by the participating schools in the 2003-2004 school year ranged from 1 to 10. To compare across schools with different numbers of TIC reports, the average of possible points for each of the PBS features was calculated for each school. In addition, an “Overall” TIC score variable was created for each participating school by finding the sum of their averages for the features. List of Items, Features, and Variables for the Team Implementation Checklist: 1. Commitment
5 • •
Administrator's support and active involvement. Faculty/Staff support (one of top 3 goals, 80% of faculty document support, 3 year timeline). 2. Establish and Maintain Team (Team) • Team established (representative). • Team has regular meeting schedule and effective operating procedures. • Audit completed for efficient integration of team with other teams/initiatives addressing behavior support. 3. Self-Assessment • Team/faculty complete Positive Behavior Support (PBS) Survey (http://www.pbssurveys.org/pages/SelfAssessmentSurvey.aspx ) to self-assess the extent to which all systems are in place (School-wide, Non-classroom Settings, Classroom Settings, and the Individual Student System) • Team summarizes existing school discipline data. • Strengths, areas of immediate focus, and action plan are identified. 4. Expectations Defined • Three to five school-wide behavior expectations are defined. 5. Expectations Taught • School-wide teaching matrix developed. (Specific examples of the expectations are linked to the common areas in the school.) • Teaching plans for school-wide expectations are developed. • School-wide behavioral expectations are taught directly and formally. 6. Reward System • System in place to acknowledge/reward school-wide expectations. 7. Violations System • Clearly defined and consistent consequences and procedures for undesirable behaviors are developed. 8. Information System • Discipline data are gathered, summarized, and reported. 9. Function-Based Support System • Personnel with behavioral expertise are identified and involved. • Plan developed to identify and establish systems for teacher support, functional assessment and support plan development and implementation. As an exploratory study, no hypotheses were formed to predict specific outcomes. Research questions, however, included the following: 1. 2. 3. 4.
How do regular and alternative high schools differ in ODR patterns? Do urban and rural high schools face similar types of behavior problems? How do the features of the TIC correlate with each other? Is frequent use of the TIC report related to high scores indicating that PBS features are being implemented? 5. Are schools using the TIC report similar to schools that do not use the TIC report? 6. What are the types of behavior problems that schools are dealing with and how are the different types correlated?
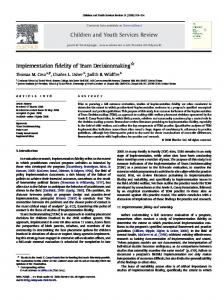
6 7. How many days of in-school and out-of-school suspension are typical for different types of high schools? 8. What percentage of high school students, on average, are suspended from school? 9. Does the TIC appear to be useful (a) a research tool for studying PBS implementation in high schools and (b) as a resource for schools in addressing disciplinary concerns? 10. Based on ODR data patterns and TIC reports, do alternative schools appear to be the solution to the dilemma schools are facing when trying to maintain orderly and safe schools while providing positive behavior support to students at risk for school failure or exclusion due to behavioral issues? Results Results are grouped into the following topics: (a) ODR patterns for regular and alternative schools with TIC reports, (b) characteristics of TIC reports, and (c) multiple comparisons looking at combinations of factors. ODR Patterns for Regular and Alternative Schools Charts and tables are used to describe ODR data using location and type information from NCES: (a) urban, regular high schools (Figure 1, Table 4), (b) rural, regular high schools (Figure 2, Table 5), and (c) alternative high schools (Figure 3, Table 6). Average rates for all schools (with and without TIC reports) are compared in Table 7, according to classification as “regular” or “alternative.” Correlations are shown for (a) all schools, including alternative schools (Table 8), and (b) regular schools without the alternative schools (Table 9).
7 Table 4 Urban, Regular High Schools with Team Implementation Checklists Reported (n = 7): Percent of Students Suspended Out of School and Rates for Different Types of Behaviors
HS ID
% of Violent Antisocial Tardy or Tobacco, Other & Minors Students Nonviolent Skipping Alcohol, Unknown Suspended Drugs Out-ofSchool 2 3 8 4 7 5 1
Average SD
0.13% 0.15% 22.69% 11.05% 15.09% 21.26% 7.89% 11.18% 9.16%
0.007 0.022 0.181 0.032 0.076 0.034 0.042 0.056 0.059
0.131 0.136 0.791 0.254 0.301 0.793 0.064 0.353 0.310
0.376 0.017 0.400 0.251 0.337 0.186 0.025 0.228 0.159
0.000 0.001 0.055 0.011 0.018 0.004 0.014 0.015 0.019
0.000 0.023 0.042 0.053 0.089 0.011 0.002 0.032 0.032
0.000 0.000 0.342 0.000 1.274 0.000 0.019 0.234 0.476
8
Figure 1. Rate by Type of Behavior Problem for Urban, Regular High Schools with TIC Reports 1.40
Rate per Day per 100 Students
1.20
1.00 Violent Antisocial Nonviolent Tardy or Skipping Tobacco, Alcohol, Drugs Other & Unknown Minors
0.80
0.60
0.40
0.20
0.00 2
3
8
4
7
5
High School Code Numbers & Average for Group
1
Average
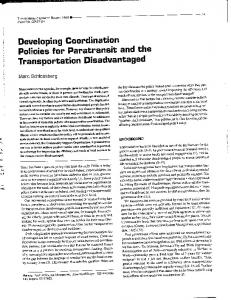
9 Table 5 Rural, Regular High Schools with Team Implementation Checklists Reported (n = 7): Percent of Students Suspended Out of School and Rates for Different Types of Behaviors HS ID
% of Violent Antisocial Tardy or Tobacco, Other & Minors Students Nonviolent Skipping Alcohol, Unknown Suspended Drugs Out 12 12.22% 0.057 0.243 0.234 0.073 0.032 0.000 15 2.16% 0.032 0.109 0.055 0.009 0.015 0.014 10 . 0.041 0.572 0.115 0.000 0.156 0.097 9 9.84% 0.066 0.333 0.670 0.026 0.142 0.229 11 3.00% 0.021 0.301 1.236 0.022 0.031 0.014 14 16.46% 0.122 0.381 0.698 0.058 0.182 0.014 13 8.29% 0.083 0.436 0.230 0.031 0.098 0.003 Average 8.66% 0.060 0.339 0.463 0.031 0.094 0.053 SD 5.47% 0.034 0.147 0.426 0.026 0.068 0.085
10
Figure 2. Rate by Type of Behavior Problem for Rural, Regular High Schools with TIC Reports 1.40
1.20
Rate per Day per 100 Students
1.00
Violent Antisocial Nonviolent Tardy or Skipping Tobacco, Alcohol, Drugs Other & Unknown Minors
0.80
0.60
0.40
0.20
0.00 12
15
10
9
11
14
High School Code Numbers & Group Average
13
Average
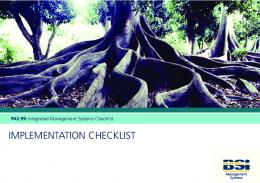
11 Table 6 Alternative High Schools with Team Implementation Checklists Reported (n =6): Percent of Students Suspended Out of School and Rates for Different Types of Behaviors HS ID
% of Violent Antisocial Tardy or Tobacco, Other & Minors Students Nonviolent Skipping Alcohol, Unknown Suspended Drugs Out 6 83.33% 0.882 6.377 2.090 0.142 0.142 14.669 21 40.30% 0.715 5.038 24.049 0.217 0.483 3.637 17 53.85% 0.264 1.633 0.484 0.119 0.414 0.000 18 70.37% 0.286 1.985 0.041 0.051 0.051 1.044 19 118.64% 0.250 1.088 0.010 0.067 0.039 1.213 16 1.10% 0.094 0.240 0.270 0.012 0.006 0.000 Average 61.26% 0.415 2.727 4.490 0.101 0.189 3.427 SD
39.94%
0.309
2.420
9.613
0.073
0.207
5.665
12
Figure 3. Rate by Type of Behavior Problem for Alternative High Schools with TIC Reports
25.00
Rate per Day per 100 Students
20.00
15.00
Violent Antisocial Nonviolent Tardy or Skipping Tobacco, Alcohol, Drugs Other & Unknown Minors
10.00
5.00
0.00 6
21
17
18
19
16
Average
13 Table 7 Comparison of All Regular and Alternative High Schools (N = 42)
Percent of Students Suspended Out ODR Rate Days of In School Suspension Days of Out of School Suspension Number of Students Violent Rate Antisocial Nonviolent Rate Tardy & Skip Rate Tobacco, Alcohol, & Drugs Rate Unknown & Other Rate Minor Rate
Regular High Schools (N = 32) Average Standard Deviation 10% 7% 0.97 1.02 165 335 663 847 1130 589 0.05 0.04 0.34 0.36 0.41 0.56 0.02 0.02 0.06 0.11 0.09 0.24
Alternative High Schools (N = 10) Average Standard Deviation 63% 33% 11.53 10.76 78 175 252 315 249 529 0.66 0.59 3.88 3.36 3.06 7.42 0.10 0.06 0.37 0.45 2.32 4.48
14 Table 8. Pearson Correlation Coefficients for All Schools, Including Alternative (N = 42) ODR Violent Rate
Antisocial Tardy Nonviolent & Skip
Tobacco, Alcohol, & Drug 0.76*** 0.82*** 0.27 0.70***
Unknown Minor & Other
Frequency of TIC Reports 0.67*** 0.43** 0.36* 0.10
Percent Suspended Out 0.57*** 0.60***
Days Suspended Out -0.16 -0.06
Number Enrolled
ODR Rate 1.00 0.67*** 0.74*** 0.52*** -0.38* Violent 1.00 0.98*** 0.76*** -0.22 Antisocial 1.00 Nonviolent 0.35* 0.74*** 0.77*** 0.45* 0.15 0.60*** -0.06 -0.24 Tardy & 1.00 Skip 0.65*** 0.25 0.27 0.43** 0.12 -0.13 -0.25 Tobacco, 1.00 Alcohol, & Drug 0.51*** 0.51*** 0.35* 0.59*** -0.13 -0.49** Unknown 1.00 & Other 0.06 -0.07 0.48** -0.01 -0.11 Minor 1.00 0.53*** 0.46** -0.11 -0.28 Frequency 1.00 of TIC Reports 0.21 -0.21 -0.19 Percent 1.00 Suspended Out -0.06 -0.45** Days 1.00 Suspended Out 0.54*** Number 1.00 Enrolled Note. ODR = Office Discipline Referral. The ODR rate and rates for all types of behavior problems listed on the referrals is calculated using the formula: (((referrals/days of school)/students enrolled)/*100) and indicates the number of referrals per day per 100 students. *p < .05. **p < .01. ***p < .001.
15 Table 9. Pearson Correlation Coefficients for Regular Schools (N = 32) ODR Rate
Violent
Antisoci al Nonviol ent
Tardy & Skip
Tobacco, Unknown Minor Frequency Percent Days of Number Alcohol, & Other of TIC Suspended Suspension Enrolled & Drug Reports Out Out
ODR Rate 1.00 Violent 0.73*** 1.00 Antisocial 1.00 Nonviolent 0.90*** 0.70*** Tardy & 1.00 Skip 0.92*** 0.56*** 0.78*** Tobacco, 1.00 Alcohol, & Drug 0.18 0.52** 0.08 0.13 Unknown 1.00 & Other 0.88*** 0.64*** 0.85*** 0.06 0.06 Minor 0.27 0.27 0.05 0.13 0.13 0.05 1.00 Frequency 1.00 of TIC Reports 0.09 0.27 0.07 0.05 0.05 0.05 0.45* Percent 1.00 0.47** 0.26 0.11 Suspended 0.59*** 0.70*** 0.66*** 0.41* 0.45* Out 1.00 Days Suspended 0.44* -0.04 -0.01 -0.19 0.05 0.05 0.09 -0.01 0.00 Out Number 1.00 Enrolled -0.26 -0.39* -0.27 -0.27 -0.41* -0.35* 0.19 0.01 -0.09 0.48* Note. ODR = Office Discipline Referral. The ODR rate and rates for all types of behavior problems listed on the referrals is calculated using the formula: (((referrals/days of school)/students enrolled)/*100) and indicates the number of referrals per day per 100 students. *p < .05. **p < .01. ***p < .001.
16 Characteristics of TIC Reports Rank ordered from high to low by Overall TIC score, scores for specific TIC features for each school using the TIC reports is shown in Table 10. The highest possible Overall TIC score would by 9. No school had that score but three of the 20 schools had scores over 8, eight had scores over 7, five had scores over 6, and three had scores over 5. Only two schools had lower Overall TIC scores. Table 11 shows how the features on the TIC are associated with each other.
17 Table 10 Team Implementation Checklist Data: Averages of Percent of Possible Points for Each SW-PBS Feature for Each High School
High FunctionSchool Based Code Self- Expectations Expectations Reward Violations Information Support # Commitment Team Assessment Defined Taught System System System System OverallTIC* 11 1 0.79 1 1 0.83 1 1 0.75 1 8.38 19 1 1 1 1 0.83 1 1 0.5 1 8.33 12 1 0.94 1 1 0.94 0.83 1 0.67 0.75 8.13 18 1 0.83 0.83 1 1 1 0.75 0.75 0.75 7.92 10 1 1 1 1 0.83 0.67 0.67 1 0.67 7.83 8 0.63 0.98 0.98 1 1 1 0.94 0.5 0.72 7.75 2 0.75 0.83 0.87 1 0.58 1 1 1 0.69 7.72 17 0.5 1 1 1 0.33 1 1 1 0.5 7.33 4 0.75 0.83 1 1 0.89 0.33 1 1 0.5 7.31 1 1 1 0.72 1 0.58 0.67 0.83 1 0.5 7.31 15 1 0.94 1 1 0.94 0 0.5 1 0.75 7.13 9 0.58 0.72 0.78 1 0.72 0.67 0.67 1 0.75 6.89 6 1 0.97 1 0.8 0.63 0.7 0.45 0.6 0.5 6.65 16 0.95 0.87 0.33 1 0.47 0.8 0.8 0.4 0.75 6.37 21 0.75 0.67 0.83 0.95 0.65 0.95 0.5 0.5 0.25 6.05 3 0.75 0.83 0.42 1 0.25 1 0.5 0.5 0.5 5.75 13 1 0.83 0.5 1 0.5 0.5 0.5 0.25 0.38 5.46 5 0.75 0.63 0.83 0.7 0.57 0.3 0.5 0.4 0.5 5.18 7 0.57 0.67 0.45 0.71 0.5 0.64 0.64 0.43 0.21 4.83 14 0.75 0.33 0.29 0.38 0 0 0.25 0.5 0.31 2.81 *The OverallTIC score is a variable created by finding the sum of the averages of the features. Although it is recommended that TIC be completed quarterly, the actual number of TICs, as shown in the 2nd column, ranged from 1 to 10. To compare across schools, the average of possible points for each of the PBS features was calculated and is shown above.
18 Table 11 Correlations Among Variables Using Data from Schools (n = 20) Using the Team Implementation Checklists Reports Overall
Commit Team
Overall 1.00 Commit 0.33 1.00 Team 0.80*** 0.35 Self Assess 0.77*** 0.15 Define 0.82*** 0.24 Teach 0.78*** 0.36 Reward 0.57** -0.06 Violations 0.79*** -0.01 Information 0.53* -0.04 Function 0.76*** 0.42 Frequency -1.14 -0.03 *p < .05. **p < .01. ***p < .001.
1.00 0.58** 0.78*** 0.53* 0.45* 0.56** 0.35 0.48* -0.04
Self Assess
1.00 0.46* 0.74*** 0.22 0.52** 0.54* 0.49* 0.01
Define
Teach
Reward Violations Information Function Frequency
1.00 0.58** 0.56* 0.62** 0.38 0.53* -0.22
1.00 0.20 0.49* 0.31 0.59** 0.02
1.00 0.57** -0.02 0.34 0.17
1.00 0.40 0.58** -0.21
1.00 0.29 -0.39
1.00 -0.26
1.00
19 Discussion This analysis indicates that: • • • • • •
Urban high schools, as well as rural and alternative high schools, are working on implementing Positive Behavior Support. High schools are using tools and technology related to school-wide PBS. For example, schools are using Team Implementation Checklist and the School-Wide Information System. Alternative high schools are serving students with very high rates of serious problem behaviors yet they are striving to implement PBS. High schools are struggling with the management of behavior problems and continue to rely heavily on out of school suspensions. Full implementation of all features of school-wide PBS does not seem to happen quickly. Rather, it appears that high schools use an incremental, gradual approach. The TIC appears to be a valuable tool for studying on-going implementation efforts. It shows high variability across schools that should be studied further.
Limitations Analysis of extant databases using data entered by schools as a part of their own formative evaluation efforts cannot provide answers to about cause and effect in the way randomized control group studies can. Schools self-selected into the TIC or the NoTIC group. In looking at relationships among TIC features and ODR patterns, it appears that having a high number of ODRs may be a motivating factor in deciding to form a PBS team and to begin using the TIC. This study looked at one school year, combining data from the whole school year. While comparisons were made among different types of schools, within school changes over time were not studied. Although the total number of students involved was very large, more than 38,000, schools were the unit of analysis and the total number of schools was 42. While that is a fairly large sample of schools, for statistical purposes, especially when subdivide into groups, power for statistical analysis is limited. Although the range of types and locations was fairly wide, no inner city schools were included. Answers to Research Questions 1. How do regular and alternative high schools differ in ODR patterns? Alternative schools have much greater discipline problems, both in type and quantity. 2. Do regular high schools in urban and rural areas face similar types of behavior problems? In this study, location did not seem to be an outstanding factor. Individual variations were more noticeable. 3. How do the features of the TIC correlate with each other? With the exception of “Commitment,” most of the TIC features are statistically significantly (p < .05), positively correlated, usually in the moderately to high range.
20 4. Is frequent use of the TIC report related to high scores indicating that PBS features are being implemented? Not in this study. It should be noted that the developers of the TIC recommend that it be used quarterly. The schools in this study varied from 1 to 10 times per year. More frequent use was not related to better scores in a linear fashion. 5. Are schools using the TIC report similar to schools that do not use the TIC report? In this study, the schools were more similar than different. It is possible that some of the schools in the NoTIC group were using the Team Implementation Checklist but not reporting it electronically. In addition, change over time was not studied. Future efforts to study the impact of using the TIC would benefit from observing changes over several years and combining a study of the extant database with interviews or questionnaires to obtain information about implementation factors and school climate issues that are not recorded electronically. 6. What are the types of behavior problems that schools are dealing with and how are the different types correlated? Violent and antisocial nonviolent behavior problems were highly correlated. Schools varied considerably in the different types of behavior problems of concern. For example, some schools had extremely high numbers of ODRs for “Tardy and Skipping” but very few for violent behaviors. Others had the opposite pattern. An advantage of having schools chart and study their own ODR data in PBS team meetings is that this type of formative, internal evaluation empowers school staff to develop interventions and action plans that fit their unique needs. 7. How many days of in-school and out-of-school suspension are typical for different types of high schools? For regular high schools, the average number of days of in-school suspension for the 2003-2004 school year was 165 but for out-of-school suspensions, it was 663. For alternative schools (typically with much smaller enrollments), the average number of days of in-school suspension was 78 and of out-of-school suspension, 252. 8. What percentage of high school students, on average, are suspended from school? In regular schools, 10%. In alternative schools, 63% of the students are suspended, on average, if calculated by dividing the number of students suspended out by the enrollment. However, enrollment data in extant databases typically is based on October data and does not reflect changes that may occur during the year. For example, in some alternative schools, students frequently come and go. By the end of the school year, the total number of students served may be much greater than the enrollment in October. 9. Does the TIC appear to be useful (a) a research tool for studying PBS implementation in high schools and (b) as a resource for schools in addressing disciplinary concerns? As a research tool, the generally moderate to high correlations among the items indicates that the TIC is a coherent measure. In addition, compared to other SW-PBS measures, the TIC, in its user-friendly webbased format, appears to be very practical for repeated use in applied settings and for going to scale. The fact that many schools were using the TIC, and often frequently, indicates that high school educators find it helpful. 10. Based on ODR data patterns and TIC reports, do alternative schools appear to be the solution to the dilemma schools are facing when trying to maintain orderly and safe schools while
21 providing positive behavior support to students at risk for school failure or exclusion due to behavioral issues? Additional research is needed. The extremely high ODR and suspension rates in the alternative schools, particularly for violent behaviors and for potentially addictive behaviors, suggests, first, that if these students remained in the regular schools instead of having the option to attend an alternative school, it would be difficult for the regular school to support the students. On the other hand, it also indicates that even the alternative schools find it difficult to support these students. It is interesting that educators in alternative schools are making an effort to implement SW-PBS and to use the TIC. References Campbell, W. D. (2000). Techniques for dealing with student harassment at the high school level. American Secondary Education, 29(1), 34-37. Eber, L., Sugai, G., Smith, C. R., Scott, T. M. (2002). Wraparound and positive behavioral interventions and supports in the schools. Journal of Emotional and Behavioral Disorders, 10, 171-181. Heller, G. B. (1996, April). Changing the school to reduce student violence: What works? NASSP Bulletin, 80(579), 1-10. Horner, R. H., Sugai, G., & Horner, F. (2000). A schoolwide approach to student discipline. School Administrator, 57(2), 20-23. Horner, R. H., Sugai, G., & Todd, A. W. (2001). “Data” need not be a four-letter word: Using data to improve schoolwide discipline. Beyond Behavior, 11 (1), 20-22. Irvin, L. K., Tobin, T. J., Sprague, J. R., Sugai, G., & Vincent, C. G. (2004). Validity of office discipline referral measures as indices of school-wide behavioral status and effects of school-wide behavioral interventions. Journal of Positive Behavior Interventions, 6(3), 131-147. Kartub, D. T., Taylor-Greene, S., March, R. E., & Horner, R. H. (2000). Reducing hallway noise: A systems approach. Journal of Positive Behavior Interventions, 2, 179-182. LaFee, S. (2000, February). Profiling bad apples. The School Administrator, 57(2), 6-11. Lewis, T. J., Sugai, G., & Colvin, G. (1998). Reducing problem behavior through a school-wide system of effective behavior support: Investigation of a school-wide social skills training program and contextual interventions. School Psychology Review, 27, 446-459. March, R., & Horner, R. H. (2002). Feasibility and contributions of functional behavioral assessment in schools. Journal of Emotional and Behavioral Disorders, 10, 158-170. March, R., Hawken, L., & Green, J. (2003). Schoolwide behavior support: Creating urban schools that accommodate diverse learners. Journal of Special Education Leadership, 16, 15-22. Metzler, C. E., Biglan, A., Rusby, J. C., Sprague, J. R. (2001). Evaluation of a comprehensive behavior management program to improve school-wide positive behavior support. Education and Treatment of Children, 24, 448-479. McCurdy, B. L., Mannella, M. C., & Eldridge, N. (2003). Positive behavior support in urban schools: Can we prevent the escalation of antisocial behavior? Journal of Positive Behavior Interventions, 5, 158-170. Nakasato, J. (2000). Data-Based decision making in Hawaii’s behavior support effort. Journal of Positive Behavior Interventions, 2, 247-251.
22 Netzel, D. M., & Eber, L. (2003). Shifting from reactive to proactive discipline in an urban school district: A change in focus through PBIS implementation. Journal of Positive Behavior Interventions, 5, 71-79. Reavis, C. A., Vinson, D., & Fox, R. (1999, March/April). Importing a culture of success via a strong principal. The Clearing House,72, 199-202. Rosenberg, M. S., & Jackman, L. A. (2003). Development, implementation, and sustainability of comprehensive school-wide behavior management systems. Intervention in School and Clinic, 39, 10-21. Sadler, C. (2000). Effective behavior support: Implementation at the district level: TigardTualatin School District. Journal of Positive Behavior Interventions, 2, 241-243. Safran, S. P., & Oswald, K. (2003). Positive behavior supports: Can schools reshape disciplinary practices? Exceptional Children, 66, 361-373. Scott, T. M. (2001). A schoolwide example of positive behavioral support. Journal of Positive Behavioral Interventions, 3, 88-94. Scott, T. M., & Barrett, S. B. (2004). Using staff and student time engaged in disciplinary procedures to evaluate the impact of school-side PBS. Journal of Positive Behavior Interventions, 6, 21-27. Souza, E. M. (2000). Step Nine: Holding students accountable. Principal Leadership, 1(1), 3439. Sugai, G., & Horner, R. H. (2001). School climate and discipline: Going to scale. Paper presented at the National Summit on the Shared Implementation of IDEA, Washington, D.C. Retrieved August 21, 2004 from http://pbis.org Sugai, G., & Horner, R. H. (2002). The evolution of discipline practices: School-wide positive behavior supports. Child and Family Behavior Therapy, 24, 23-50. (Co-published simultaneously in J. K. Luiselli & C. Diament (Eds.), Behavior psychology in the schools: Innovations in evaluation, support, and consultation (pp. 23-50). NY: The Haworth Press). Sugai, G., Horner, R. H., & Gresham, F. (2002). Behaviorally effective school environments. In M. R. Shinn, G. Stoner, & H. M. Walker (Eds.), Interventions for academic and behavior problems: Preventive and remedial approaches (pp. 315-350). National Association of School Psychologists. Silver Spring, MD. Sughrue, J. A. (2003). Zero tolerance for children: Two wrongs do not make a right. Educational Administration Quarterly, 39, 238-258. Taylor-Greene, S., Brown, D., Nelson, L., Longton, J., Gassman, T., Cohen, J., Swartz, J., Horner, R. H., Sugai, G., & Hall, S. (1997). School-wide behavioral support: Starting the year off right. Journal of Behavioral Education, 7, 99-112. Taylor-Greene, S., & Kartub, D. T. (2000). Durable implementation of school-wide behavior support: The High Five Program. Journal of Positive Behavior Interventions, 2, 233-235. Tobin, T. J., & Sprague, J. R. (2002). Alternative educational programs: Accommodating tertiary level, at-risk students. In M. R. Shinn, G. Stoner, & H. M. Walker (Eds.), Interventions for academic and behavior problems: Preventive and remedial approaches (pp. 961-993). Silver Spring, MD: National Association of School Psychologists. Tidwell, A., Flannery, K. B., Lewis-Palmer, T. (2003). A description of elementary classroom discipline referral patterns. Preventing School Failure, 48, 18-27.
23 Tobin, T. J., Lewis-Palmer, T., & Sugai, G. (2002). School-wide and individualized effective behavior support: An explanation and an example. Behavior Analyst Today, 3, 51-75. Retrieved August 21, 2004, from http://www.behavior-analystonline.org/BAT/BAT31.pdf Todd, A., Haugen, L., Anderson, K., & Spriggs, M. (2002). Teaching recess: Low-cost efforts producing effective results. Journal of Positive Behavior Interventions, 4, 46-52. U.S. Department of Education, National Center for Educational Statistics, National Forum on Educational Statistics. (2002). Safety in numbers: Collecting and using incident data to make a difference in schools, NCES 2002-312, prepared by I. Hantman, G. Bairu, A. Barwick, B. Smith, D. Mack, S. Meston, L. Rocks, & B. James of the Crime, Violence, and Discipline Task Force. Washington, DC. Retrieved from http://www.ed.gov/pubs/edpubs.html on Dec. 12, 2002. Vincent, C. G., Horner, R. H., & Sugai, G. (2002). Developing social competence for all students: ERIC/OSEP Digest. Arlington, VA: ERIC Clearinghouse on Disabilities and Gifted Education. (ERIC Document Reproduction Service No. ED468580).