tive system at different levels of fidelity on different devic- ... platforms and operating systems that all impose their own capabilities and ..... OS: iOs 4.3.3. Medium ...
DIS 2012 • In the Wild
June 11–15, 2012 • Newcastle, UK
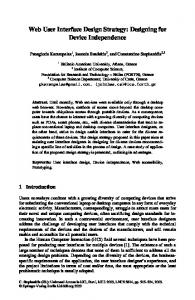
User Interface Design by Collaborative Sketching Ugo Braga Sangiorgi, François Beuvens and Jean Vanderdonckt Louvain Interaction Laboratory, Université catholique de Louvain Pl. Place des Doyens, 1 – B-1348 Louvain-la-Neuve (Belgium) {ugo.sangiorgi, francois.beuvens, jean.vanderdonckt}@uclouvain.be ABSTRACT
(e.g., between technical view and end user view, between managerial view and marketing view) [15]. UI design is recognized as a complex activity that has unique characteristics over traditional design [28]: open (any stakeholder could introduce input at any time), ill-defined (not all constraints imposed by the target system are yet posed), incomplete (not all the UI specifications are known at designtime, but rather evolve significantly over time when design sessions are organized), and iterative (many iterations of the cycle “determine needs – build prototype – evaluate prototype” may be required to end up with an acceptable usability) [26].
User interface design consists of a collaborative activity where various stakeholders can all sketch the future interactive system at different levels of fidelity on different devices and computing platforms. User interfaces sketches are also intended to support prototypes on multiple computing platforms and operating systems that all impose their own capabilities and constraints. In order to support the needs for user interface design by sketching, this paper describes Gambit, a multi-platform system that provides a lightweight approach for prototyping graphical user interfaces by sketching with HTML5. The paper reports on an experiment for the most preferred platform/devices for three primary sketching functions by designers and developers in a Gambit-supported session.
UI design by sketching is an efficient and effective mean [32] that is frequently used for supporting UI design: 97% of interaction designers and UI practitioners rely on sketches [21] to convey their design ideas because it supports creativity while not restricting ideas [1], because it ensures a smooth transition from early prototypes to final UIs at a reasonable cost [6, 32] for the aforementioned design characteristics.
ACM Classification: C.2.4 [Computer-Communication
Networks]: Distributed systems – Distributed applications. D2.2 [Software Engineering]: Design Tools and Techniques – Modules and interfaces; user interfaces. D2.m [Software Engineering]: Miscellaneous – Rapid Prototyping; reusable software. H5.2 [Information interfaces and presentation]: User Interfaces – graphical user interfaces, user interface management system (UIMS).
On the one hand, the “paper and pencil” [1,32] or the whiteboard approaches [4, 5] are frequently used because existing software for UI design by sketching share the same shortcomings: only one person at a time can sketch a UI on one device or computing platform at a time with little or no capability for sharing sketches, only one level of fidelity (e.g., low, medium, or high) is often offered [32]. On the other hand, some systems were developed to support a collaborative design process [3, 10, 11, 13, 16] based on tabletops and related platform/devices [6], but their deployment requires significant hardware and software costs [18] and are not tailored to the specific needs of UI design by sketching.
General terms: Design, Human Factors. Keywords: collaborative sketching, level of fidelity, user interface design. INTRODUCTION
User Interface (UI) design is the collaborative activity where many stakeholders (e.g., end user, designer, developer, graphic expert, project leader, marketing people) [26] could provide their own input [29] in order to contribute to the goal of producing the most usable UI for an interactive system (e.g., a web application, a commercial software, or an in-house development) based on the user experience and usability engineering.
In this paper, the best of both worlds is taken for inspiring Gambit (Gatherings And Meetings with Beamers and Interactive Tablets), a distributed software environment where any user can sketch on any platform/device at any time in a configuration that is flexible enough to address the specific needs of UI design by sketching. The system is developed in HTML5 in order to centralize the development so as to run on many different platforms through a browser.
This activity therefore attempts to accommodate these different inputs into one cohesive design environment that is always made for the ultimate benefit of the end user, thus trying to resolve conflicts posed by the different viewpoints Permission to make digital or hard copies of all or part of this work for personal or classroom use is granted without fee provided that copies are not made or distributed for profit or commercial advantage and that copies bear this notice and the full citation on the first page. To copy otherwise, or republish, to post on servers or to redistribute to lists, requires prior specific permission and/or a fee. DIS 2012, June 12-15, Newcastle, United Kingdom. Copyright 2012 ACM 978-1-4503-1210-3/12/06....$10.00.
For this purpose, this paper is structured as follows: Section 2 reports on previous work; Section 3 motivates Gambit by discussing the design challenges and Section 4 details the software architecture built to address them. Section 5 reports on an experimental study conducted to assess the
378
DIS 2012 • In the Wild
June 11–15, 2012 • Newcastle, UK Environments for Collaborative Design
most preferred configurations during a design session. Section 6 concludes the paper and presents future work.
Software for UI design by sketching also typically support one or two of the three primary sketching functions that a system should offer (as validated empirically in [31]): submit an individual sketching (always), share various sketching from different stakeholders (rarely), and managing the design history (rarely) – see corresponding columns in Table 1).
RELATED WORK
UI design by sketching and tabletop environments for collaborative design are two main fields of research that are related to this work since its originality lies in considering the latter for the former. Table 1 compares some significant works belonging to these two main fields of research.
Software for collaborative design or other activities (e.g., [3, 5, 10, 11, 13, 14, 20, 27, 30, 9, 24]) are typically excellent in gathering different inputs from different stakeholders to gather them on one output platform/device. They also typically support most of these three primary functions, but only at one level of fidelity (see column “levels of fidelity”). In other words, they all consider sketches as drawings or images that are manipulated per se, without any recognition behind (see column “recognition engine”).
User Interface Design by Sketching
UI design by sketching is recognized for several proved virtues such as, but not limited to: maintaining an informal representation to foster creativity [6, 22], complementarity between paper and pencil and software [1, 32], capability to take one design idea at a time and work it out in details [17] or consider alternative designs at a time [15], ability to reveal as much usability problems as if it was a real UI [32, 33]. In addition, paper and computer media have been estimated equally valid for testing sketches [32].
Since the needs of rapid UI prototyping vary depending on the project and allocated resources, the level of fidelity expresses the similarity between the final UI and its corresponding sketch. The level of fidelity is said to be high if the sketch is the closest possible to the final UI. The fidelity is said to be low if the sketch only partially evokes the final UI without representing it in full details. Between high-fidelity (hi-fi) and low-fidelity (low-fi) [18] exists medium-fidelity (me-fi) [6, 32]. A UI sketch usually involves one level of fidelity in current software. But due to the variety of stakeholders’ input, several fidelities are required [7], thus leading to the concept of multi-fidelity, where several levels of fidelity are supported.
Several software exist for supporting UI design by sketching (e.g., [1,6,7,10, 22]) but they are mostly oriented towards supporting one designer a time (see column “# Stakeholders”) working on one computing platform (column “#input device”) at a time serving for both input and output (column “#output device”) simultaneously. These softwares usually support platform/devices running the same operating system, apart from some exceptions that accommodates Java platforms (see column “Operating system”). One notable exception is Designer’s Outpost [18] that uses computer vision to transform physical sticky notes posted on a vertical whiteboard into their digital counterpart for representing navigation between webpages. The deployment cost (see the related column) is probably the highest since it requires calibrating stereoscopic cameras for a single platform/device. Software/ Criteria # Stakeholders
# Input devices
Gambit, the system that will be described and tested in this paper, is different with respect to the state of the art in that it satisfies simultaneously the criteria used for the comparison in Table 1, as depicted at the bottom line.
UI design by sketching # output Op. sys- Recog- Levels of fidevices tem nition delity
Denim [22]
1
1
1
Designers’ Outpost [18] SketchiXML [6]
Many
1
1
1
1
1
TeamStorm [13]
Many
Many
Calico [20]
Many
DEMAIS [1]
Multiplatform
Collaborative Design Submit a Share Design history sketch sketches
Deployment cost
Many (Java) 1
No
1 (low)
Web sites
Low
No
1 (low)
Web sites
High
Yes
Low
No
3 (low, medium, high) No
Yes
1
Many (Java) 1
No
Medium
1
1
1
Low
No
No
Medium
Many
1
1
1
No
1 (low)
No
Low
Cross-device workspace [11] Discussion room [9] Caretta [27]
Many
Many
1
1
No
1 (low)
Yes
Medium
Many
Many
Many
1
No
1 (low)
No
Medium
Many
2
2
1
No
1 (low)
No
Medium
WebSurface [30]
Many
Many
1
1
No
1 (low)
No
Medium
MemTable [16]
Many
1
1
1
No
1 (low)
No
Medium
Gambit
Many
Many
Many
Many
Yes
3 (low, medium, high)
Yes
Low
Table 1: Comparison table for work related to Gambit.
379
DIS 2012 • In the Wild
June 11–15, 2012 • Newcastle, UK
which designers usually explore different alternatives but in UI modeling as a final product, where designers must attend to formal standards and notations. There are many tools available for both modeling and design, however practitioners are currently forced to choose formal and flexible tools. Whichever they choose, they lose the advantages of the other, with attendant loss of productivity and sometimes of traceability and quality.
MOTIVATIONS AND DESIGN CHALLENGES General Motivations
Sketching is largely recognized as an inexpensive way of producing low-fidelity prototypes, which helps to frame design problems, therefore producing better design. However, before start to discuss sketching in UI design, the main subject of the research presented on this paper, some definitions of classical sketching and UI design need to be done.
A great care must be taken to support the designer’s reflection when making design software that employs sketch recognition [17]. If the system interprets drawings too aggressively or at the wrong time, it may prevent the human designer from seeing alternative meanings; recognize too little and the software is no better than paper.
Firstly, we refer to sketch as described in [17]: quickly made depictions that facilitate visual thinking, which may include everything from abstract doodles to roughly drawn interface. The aforementioned work restricts neither the drawing medium nor the subject matter.
Designers desire an intelligent whiteboard because it would not require hard mental operations while sketching during meetings or design sessions [5]. Calico [20] is a good example of “vanishing tool” once it keeps itself out of the way between the developers and the models, and this can be useful especially during early design stages. However, it is not obvious to explain why software designers resist adopting them, despite of the ubiquity and low cost of penbased and touch devices [5].
Secondly, our work is related to both interaction and interface designs. Interaction design is the discipline "related to design interactive products to support people in their everyday and working lives" [26]. Interfaces of interactive systems are one example of such product. Sketching in Design
When designing, people draw things in different ways, which allows them to also perceive the problem in new ways. Designers engage in a sort of “conversation” with their sketches in a tight cycle of drawing, understanding, and interpreting [23]. As the findings of [12] point out, the presence of ambiguity in early stages of design broads the spectrum of solutions that are considered and tends to deliver a design of higher quality. Van der Lugt [31] conducted an experiment to analyze the functions of sketching in design, in which participants produced individual sketches and then presented them for the group for discussion. Three primary sketching functions were identified:
Design Goals for Collaborative Sketching
We would define Collaborative Sketching (CS) as a mix of Collaborative Design and Design by Sketching. Although CS is already defined and supported by [10, 2, 8, 13, 14], our goal is to define a specific domain of CS for User Interface design. We have observed design sessions conducted in two companies related to user interface development. The people involved on those sessions were designers, project managers, programmers and frequently stakeholders. In overall, in these companies the design sessions are usually done around a central topic, about which people discuss in order to produce some artifact, usually a report with a list of requirements, wireframes and some session log of the decisions made around the interaction.
F1: Sketching Stimulates a re-interpretive cycle in the individual designer’s idea generation process: Schön and Wiggins [23] describe design as a cyclic process of sketching, interpreting and taking the sketches further. F2: Sketching Stimulates the designers to re-interpret each other’s ideas: when sketching to also discuss (as opposed to sketch for self-interpretation), the designer invites others to interpret her drawings as well. The function of inviting re-interpretation is especially relevant for the idea generation process, as re-interpretation leads to novel directions for generating ideas [31].
It is important to note that this report is not produced on site but after the meeting, for what people usually take pictures for remembering and registering what was discussed. Nevertheless, the design sessions most often proceeded with three distinct phases: 1. Mental model construction and concepts: the mediator leads the task, asking the participants the essential elements of the tasks. 2. Scenario construction: the participants are usually divided into groups to focus on one scenario each. They usually do it using a big sheet of paper and use post-its. After each group agrees on its own scenario, the sheets are arranged as a storyboard on a wall for discussion. 3. Interface prototyping: the participants’ sketches the user interface based on what was discussed and learned on the scenarios discussion.
F3: Sketching Stimulates the use of earlier ideas by enhancing their accessibility: Since it is externalized, sketching also facilitate archiving and retrieval of design information. Sketching in User Interface Design
In order to support sketching into UI design, we need to analyze the process in which UI design is included. Currently, the development life cycle of interactive applications consists of a sophisticated process that does not always proceed linearly in a predefined way. The tools available for UI development are usually not focused on UI design, in
380
DIS 2012 • In the Wild
June 11–15, 2012 • Newcastle, UK
Figure 1: Physical setup of Gambit.
During the interviews, designers frequently reported an interesting fact that happens on some design sessions, relative to some participants quite often being uncomfortable on sketching in front of the rest of the group. According to them, the participants are mostly end-users who do not feel very capable of any graphic production in front of designers. For those participants, the designer usually gives a private sheet of paper, to be placed on the wall after the user feels his/her design is good enough for discussion.
the middle. The many input devices (1 and 2 in the figure) can be tablets, mobile devices, large graphical tablets, etc. The input devices are used by designers to sketch and submit drawings to the device representing the wall (W) showing the sketches as if they are real sheets of papers organized onto a real wall. The wall is projected using a common projector (P) and can be controlled using a tablet, called ‘control tablet’ (C). The roles of the devices are interchangeable – a user might request the wall’s control at any time, organizing and grouping the sketches.
One of the designers also mentioned that is sometimes difficult to envision a design for a specific platform without seeing how it would look like on it. According to that designer, a lot of redesign could be avoided simply by drawing the interface on the very device it is indented to run, for they use sheets of paper of the device’s size to simulate how the design would look in the ‘real world’. Requirements
Based on the study presented by [31] and on the observation of the design session, preliminary list of requirements for a system to support collaborative sketching was constructed as follows: • R1 - Support sketch production and visualization on different devices • R2 - Support session storage and retrieval • R3 - Support private/public production of sketches • R4 - Provide a broad view of the drawings (like papers arranged on a wall) • R5 - Provide a fine view of a drawing • R6 - Support the UI design with different level of fidelities
Figure 2. Gambit interface for sketch production
Figure 1 (right) shows a picture taken during a preliminary study with designers (not to be described on this paper): three subjects operating different devices each around a projector in the middle. In the right part the wall shows the sketches being organized by the participant with the control tablet. Since Gambit is a web-based system operating through a browser, the wall (W) can be a full-screen
GAMBIT SOFTWARE ARCHITECTURE
Based on the requirements, the system was designed to be physically deployed around a table, with tablets and a projector. The system is currently developed as depicted on Figure 1 (left) shows the deploy scheme of the system, with designers using different devices each around a projector in
381
DIS 2012 • In the Wild
June 11–15, 2012 • Newcastle, UK
Gambit server. The server is responsible for managing the users, their collaborative activities and their sketches. Also, it relies on a sketch recognition API that is originally part of Eclipse Sketch project (http://www.eclipse.org/sketch) – an eclipse project created to add sketching capabilities to meta model editors built with Eclipse.
browser window opened on a desktop computer, a projection or a large interactive display. The system was developed in HTML5 in order to centralize the code for different platforms. In this sense, the system can run on any device with a browser. Figure 2 shows the sketching interface of the system, with a drawing area that uses HTML5’s element and Javascript routines to capture the mouse/pen/touch events. At the current state, the system not yet allows different brush sizes or colors.
Eclipse Sketch Applications. The sketches can be also used on any native desktop application constructed with Eclipse, such as graphical editors for meta-models. Sketch API. This component processes the sketch separately from the rest of the system, in a way referred in the literature as 'lazy or postponed recognition', which means that the sketches are not actively recognized and replaced by high-fidelity versions of what the algorithm interpreted the sketch to be. This is important in order to maintain the original look of the sketch, not stopping the designer's creativity flow and 'conversation' with the sketch [17] [23]. The sketches are stored in InkML format (http:// w3.org/TR/InkML/).
The left part shows a toolbar that can be used to switch from sketching to control functionalities. Figure 3 shows the wall being displayed, with the sketches arranged like sheets of paper that can be dragged and grouped. The black background is intentionally put in order to make only the “sheets” to be projected on the wall, so as to mimic the physical storyboard mentioned during the interviews. The wall is the main part of the system, since the design session progresses around it. Figure 3 shows a diagram depicting what happens during a design session.
Figure 4. The logical components of Gambit
Figure 3. Interface for “Wall sharing” on big displays
In the future, the gambit server will be able to receive a UI sketch in low-fidelity and to transform it progressively into medium-fidelity and high-fidelity according to the style of the platform running the system.
Gambit was logically designed as depicted in Figure 4, with many HTML5 clients running on tablets, smartphones and/or desktops, while being managed by a central web server. The various components of this software architecture are further explained in the next sub-sections.
Figure 5 depicts a UI being merely sketched in a lowfidelity (a). This sketch is in turn beautified into mediumfidelity expressed in terms of wireframes (b) and highfidelity rendered (c). A slider enables the designer to ensure a smooth transition between any level of fidelity with a toggle on names of recognized widgets. The current prototype of the system was built in order to perform the experimental study, its current state in regard of the requirements is outlined below:
HTML5 + Javascript clients. The application is essentially a website with sketching capabilities. The clients run the same application frontend trough a browser or a wrapping application that only displays the website (without browser controls). The communication with the server is made through asynchronous requests via Javascript (AJAX). The designers might choose the device that better suit their needs, for instance, a designer might want a light device such as a tablet for a face-to-face meeting with a client in order to start a design, and a large interactive surface for online meetings or solo work.
R1 Support drawing sharing, visualization and consequently discussion - The wall device acts as a sharing repository of sketches, aiding the discussion around a design. It is possible to send sketches to the wall, organize them, put them side-by-side for comparison, etc. R2 Support session storage and retrieval - Sessions storage is not yet supported.
382
DIS 2012 • In the Wild
June 11–15, 2012 • Newcastle, UK
R3 Support private/public production of sketches - Each input device is able to produce live sketches or to produce a sketch separately for later publication on the wall. Sub-group collaboration of two or more participants to produce a sketch is planned, but yet to be supported.
domains of human activity (e.g., management, medicine, distance learning). No participant has any prior knowledge or exposure to the Gambit system. Task and procedure. The experimental study was initiated
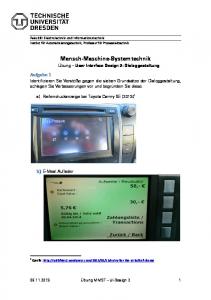
with a demographic questionnaire, also capturing UI design and/or development experience of participants. Then, a 5minute video was projected with general information and instructions about the system and the goals of the experiment. The video ended with a guideline that specified what to do and which platform/devices to use in which room according to a setup summarized in Table 2. In order to explore different design situations (i.e. cooperation and collaboration among stakeholders), the 9 participants were divided into two groups of 6 and 3 participants, one group by room. In the first room (A), the 6 participants were randomly grouped in pairs while in the second room (B) participants were alone. Participants were instructed to sketch a system UI for children to use during car travels, on the backseat. The system is aimed at bringing children face to face and must have two different parts: a game enabling children counting and validating the number of items they see first during the travel (cars with defined colors, trucks, wind turbines, etc.) and a second one for parents to add new items in the game. No other constraint was elicited in order to preserve the creativity process and to foster the discussion among the participants.
Figure 5. A user interface represented at different levels of fidelity: low (a), medium (b), and high (c).
Device Small device (input)
R4 Provide a broad view of the drawings (like papers arranged on a wall) - the wall was designed to serve exactly as a physical wall with 'projected sheets of paper', which are the images and sketches. R5 Provide a fine view of a drawing - the input device can serve as a fine view of any sketch, and they can be redrawn and sent once again to any other device. R6 Support the UI Design with different levels of fidelity For the moment, only low fidelity is supported.
Medium device (input)
-
Details iPhone 3Gs Resolution: 320x480 OS: iOs 4.3.3 iPad 2 Resolution: 1024x768 OS: iOs 4.3.1
Large device (input)
- Tabletop - Resolution: 1600 x 1200 - OS: Mac OS X 10.6.7 Wall screen (output) - Dell server & video projector - Resolution: 1920 x 1200 - OS: Windows 7 Table 2: Overview of the physical setup.
EXPERIMENTAL STUDY
Since Gambit supports multiple platform/devices either as an input or as an output, the most preferred configuration for each design activity by what type of stakeholder was considered worth to be determined through a study. The level of fidelity is not considered here because has already been subject to some experiments [6, 34].
Since the purpose of the study was to let participants experience different devices supported by Gambit, 3 devices with 3 different device sizes (i.e., small, medium and large) were selected in order to collect their feedback regarding comfort and accuracy. Each room was equipped with an input platform/device for each device size (i.e., small, medium and large) and a wall screen as a shared output device. The large device in Figure 6 is original as it combines a very-high resolution and luminosity video projector projecting a screen on a magnetic SmartBoard tabletop synchronized with a pen.
Method and protocol Participants and apparatus. We conducted a user trial of 9
participants (1 female, 8 male) who were recruited from a database of volunteers having different backgrounds (e.g., psychology, management, communication, computer science) and having different ages. All participants were designers, developers, usability experts, human factors experts or graphic artist and are working in development means in public and private organizations (e.g., software vendors, web agencies) developing software in different
The goal was to observe the behavior of the participants thinking and sketching the system UI either individually (in
383
DIS 2012 • In the Wild
June 11–15, 2012 • Newcastle, UK
all satisfaction) were obtained applying the rules specified in [19].
room B) or by pair (in room A), then discussing their results and refining the resulting UIs. For this purpose, the task was split into three iterations, each iteration being composed of two sub-steps:
Justifications. The global experiment has been defined and
conducted according to the ACM Protocol for Empirical Software Engineering (ESEM) [33]. The various platform/devices involved in the experiment were selected as they are considered representative cases of typical devices and platforms used today, but also with respect to a cluster analysis of devices into categories according to screen resolution based on platform data available on different sources (e.g. http://mobiforge.com/designing/story/effectivedesign-multiple-screen-sizes). The case study of the design session, i.e., the car system, was selected because it does not require any special knowledge or previous experience of this kind of system. The various configurations of the experiment have been defined based on the three primary sketching functions: individual sketching, sharing sketches, and reviewing the sketching history, as presented on section 3. The IBM CSUQ questionnaire was used for the subjective satisfaction measure since it has excellent psychometric reliability properties [19] and benefits from a high correlation (r=0.94) between the system usability under evaluation and the answers to the 19 questions.
Figure 6. The physical setup of the rooms.
1. During the first sub-step (about 10 min.), the participants sketched the UI on the assigned input device. They were instructed to submit their sketches to the wall (output device) whenever they wanted, be it to finish the design or to clear the device to a new design. 2. In the second sub-step (about 5-7 min.), each participant of the room stopped sketching for gathering around the wall controlling it with the medium device (control). Participants were free to use it as they wanted to organize the projected images on the wall and discuss them.
Results and discussion
The survey was based on a 9x6x4 factorial design: 9 participants were involved, 6 sub-steps were selected and 4 devices. All the nine participants completed the 24 trials, thus giving a total sampling of 216 trials. No outlier was removed since all tasks have been completed without any problem and interruption.
After each iteration, participants switched to another platform/device according to a random moving-window scheme, in a way they finally were able to manipulate all input platform/devices with all device resolution involved in the experiment. All sessions were videotaped for further analysis.
Figure 7 depicts the aggregated average preference of participants for different platform/devices for input/output for the 3 primary sketching functions [31] (Q1/Q2 for input/output device for drawing a sketch; Q3/Q4 for input/output device for sharing sketches; Q5/Q6 for input/output device for managing the design history; Q7/Q8/Q9 for low/medium/high fidelities for input/output).
The preference for each input/output device was first captured by a set of 9 questions asking each participant to rank each device by decreasing order of preference and by frequency where it matters, while commenting the reasons they chose this order.
�
Satisfaction was measured with respect to the user’s perceptions of system usefulness, information quality, interface quality, and overall satisfaction. Overall satisfaction is an aggregation of the three other perceptions. All these measures were derived from answers to the Computer System Usability Questionnaire (CSUQ) [19], so they are indirect measures. Answers to CSUQ were expressed using a 7point Likert scale in which 1 represents the best perception score (strongly agree) and 7 represents the worst perception score (strongly disagree). Following the indications given by the designers of CSUQ, the 19 numerical answers of the CSUQ were upgraded from the Likert scale to the interval scale. Then, the four perceptions of satisfaction (i.e., system usefulness, information quality, interface quality, and over-
� �
�
�
� ��
�
� �
�
�
�
�
� �
�
Figure 7: The cumulated histogram for device preference.
The first cumulated bar (Q1) reveals that the most preferred platform/devices for sketching are respectively Tabletop,
384
DIS 2012 • In the Wild
June 11–15, 2012 • Newcastle, UK
Wall screen, Tablet, iPad and iPhone, thus suggesting that dimensions and resolutions of the platform/devices matter. The larger the dimensions and resolutions of the devices the better for performing input.
the systems as easy to learn once they get the opportunity to learn how to operate the system (Q7). No particular concern about Q8 (“I believe I became productive quickly using this system). Questions regarding information quality (Q9-Q15) were estimated rather negatively because of lack of guidance and error management of the system: the system does prevent users from making errors, but no immediate feedback is provided when this occurs.
Other alternatives suggested by participants include, by decreasing order in two categories: without software support ‘paper and pencil’, ‘whiteboard based approach’; and with software support ‘screen mockup software’, ‘presentation software’. The main reasons for these choices are: (i) the very first sketches are preferably done on paper, which corroborates observations made by [32]; (ii) presentation software is widely available and largely used for flexibility reasons, which corroborates observations made by [1]; (iii) paper and pencil or whiteboard approaches are quick and cheap to use since they do not require special resources.
Q13 (“The information provided with the system is easy to understand”) and Q14 (“The information is effective in helping me complete my work”) were perceived rather positively, but with some significant neutral part (i.e. significant yellow portion). Q16 (“The interface of this system is pleasant”) reveals that one fourth of the participants were really concerned about the cluttering of the Gambit UI after a certain amount of time. Q17 (“I like using the interface of this system”) confirms this trend in a less contrasted way. The most negative question was Q18 (“This system has all the functions and capabilities I expect it to have”) because people did not discover the functions immediately, did not use functions that were implemented but not tested, but also because they identified some needs that were hard to predict before the experiment (i.e., who is discussing what at what time).
The second cumulated bar (Q2) reveals that the most preferred platform/devices for rendering the sketches fall into two categories, depending on their level of significance: (i) Wall Screen, Tabletop and iPad; (ii) Tablet and iPhone. The main reason for these categories is again the dimensions and resolutions of devices, that should be large enough to accommodate viewing by everyone in the design session. The reasoning for questions Q3 to Q6 can be done by analogy to the aforementioned reasons.
I strongly disagree
The seventh cumulated bar (Q7) reveals that the tabletop is the most preferred input device for low fidelity, probably most preferred than in any other questions. Beyond the aforementioned reasons, two additional reasons matter: the flexibility and the precision the sketches can be made on large devices.
I disagree
I am so so
I agree
I strongly agree
Q19
Q18 Q17 Q16
Q15
The eight cumulated bar (Q8), respectively the ninth cumulated bar (Q9), reveals the devices for medium fidelity, respectively for high fidelity. The Wall screen, Tabletop are considered significant for both medium and high fidelity, but in a reverse order. Other devices are considered not significant.
Q14 Q13 Q12 Q11 Q10
The cumulated histogram in Figure 8 summarizes the responses to the 19 questions included in the IBM CSUQ questionnaire. The distribution for question Q1 (“Overall, I am satisfied with how easy it is to use this system”) revealed that nobody had any negative feeling about the satisfaction to use the Gambit-supported configurations (neither orange nor red areas). The observation remains the same for the three following questions Q2 (“It is simple to use this system”), Q3 (“I can effectively complete my work using this system”), and Q4 (“. I am able to complete my work quickly using this system”). But some participants were concerned about the efficiency as expressed in Q5 (“I am able to efficiently complete my work using this system”) because they were not immediately able to locate how to operate the Gambit functions.
Q9 Q8 Q7 Q6 Q5 Q4 Q3 Q2 Q1 1
2
3
4
5
6
7
8
9
Figure 8. Distribution of participants’ responses.
A percentile analysis of the answers provided to this questionnaire by the participants also reveals that the 75%percentile (x75%) is in favor of the Gambit system for most of the questions and that the 50%-percentile (x50%) is in favor of the system for questions with concerns.
Once demonstrated and learned, they felt comfortable using the system (Q6) and were able to operate the functions properly (Q7). All participants were unanimous in reporting
385
DIS 2012 • In the Wild
June 11–15, 2012 • Newcastle, UK
fidelity, multiple ways on introducing a sketch (from paper, from a general-purpose drawing application, from a dedicated sketching software) multiple computing platforms, thus supporting multiple configurations in a flexible way.
"��� !��� ��� ����
Among the configurations potentially supported by Gambit, an experimental study identified the most preferred ones by various stakeholders for three primary sketching functions: sketching individual designs, sharing sketches among stakeholders, and reviewing design history.
����
���
����
����
����
����
This study also enabled us to assess the portfolio of Gambit features: some features were implemented and tested, some other features were implemented (e.g., rotating a sketch, rescaling a sketch, bring a sketch to front, send a sketch to back, stack sketches into a deck) but not tested to keep the experiment controllable, and some new features not yet implemented in Gambit (e.g., designate a sketch being discussed on a shared output platform/device, arrange sketches in a particular way so as to reflect that they are alternative design of the same UIs, but with different hypotheses, stack sketches over a period of time).
���� � � �
��� ���
�� �� ���
������
Figure 9: The IBM CSUQ results.
Figure 9 depicts the results obtained from the IBM CSUQ: The system usefulness (SysUse: µ=5.28, σ=1.13, median=5.0) has been highly appreciated, thus demonstrating that Gambit provides the capabilities required for adequately conducting UI design sessions by sketching, which is also supported by the positive trends of Q1-Q8. The information quality (InfoQual: µ=3.87, σ=1.26, median= 4.0) has not been however appreciated mainly for the following reasons (extracted from the questionnaires): participants were glad to be able to sketch individual design, to share them, to control them, etc., but clearly lacked information on who, when, and on which platform/device each sketch was operated.
Future work is aimed at addressing these different needs as well as the following questions in mind: so far, only collaboration and cooperation situations have been investigated, but other situations might be interesting to consider such as competition (many stakeholders are in competition with different sketches for the same design, thus posing the need to record the pros and contras for each candidate) or coopetition (many stakeholders compete with different sketches for the same design but could cooperate for some portion of the design process, as opposed to no cooperation in pure competition).
For instance, some participants were discussing some sketches but wanted to highlight a particular sketch, whether it is individual or shared, during discussion time, and to link them.
ACKNOWLEDGEMENTS
The interface quality (InterQual: µ=4.0, σ=1.26, median= 4.0) suggests that the Gambit user interface itself is considered acceptable (since above 4), but still requires some improvements in the information that is lacking and some other basic operations that are related more to the management of sketches among devices than on the distribution of sketches among these devices. For instance, some participants want to have layout facilities for grouping/ungrouping sketches in packages for different parts of the UI being designed. The overall satisfaction (Overall: µ=4.56, σ=1.13, median= 5.0) suggests that the Gambit system is positively perceived in overall, but that there are missing features that are desired.�
The authors would like to acknowledge the support of the ITEA2-Call3-2008026 UsiXML (User Interface extensible Markup Language) European project and its support by Région Wallonne, Direction générale opérationnelle de l'Economie, de l'Emploi et de la Recherche (DGO6). Also, the authors would like to thank Pascal Beaujeant and Sophie Dupuis for their help throughout the experimental study and revisions. REFERENCES 1. Bailey, B.P. and Konstan, J.A. Are informal tools better?: comparing DEMAIS, pencil and paper, and AuthorWare for early multimedia design. In Proc. of CHI’2003 Conf. on Human Factors in Computing Systems. ACM Press, New York, 2003, pp. 313–320. 2. Bastéa-Forte, M. and Yen, C. Encouraging contribution to shared sketches in brainstorming meetings. CHI 07 extended abstracts on Human factors in computing systems, 2007. 3. Bergweiler, S., Deru, M., and Porta, D. Integrating a multitouch kiosk system with mobile devices and multimodal interaction. In Proc. of ITS’2010 Conf. on Interactive Tabletops and Surfaces. ACM Press, New York, 2010, pp. 245–246. 4. Branham, S., Golovchinsky, G., Carter, S., and Biehl, J. Letʼs go from the whiteboard: supporting transitions in work through whiteboard capture and reuse. In Proc. of CHI’2010 Conf. on Human Factors in Computing Systems. ACM Press,
CONCLUSION
In this paper, we introduced, motivated, developed, and tested Gambit, a distributed system across multiple input/output platform/devices. The system is aimed at constructing prototypes and will evolve to be used at design sessions in companies with a low cost of deployment. Gambit is original with respect to the state of the art in that it supports user interface design by combining the following pre-eminent features: multiple stakeholders, multiple input devices, multiple output devices, multiple levels of
386
DIS 2012 • In the Wild
June 11–15, 2012 • Newcastle, UK for collaborative web site. In Proc. of UIST’2001 ACM Symposium on User interface software and technology. ACM Press, New York, 2001, p. 1–10. 19. Lewis, J.R. IBM computer usability satisfaction questionnaires: psychometric evaluation and instructions for use. Int. Journal of Human-Computer Interaction, 7, 1 (1995) 57–78. 20. Mangano, N., Baker, A., Dempsey, M. , Navarro, E. and van der Hoek, A. Software design sketching with Calico. In Proc. of ASE’2010 IEEE/ACM Int. Conf. on Automated Software Engineering. ACM Press, New York, 2010, pp. 23–32. 21. Myers, B., Park, S.Y., Nakano, Y., Mueller, G. and Ko, A. How designers design and program interactive behaviors. In Proc. of VL/HCC’2008 IEEE Symposium on Visual Languages and Human-Centric Computing. IEEE, pp. 177–184. 22. Newman, M.W., Lin, J., Hong, J.I. and Landay, J.A. DENIM: An informal web site design tool inspired by observations of practice. Human-Comp. Interaction 18, 2003, pp. 259–324. 23. Schon, D.A. and Wiggins, G. Kinds of seeing and their functions in designing. Design Studies 13, 1992, pp. 135–156. 24. Scott, S.D., Grant, K.D., and Mandryk, R.L. System guidelines for co-located, collaborative work on a tabletop display. In Proc. of ECSCW’2003 8th European Conf. on Computer Supported Cooperative Work. Kluwer Academic Publishers, Dordrecht, 2003, p. 159–178. 25. Scott, S.D. and Carpendale, S. Interacting with digital tabletops. IEEE Comp. Graphics and App. 26, 2006, pp. 24–27. 26. Sharp, H. Rogers, Y., and Preece, J.J. Interaction Design: Beyond HCI. John Wiley and Sons, New York, 2007. 27. Sugimoto, M. , Hosoi, K., and Hashizume, H. Caretta: a system for supporting face-to-face collaboration by integrating personal and shared spaces. In Proc. of CHI’2004 ACM Conf. on Human factors in computing systems. ACM, pp. 41–48. 28. Sumner, T., Bonnardel, N., and Harstad-Kallak, B. The cognitive ergonomics of knowledge-based design support systems. In Proc. of CHI’97 ACM Conf. on Human Factors in Computing Systems. ACM Press, New York, 1997, pp. 83–90. 29. Terry, M. and Mynatt, E.D. Recognizing creative needs in user interface design. In Proc. of C&C’2002 ACM Conf. on Creativity & cognition. ACM Press, NY, 2002, pp. 38-44. 30. Tuddenham, P., Davies, I. and Robinson, P. WebSurface: an interface for co-located collaborative information gathering. In Proc. of ITS’2009 ACM Int. Conf. on Interactive Tabletops and Surfaces. ACM Press, New York, 2009, pp. 181–188. 31. van der Lugt, R. Functions of sketching in design idea generation meetings. In Proc. of C&C’2002 ACM Conf. on Creativity & cognition. ACM Press, NY, 2002, pp. 72-79. 32. Walker, M., Takayama, L., and Landay, J. High-fidelity or low-fidelity, paper or computer medium? In Proc. of HFES’2002 46th Annual Meeting of the Human Factors and Ergonomics Society. Human Factors and Ergonomics Society, Santa Monica, 2002, pp. 661–665. 33. Wohlin, C., Runeson, P., Host, M., Ohlsson, M. C., Regnell, B. and Wesslén, A. Experimentation in Software Engineering: An Introduction. International Series in Software Engineering, Vol. 6. Springer, Berlin, 2000. 34. Yeung, L., Plimmer, B., Lobb, B., and Elliffe, D. Effect of fidelity in diagram presentation. In Proc. of BCS-HCI’2008 British HCI Group Annual Conference on People and Computers: Culture, Creativity, Interaction, Volume 1. Cambridge University Press, Cambridge, 2008, pp. 35–44
New York, 2010, pp. 75–84. 5. Cherubini, M., Venolia, G., DeLine, R., and Ko, A.J. Letʼs Go to the Whiteboard: How and Why Software Developers Use Drawings. In Proc. of CHI’2007 Conf. on Human Factors in Computing Systems. ACM Press, New York, 2007, pp. 557– 566. 6. Coyette, A., Kieffer, S., and Vanderdonckt, J. Multi-fidelity Prototyping of User Interfaces. In Proc. of Interact’2007 IFIP TC 13 Int. Conf. on Human-Computer Interaction (Rio de Janeiro, September 10-14, 2007). Lecture Notes in Computer Science, Vol. 4662, Springer, Berlin, 2007, pp. 150–164. 7. Craft, B. and Cairns, P. Sketching sketching: outlines of a collaborative design method. In Proc. of the HCI’2009 23rd British HCI Group Annual Conference on People and Computers: Celebrating People and Technology. British Computer Society, Cambridge, 2009, pp. 65–72. 8. David, J., Eoff, B., and Hammond, T. CoSke-An Exploration in Collaborative Sketching. CSCW 2010, (2010), 471-472. 9. Fleck, R., Rogers, Y., Yuill, N., Marshall, P., Carr, A., Rick, J., and Bonnett, V. Actions speak loudly with words: Unpacking collaboration around the table. In Proc. of ITS’2009 ACM Int. Conf. on Interactive Tabletops and Surfaces. ACM Press, New York, 2009, pp. 189–196. 10. Geyer, F., Jetter, H.C., Pfeil, U. and Reiterer, H. Collaborative sketching with distributed displays and multimodal interfaces. In Proc. of ITS’2010 ACM Int. Conf. on Interactive Tabletops and Surfaces. ACM Press, New York, 2010, pp. 259–260. 11. Geyer, F. and Reiterer, H. A cross-device spatial workspace supporting artifact-mediated collaboration in interaction design. In Proc. of CHI EA’2010 Extended Abstracts on Human factors in computing systems. ACM Press, New York, 2010, pp. 3787-3792. 12. Goel, V. Sketches of Thought. MIT Press, Cambridge, MA, 1995. 13. Hailpern, J., Hinterbichler, E., Leppert, C., Cook, D., and Bailey, B.P. TEAM STORM: demonstrating an interaction model for working with multiple ideas during creative group work. In Proc. of C&C’2007 6th ACM Conf. on Creativity & Cognition. ACM Press, New York, 2007, pp. 193–202. 14. Haller, M., Leitner, J., Seifried, T., Wallace, J.R., Scott, S.D. Richter, C., Brandl, P., Gokcezade, A. and Hunter, S. The nice discussion room: Integrating paper and digital media to support co-located group meetings. In Proc. of CHI’2010 ACM Conf. on Human factors in computing systems. ACM Press, New York, 2010, pp. 609–618. 15. Hartmann, B., Yu, L., Allison, A., Yang, Y., and Klemmer, S.R. Design as exploration: creating interface alternatives through parallel authoring and runtime tuning. In Proc. of UIST’2008 ACM Symposium on User Interface Software and Technology. ACM Press, New York, 2008, p. 91–100. 16. Hunter, S., Maes, P., Scott, S., and Kaufman, H. MemTable: an integrated system for capture and recall of shared histories in group workspaces. In Proc. of CHI’2011 ACM Conf. on Human factors in computing systems. ACM Press, New York, 2011, pp. 3305–3314. 17. Johnson, G., Gross, M.D., Hong, J., and Yi-Luen Do, E. Computational Support for Sketching in Design: A Review. Foundations and Trends in Human-Computer Interaction 2, 2008, pp. 1–93. 18. Klemmer, S.R., Newman, M.W., Farrell, R., Bilezikjian, M. and Landay, J.A. The designersʼ outpost: a tangible interface
387