Jun 23, 2010 - A Complexity Analysis of Widget Representations. Suzanne Kieffer ... User interface design by sketching, as well as other sketch- ing activities ...
User Interface Design by Sketching: A Complexity Analysis of Widget Representations Suzanne Kieffer, Adrien Coyette, Jean Vanderdonckt Université catholique de Louvain, B-1348 Louvain-la-Neuve (Belgium) {suzanne.kieffer, adrien.coyette, jean.vanderdonckt}@uclouvain.be ABSTRACT
thus diminishing the virtue of naturalness. Recognition engines thus face a dilemma when defining the representation of objects to be recognized: either the representations are close to the real world but hard to recognize or they are simplified to be recognized, but not meaningful for the user.
User interface design by sketching, as well as other sketching activities, typically involves sketching objects through representations that should combine meaningfulness for the end users and easiness for the recognition engines. To investigate this relationship, a multi-platform user interface design tool has been developed that enables designers to sketch design ideas in multiple levels of fidelity with multistroke gestures supporting widget representations and commands. A usability analysis of these activities, as they are submitted to a recognition engine, suggests that the level of fidelity, the amount of constraints imposed on the representations, and the visual difference of representations positively impact the sketching activity as a whole. Implications for further sketch representations in user interface design and beyond are provided based on usability guidelines.
More specifically, UI design by sketching has already demonstrated several advantages: UI sketching is preferred over traditional interface builders, especially by end users [9,18] and could be performed at different levels of fidelity without loosing advantages [20,25]: the amount of usability problems discovered with a sketched design is not inferior to those corresponding to a genuine UI [24], the expressive power of a sketched UI remains the same [25], a sketched UI provides quantitative and qualitative results that are comparable to traditional UI prototypes except that the cost is reduced [21], UI sketching encourages exploratory design and fosters communication between stakeholders more than any other prototypes [23], flexibility is superior to UI builders [25], authoring tools [2], and paper prototypes [25].
Author Keywords
Level of fidelity, shape recognition, sketching, user interface design, user interface prototyping. General Terms
There are a number of problems with traditional sketching methods of UI design that make these methods challenging for novice users and inefficient for expert users. The first problem is related to the meaningfulness of representations: what is the best object representation? Should multiple representations of the same object be offered? How should it be sketched? Should it be sketched in one stroke or several strokes? If a representation is not meaningful enough for an end user, the representation will be forgotten or badly drawn. The second problem is that the result of the chosen representation is often far from what is expected by the novice user and difficult to reproduce [15]. The third problem with traditional recognition engines is that the representations should be different enough [13] and sketched precisely enough to be efficiently recognized [1,3,11].
Design, Human Factors, Languages. ACM Classification Keywords
D.2.2 [Software Engineering]: Design Tools and Techniques – User interfaces. H.5.2 [Information Interfaces and Presentation]: User Interfaces – Graphical user interfaces. I.3.6 [Computer Graphics]: Methodology and Techniques – Interaction techniques. INTRODUCTION
Sketching is universally recognized for its natural [9], unconstrained [25], and informal [6] virtues in multiple areas of human activity, such as graphic design [1], layout design [11], visualization [26], and user interface (UI) design [7,19,22]. As long as the sketching is not submitted to a recognition engine, the end user does not perceive any shortcoming apart from little or no reusability of the sketches for future steps in the design process. When it comes to recognize what the end user has sketched, e.g. for beautification [1] or interpretation [3,8], the end user may feel again constrained as she knows that every gesture should be performed correctly to be properly recognized,
To address these problems, we developed a UI sketching tool that provides original functionalities with respect to state-of-the-art software, as described in the following section. These functionalities are detailed in the next section. The Representation Experiment section reports on the results obtained from a first experiment to identify the representations preferred by designers and end users. The Complexity Experiment section describes the experiment used to test how these representations are sketched in the UI sketching tool, includes results and discussion. A summary of the main contributions of this paper and a description of the planned follow-up work conclude the paper.
Permission to make digital or hard copies of all or part of this work for personal or classroom use is granted without fee provided that copies are not made or distributed for profit or commercial advantage and that copies bear this notice and the full citation on the first page. To copy otherwise, or republish, to post on servers or to redistribute to lists, requires prior specific permission and/or a fee. EICS’10, June 19–23, 2010, Berlin, Germany. Copyright 2010 ACM 978-1-4503-0083-4/10/06...$10.00.
57
RELATED WORK
combining advantages of computer-based design [25]. At any time, the designer may ask the tool to recognize the UI being sketched and generate a running UI from these sketches. At any time, it also offers the following facilities that are detailed in the following sub-sections:
During the UI development life cycle, the design step is often characterized as a process that is intrinsically open (new designs may appear at any time that require further exploration), iterative (several cycles are performed to reach a solution), and incomplete (not all information is available at design time) [10,12]. The area of UI design by sketching has been extensively researched to identify appropriate techniques such as paper sketching, prototypes, mock-ups, diagrams [6,9,11,13,16]. Several software for UI design by sketching emerged from this research: DENIM [11], DEMAIS [2], EtchaPad [15], FreeForms [18], InkKit [5], JavaSketchIt [3], Satin [7], Silk [9,10], SketchiXML [4], and SketchRead [1], to name the most representative ones.
Object recognition. An object recognition engine recognizes
and interprets 32 different types of widgets (ranging from check boxes and spin button to search buttons, progress bar, calendar, and video input), 8 basic predefined shapes (i.e., triangle, rectangle, cross, line, wavy line, arrow, ellipse, and circle), and 6 basic commands (i.e., undo, redo, copy, paste, cut, new window). This amount of recognized objects is superior to what can be found in other software equipped with a recognition engine in the same domain [3,4,9,19,18].
Since the needs of rapid UI prototyping vary depending on the project and allocated resources, it makes sense to rely on the level of fidelity. The level of fidelity expresses the similarity between the final UI and the prototyped UI. The UI prototype fidelity is said to be high if the prototype representation is the closest possible to the final UI, or almost in the same representation. This means that the prototype should be of high-fidelity in terms of presentation (what layout, what are the UI elements used), of global navigation and dialog (how to navigate between information spaces), of local navigation (how to navigate within an information space). More precisely, McCurdy et al. [14] identified five independent dimensions along which the level of fidelity could be more rigorously defined: the level of visual refinement, the breadth of functionality, the depth of functionality, the richness of interactivity, and the richness of the data model. In the remainder of this paper, the four first dimensions will be considered, the last one requiring a connection to a data model containing data samples.
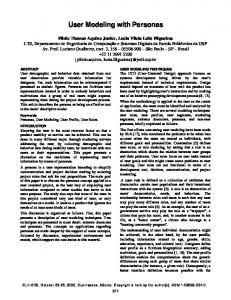
Each object is rigorously defined in terms of constituent shapes (any of the 8 aforementioned basic shapes) and constraints between them. Each constraint should belong to the set of the 31 constraints supported today: areParallel, cross, hasInside, hasInsideInLowerRightCorner, hasInsideInTheCenter, hasInsideInTop, hasInsideInUpperRightCorner, hasInsideOnTheLeft, hasInsideOnTheRight, hasPositiveSlope, intersect, isCrossedBy, isHorizontal, isInside, isInsideInBottom, isInsideInLowerRightCorner, isInsideInTheCenter, isInsideInTop, isInsideInUpperRightCorner, isInsideOnTheLeft, isInsideOnTheRight, isOnTheLeftOf, isOnTheRightOf, isOnUpperLeftCorner, isSmall, isSquare, isThin, isUnder, isVertical. Any object representation is expressed in a XML format stored in a graphical grammar [1,3] that is parsed and interpreted at run-time [8]. In this way, any custom object could be easily added by adding a new representation in the grammar. Each UI element can be sketched and recognized or not depending on its shape and the wish for the user to see it recognized or not. The object recognition is only on-demand. Those shapes which are not recognized are simply added and maintained throughout the process. Fig. 1 shows a UI design session where some UI objects have been sketched in Lo-Fi mode. In this mode, objects that are correctly recognized are beautified and the name is added. If an object is not recognized, it is simply maintained as it is, but could be annotated for further handling in the future.
Similarly to the above definition, the level of fidelity is said to be low if the prototype representation only partially evokes the final UI without representing it in full details. Between high-fidelity (Hi-Fi) and low-fidelity (Lo-Fi) [20] exists medium-fidelity (Me-Fi) [4]. We usually observe that a UI prototype only involves one representation type, i.e. one fidelity level. But due to the variety of stakeholders’ input, several levels of fidelities could be combined together, thus leading to the concept of mixed-fidelity, where several different fidelities are mixed in the same UI design [14]. Beyond mixedfidelity, multi-fidelity [4] is reached when a prototype simultaneously involves objects belonging to different levels of fidelity, but only one level of fidelity is acted upon at a time, thus assuming that a transition is always possible for an object from one level of fidelity to another. THE SKETCHING TOOL USED IN THE EXPERIMENTS
In this section, we describe the UI sketching tool that will be the subject of the two next experiments by showing how it is different from state-of-the-art software. This sketching tool today consists of about 112,000 lines of Java 1.5 code and can be freely downloaded from www.anonymous.org, both the executable software and its full source code. This tool enables UI designers to sketch a UI as easily as on paper, while
Figure 1. A typical UI design session with sketched objects.
58
Multiple object representations. Existing software incor-
Fidelity transition. A slider allows the designer to easily
porating an object recognition engine typically support only one single representation per object, most frequently through a mono-directional single-stroke gesture [3,15,18]. Our tool accommodates several representations for a single object, without affecting significantly the system response time. Fig. 2 reproduces an excerpt of the radio button representation. In addition, thanks to this logical definition, each representation could be sketched in a multi-stroke manner that is independent of the direction. In this way, left-handed or right-handed persons are equally supported.
switch between the four levels of fidelity (Fig. 3). Fig. 2-3 shows the representation after the designer moved from LoFi to Lo-Fi, a mode in which only a rough, yet identifiable, object representation is produced that is often referred to as a wireframe representation. This representation is platform agnostic: it does not produce any representation that would suggest any particular window manager or UI builder. If the designer wants to obtain a Hi-Fi representation, then the slider may be switched to the last position (Fig. 2-4): Hi-Fi mode without the labels indicating the object types is displayed. In this case, the representation is made up of genuine widgets belonging to the widget set of the currently being used platform, here a Java platform. Different widget sets and look & feel could be used alternatively that mimic a Hi-Fi representation in other window managers and operating systems like Linux, Open Look, and MacOS X. If a UI element has not been recognized, it is simply kept as it is. For instance, if a histogram would have been sketched, it would not be altered so as to respect the naturalness of the design process as recommended in [14,16].
- - …
Figure 2. A representation for the radio button. Multi-fidelity representation. Thanks to the object recogni-
tion process, the designer can input any UI object in any level of fidelity and see the result in any other level as the interpretation is immediate. In the same way, any custom object could be drawn in Lo-Fi and a predefined widget could be added in Me-Fi or Hi-Fi. Therefore, four fidelity levels are supported as recommended by [14]: none (only the drawing is displayed), Lo-Fi (the drawing is displayed with recognized portions), Me-Fi (the drawing is beautified where portions are recognized, including for basic shapes), and Hi-Fi (a genuine UI is produced with widgets for those recognized portions). Fig. 3 exemplifies multi-fidelity representations for a subset of the 27 widgets supported. To our knowledge, no existing software today supports so many widgets in different levels of fidelity as we have here.
Figure 3. Slide to switch between levels of fidelity. Gesture recognition. Sketching tool users sometimes complained that they are forced to learn a graphical representation [11,12] for every widget, shape or command. In order to support this user flexibility, each such object could of course give rise to a new representation in the graphical grammar. Some user studies revealed the need for the user to interactively define her own representations [6,11]. For this purpose, a gesture recognition system has been implemented based on hand gesture decomposition in order to customize the representation of all widgets, shapes, and commands according to each user’s preferences (Fig. 4). One or several occurrences of a new gesture could be graphical defined that will then serve as a redundant input technique for every widget, shape, or command.
Figure 4. A graphical editor for a new object representation (a) and a gesture recognition system (b) where new gestures replace predefined objects (here, a gesture is drawn, added, and activated to represent a toggle button in a custom way).
Figure 3. A set of widgets with the representations corresponding to the four levels of fidelities (i.e., none, low, medium, and high).
59
Methodology
Multiple output formats. At any time, the tool produces UI
A two phase analysis was carried out on both groups. The scope of the first part was to determine how members of each group would intuitively and freely sketch the widgets to be handled by the tool. From a cross-platform comparison of widgets, a widget catalogue was identified comprising the following 32 widgets: text, text field, text area, push button, search field, login, logout, reset form, validate, radio button, check box, combo box, image, multimedia area, layer, group box, table, separator, frame, hyperlink, anchor, list box, tabbed dialog box, menu, color picker, file picker, date picker, hour picker, toggle button, slider, progress bar, and spin button. Each widget was documented with its unique name, a screen shot and a small textual description (Table 1). Subjects were asked if they had ever seen each widget before and to provide a sketching representation.
specifications in terms of a User Interface Description Language (UIDL) instead of UI code, which is the prevalent approach of most tools [3,9,11,18], but not all [5]. As opposed to many tools where little or no portions of the sketch could be reused, our tool always maintains up-to-date UI specifications, including the description of custom objects. It is also possible to define the navigation between these objects in the same way to address the second and third dimensions of McCurdy [14] (Fig. 5) as in [2,11].
Widget
Figure 5. Definition of the navigation between UI objects. Multi-platform UIs. By specifying project properties, the sketching tool enables designers to sketch UIs for a particular computing platform at a time or for several platforms in a coordinated way. It exports UI specifications in UIML (www.uiml.org), which is able to automatically generate code for HTML, Java, VoiceXML, and WML. As opposed to some tools which are dedicated to a particular environment (e.g., Visual Basic in FreeForms [18], Java in JavaSketchIt [3]), this tool is shipped with predefined profiles covering a wide range of different computing platforms. Each profile not only expresses constraints imposed by a particular platform (e.g., the screen resolution, a restricted widget set), but could also have a particular gesture data base for sketching those UI elements which are peculiar to this platform (e.g., a gesture associated to a histogram).
Graphical presentation
Textual description
Search Field
This widget is composed of a text field and a button. It allows the users to submit a search.
Tabbed Dialog Box
This widget allows the user to switch from one pane to another thanks to the tab.
Table 1. Some objects submitted to the participants.
Then, from the widget representations provided during the first phase, we tried in a second phase, to extract the most common object representations. We grouped all these representations in categories with strong similarities as in [13]. Participants were then asked to rank the different representations according to their representativeness and preferences as a five-point Likert scale. On basis of these results we defined all the representations to be handled by the sketching tool. For instance, table 2 illustrates some representations. Represen- Represen- Representation tation tation 1 2 3
Representation 4
Representation 5
THE REPRESENTATION EXPERIMENT
The first experiment presented in this paper investigates which representation is mostly preferred and drawn depending on the user type (designer vs. end user).
Table 2. List box representations submitted to the participants for the second part of the survey.
Participants
Two groups of 30 subjects were randomly selected from a list of volunteer candidates: the first group was composed of people with relevant experience in computer science and UI design, while the second was composed of end users without any prior knowledge in UI design or computer science. The second group was also considered because the tool goal is to involve as much as possible the end user in the early prototyping process in order to bridge the gap between what they say and what the designer understands.
Results and Discussion
Based on the result distribution for each representation, we established the best representation with the following method. Firstly, we assessed whether any dependence exists between the participants. If this first step’s results established a significant dependence, we then proceeded to the second phase and we computed the aggregate preference of both groups and the global preference. For each widget, the Kend-
60
all coefficient of concordance W test was computed. This coefficient expresses the degree of association among n variables, that is, the association between n sets of rankings. The degree of agreement among the 60 people who evaluated the representations is reflected by the degree of variation among the 6 sums of ranks. The comparison of the value obtained from this computation to the critical value shows that the null hypothesis (independence between participants) has to be rejected.
Hypothesis A: user performance depends on the level of fidelity in which users sketch shapes. In other words, differences on users’ speed (efficiency) and accuracy (effectiveness) should appear between the levels of fidelity, amongst none, low, medium, and high. Hypothesis B: user performance depends on widget representation complexity. In other words, differences on users’ speed (efficiency) and accuracy (effectiveness) should appear, these differences being function of widget representation properties, such as number, orientation, inclusion, intersection, juxtaposition, and sequence of atomic components.
We can thus proceed to the second phase of the analysis and establish a ranking among all representations using the Borda Count method. The principle of the Borda Count Method is that, each candidate gets 1 point for each last-place vote received, 2 points for every next-to-last-place vote, etc., all the way up to N points for each first-place vote where N is the number of candidates. On the basis of this analysis we observed that both groups had almost the same preferences among the representations. Most of the time, the set of well considered representations is the same even if small changes in the sequence occur. Out of this results set, we considered the preferred representations with respect to their intrinsic complexity as explained earlier. For instance, list box 4 in Table 2 obtained a good score compared to the other representations, but its intrinsic complexity is very high as it requires hand writing recognition, which was not supported at the moment. Representations 4 and 5 in Table 2 were thus discarded from the final selection. Often, the set of representations selected for the list box is composed of the three first representations depicted in the corresponding set of representations.
Complexity characterization of representations
Prior to conducting the experiment, it is important to characterize the complexity of the widget representations to be used. In the tool studied, widget sketching equals: construction of basic shapes among circle, line, rectangle, and triangle, with respect to binary properties or constraints such as orientation, inclusion, or sequence of components. One specific combination of shapes and binary properties describes the gesture representation of a widget. Ge stu
The resulting catalogue of objects obtained from this study has then been submitted to the second experiment within the UI sketching tool. It is accessible at www.anonym.org. THE COMPLEXITY EXPERIMENT
The second experiment presented in this paper investigates the effect of widget representation in the specific context of UI design by sketching. It investigates the potential influence of the level of fidelity as well, in order to strengthen the following result: users do not change their sketching strategy whatever the fidelity level is (see hypothesis A). Indeed, the usability study presented in [4] showed no significant impact of the “fidelity level” parameter on the user performances
Nu S Co m Si Ju be peci m m In re Se pl fi c xt pl ro ter re ex e ap qu fc or pr se i nc os en in ien om c es ti o i l c ce t u l en i t us po s on at n ta ion ne ion ion tio n ts n
Button
2
Checkbox
2
Combobox
2
X X
X X
Label
1
X
List box
5
X
Picture
2
X
X X
Progress bar
3
X
Radio button
2
X
X
X X
Slider
2
X
Text area
3
X
X
X
Text field
2
X
X
Toggle button
3
X
X X
Table 3. Complexity characterization of widget representations.
Table 3 presents some well-known widgets and, for each widget, a characterization of its gesture representation or visual code (first column). The characterization of a widget includes the number of shapes (from 1 for the label to 5 for the list box) and a combination of binary properties such as: specific orientation (vertical vs. horizontal), simple or complex inclusion, juxtaposition, intersection and sequence of components. This characterization of widgets is built upon Ware’s visual grammar of diagram elements (node-link diagrams) [26].
The usability evaluation purpose is the quantitative analysis of user performance while they are in the interactive situation of sketching widget representations in the different levels of fidelity available in the sketching tool. Consequently, the evaluation criteria chosen to elicit the impact of both widget representation and level of fidelity on user performance are speed and accuracy. On the one hand, speed is representative of users’ efficiency. On the other hand, accuracy is representative of users’ effectiveness. The goal of the usability evaluation presented here is the validation of two hypotheses A and B:
Widgets in Table 3 are sorted according to the alphabetical order: no complexity order was introduced into the characterization at this step of the research. But it appears obvious that the complexity of the widget sketching task relies on the complexity associated to the visual code of the shape to sketch. From this observation, sketching a label, represented as a line, would be easier than sketching a combo box. Not only, the number of shapes and constraints vary between the
61
label and the combo box, but the kind of constraints to be used in a combo box (complex inclusion) is harder to satisfy than in a label (horizontal orientation).
milliseconds until the widget sketching is effective), and the accuracy (i.e., number of delete operations until the widget sketching is effective). Setup
Overall Experimental Design
The survey was based on a 4x12x2 factorial design; 4 fidelity levels were evaluated (none, low, medium and high), 12 frequently used widgets selected from the complete set resulting from the previous experiment (Table 3) and each widget was repeated twice for each level of fidelity. So, all participants received exactly the same 96 triplets (fidelity, widget, iteration) to sketch. However, the presentation sequence of these 96 triplets was randomized so as to neutralize potential task learning effects. The main directive for the participants was to sketch each triplet , as fast and precisely as they could. Participants were asked by a dialog box to sketch a given widget at a time. The fidelity level was automatically set and could not be changed by the user. Once the user considered the widget to be sketched, he had to click on one of the lateral buttons of the tablet PC to move to the next widget. If the widget to draw was present on the drawing surface, then the surface was cleared and a new widget was proposed to the participant. Otherwise, the participant was asked to finish the current component.
Participants
Eleven volunteers participated to this experimental study, 5 females and 6 males. This group of participants was composed of experienced computer users, aged between 22 to 28 years. Moreover, all the participants were considered as expert pen users, as they had significant past experience with pen-based interaction. Apparatus and experimental task environment
The computer system used in this study was a PC Dell Latitude D820 equipped with an Intel Core 2 Duo T7200 (2.0 GHz, 4 Mo cache level 2 memory) processor and 2 Gb of RAM memory. Participants were seated in front of a 21-inch Wacom Cintiq 21UX touch screen flat panel (Fig. 6) connected to this computer running the sketching tool described in the third section. This platform has been selected because it offers the best compromise between stylus precision and interaction surface. Screen resolution was set to 1,600 x 1,200 pixels, with a 32-bit color palette. The keyboard was not required to complete the task since the participants were supposed to use a stylus for sketching.
Results and discussion
The eleven participants completed the 96 timed trials each, for a total of 1056 trials. Hypothesis A is not validated by the experimental results whereas hypothesis B is strongly supported by the results of the experiment. The quantitative evaluation presented below relies on the statistical analysis of two measures: the widget sketching time (ST) in milliseconds and the number of delete operations (DEL). Outliers removal
The data for 3 subjects (288 trials out of the 1056 trials), were removed as outliers, sketching time (ST) being greater than four standard deviations from the sketching time mean trial completion time. These outliers were not correlated with any of the participants. In addition, the data for the label (64 trials out of the 768 remaining) were also removed as outliers, the label being correlated with any of the other widgets in terms of sketching time (ST) distribution. Thus, the remainder of the analysis was performed using 703 trials, one data missing because of a technical problem.
Figure 6. A participant performing the sketching tasks. Task and procedure
One-Way ANOVA Procedure
Each participant received a detailed explanation of the research study. Following the short introduction to the test procedure and test purpose, they performed some training with the tool. Following the training session, participants performed the series of widget sketches with a constant rotation between the widget to be sketched and the fidelity level to be used. Simultaneously, all the relevant data were stored in log file so as to be used for statistical analysis.
The results of the One-Way ANOVA Procedure are presented in Table 4. Factors are fidelity level and widget representation. Responses are the widget sketching time in milliseconds (ST) and the number of delete operations (DEL). Significant influences are underlined. Results presented in Table 4 show that the level of fidelity is not a significant factor: neither on ST (F=1.6813, p=0.1697), nor on DEL (F=1.9900, p=0.1141). This result suggests that the level of fidelity selected to perform widget sketching tasks has no significant effect on users performance and, consequently, invalidates hypothesis A. Moreover, this can be interpreted as follows: users do not change their sketching strategy
Measures
The dependent variables used to assess the participant task performances were the widget sketching time (i.e., time in
62
whatever the fidelity level is, which strengthens the results presented in [4]. Factor Fidelity level
DF 3
Widget representation
7
ST (ms) F=1.6813 p=0.1697 F=7.4317 p