International Environmental Modelling and Software Society (iEMSs) 2012 International Congress on Environmental Modelling and Software Managing Resources of a Limited Planet, Sixth Biennial Meeting, Leipzig, Germany R. Seppelt, A.A. Voinov, S. Lange, D. Bankamp (Eds.) http://www.iemss.org/society/index.php/iemss-2012-proceedings
User Interface Design Considerations for a Time-Space GIS 1
1
2
Jiří Kadlec , Daniel P. Ames , Jim Nelson Geospatial Software Lab, Idaho State University, USA 2 Department of Civil Engineering, Brigham Young University, USA 1
[email protected] 1
Abstract:. This presentation summarizes the user requirements for analysis and visualization of hydrologic time series data in a GIS. Several designs for cartographically presenting time series data points and organizing the user interface have been tested by hydrology students with varying levels of GIS experience. Usability was evaluated using a survey where participants worked on the task of calculating total precipitation and calculating runoff coefficient of a watershed in the users‘ area of interest. Completing the tasks in the survey required filtering, overlay, interpolation or aggregation operations across the time and the space dimensions. The preliminary results of the survey including user comments are presented. Results of the usability studies are guiding the developer team in improving the user interface design of HydroDesktop, an open source GIS application specially designed for interactive visualization and analysis of geographic and time series information. Features of HydroDesktop include spatial and temporal filtering and interpolation, simultaneous display of map and graph view, and linking of spatial features to time-aggregated observation data values. By focusing on usability, we envision HydroDesktop to become an invaluable software tool for exploring the spatial and temporal interaction of hydrologic processes. Keywords: GIS, usability, user interface, hydrology 1
INTRODUCTION
With advances in computer technology, geographic information systems (GIS) have become invaluable tools in environmental system analysis and visualization. One of the strengths of GIS is modelling the world by organizing it into map layers. Similar to soil horizons or geological layers, the combination map layers empower the user to explore and uncover spatial patterns that are not apparent in the traditional paper map. With development of open standards (WaterML), OGC web services (WFS, WCS, SOS) and spatial data infrastructure (INSPIRE framework), an increased amount of hydrological data is becoming available to the end users of GIS. The hydrological processes such as precipitation, evapotranspiration, infiltration, surface and subsurface runoff and channel flow occur in the context of space and time. The traditional user interface of geographic information systems (GIS) has been designed for analyzing spatial variability and patterns. The interface of time series analysis tools is suitable for analyzing variability in the time dimension. For many applications in hydrology, there is a need for a combined user interface that allows interaction between the space and time view [Huang, et al. 2011; Maidment, et al. 2010]. This requires careful user interface design and taskoriented usability testing. 1.2
HydroDesktop
J. Kadlec et al. / User Interface Design Considerations for a Time-Space GIS
As a part of a larger initiative to improve access to hydrological and climate time series observations, the Consortium of Universities for Advancement of Hydrologic Sciences (CUAHSI) has established the Hydrologic Information System (HIS) HIS is a distributed internet system that consists of a network of servers managed by researchers, universities, government agencies and private companies. Each server (also called “hydroserver”) exposes a standard interface of web services for querying time series data that is available on the server. Not only the raw time series data, but also the complete metadata including site, variable, data source, observation method and quality control level are provided with each time series. The servers are registered in a central catalog (HIS Central) that provides additional web services for searching metadata across all registered HydroServers). From the user point of view the most important component of the information system is the client. Several web-based and desktop-based client applications have been developed [Beran 2009, Huang et al. 2011]. Out of these clients HydroDesktop [Ames et al. 2012] provides the most advanced end-user functionality. The key features of HydroDesktop are: 1.3
Searching and downloading time series data Viewing and editing vector GIS datasets Viewing and editing raster GIS datasets Viewing an online base map from a web map service Displaying time series graphs Editing time series data Geoprocessing operations Watershed delineation Hydrological modelling operations Importing and exporting time series data Custom programming of hydrological time series analysis operations using R scripting language User Interface Design of GIS
Initially the usage of GIS has been confined to a small niche of computer experts. With the advance of global positioning systems, web map search and user created maps (such as OpenStreetMap), this is no longer true. The development of open source GIS is also contributing to lower the barrier between the software and the user. One of the remaining obstacles that hinder a wider acceptance of software systems is usability [Nielsen 2003]. The general goal of usability assessment is to quantify and reduce the difficulty of human interaction with a computer program [Rubin 2008]. Numerous studies exist on evaluating the usability of software systems, especially the design of e-commerce websites. However, only a few studies exist on usability testing and user interface design guidelines for GIS, especially for a highly customized space-time hydrologic GIS application. The preliminary results of a usability study of a GIS for hydrologists (HydroDesktop) are presented in the paper. 2.
METHODS
2.1
HydroDesktop Usability Survey Design
To evaluate the user interface of HydroDesktop, an exercise with the theme “Calculate total precipitation and runoff coefficient in a watershed” has been designed. This topic has been chosen because precipitation plays a crucial role in the hydrologic cycle and because it exhibits a high space and time variability. In order to calculate the precipitation, operations on time series (aggregation, estimating missing values) as well as operations in space (interpolation, clipping) are required. The steps taken by the users in the exercise are shown in Figure 1.
J. Kadlec et al. / User Interface Design Considerations for a Time-Space GIS
No
Start HydroDesktop
Zoom to Area of Interest
Find Streamflow Site
Site Found ?
Yes
Aggregate Values By Site and Time period
Download Streamflow and Precipitation Data
Find Precipitation Sites in Watershed
Create Interpolated Raster
Clip Raster with Watershed Polygon
Calculate Volume of Clipped Raster
Delineate Watershed
Precipitation Volume
Figure 1. Steps in calculating precipitation in a watershed. The area of interest and the time period was chosen by the user. A documentation of the procedure for an example watershed was provided . 2.2
Evaluation of Survey Results
In the survey, the following questions were asked: Questions on user experience with software in general, web mapping software and GIS, questions on which parts of the exercise were perceived as easy and which parts were found to be difficult, and general questions about the user interface associated with each task: Which part should be changed and which missing feature should be added and which features the user liked. The detailed exercise and survey is available on the HydroDesktop website [hydrodesktop.codeplex.com/documentation, CUAHSI 2012] 3
RESULTS
At the time of writing of this paper some of the surveys are still in progress. However some preliminary results will be presented here. 3.1
Application Layout – Menu, Ribbon, Docking
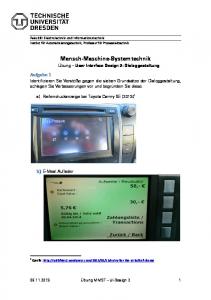
Initially the layout of HydroDesktop was designed using a traditional menu – toolbar user interface. The main window was separated into map, graph and table tabs. The menu, toolbar and tabs were independent – an action in the toolbar didn’t have an effect on the layout or on the visibility of the tabs. In an effort to increase the visual appeal of the software the team decided to adopt a ribbon-style user interface [Microsoft 2010] similar to the style used in Microsoft Office software products. The ribbon user interface has mainly been used for document oriented applications. In its design philosophy the visibility and arrangement of the ribbon buttons is controlled by user actions in the document. The main toolbar of the ribbon is organized in ribbon tabs, allowing the placement of more descriptive icons on the limited space of the main toolbar (Figure 2).
J. Kadlec et al. / User Interface Design Considerations for a Time-Space GIS
Figure 2. Ribbon and docking in HydroDesktop user interface design. Selecting a ribbon tab (top) selects the corresponding dock panel (bottom) In addition to using the ribbon-style design, the main window tabs were replaced by a docking user interface design. This design consists of dockable panels whose size and position can be customized by the user. By default the dockable panels are overlapping, giving the appearance of multiple document tabs. By a drag-drop operation the user can change any dockable panel to a separate window, allowing simultaneous map, table and graph view. The combination of ribbon and docking initially created a problem for new users. Users were expecting the ribbon tabs to control the selection of the dock panels. The headings of the dock panels were placed immediately below the ribbon tabs, causing a drop in usability. Therefore, after an initial evaluation by a user group, the decision has been made to move the captions of the dock panels to the bottom of the main window area. However, after this change some users were still confused because clicking on a ribbon tab didn’t select the corresponding dock panel. Therefore a two-way connection was introduced. In this two-way connection, selecting a ribbon tab selects the corresponding dock panel and selecting a dock panel selects the corresponding ribbon tab. This design has been accepted and it has the added benefit of using the dock panel captions in the bottom of the main window for switching between main tasks. Considering the usage of docking preliminary results show that docking is an advanced feature which was only used by 20 % of users undertaking the surveys. It is not perceived to be an important feature. One reason for this feature could be the survey audience whose majority didn’t have experience with software such as GIS, graphical editors or integrated development environment where docking is extensively used. The second possible reason is that docking is preferred by users with large screens or multiple monitors. This result also demonstrates that the adopted design (two-way link between ribbon tabs and dock panels) does not interfere with user-expected software behaviour, while still giving the advanced docking functionality to power-users that require it. 3.2
Map Operations
Out of the 80 participants in the surveys that were already completed, 50 % had experience with general GIS functionality and had previously used desktop GIS products such as ArcGIS, QGIS or MapWindow. However, more than 75 % had
J. Kadlec et al. / User Interface Design Considerations for a Time-Space GIS
used a web map search application such as Google Maps, Google Earth or Bing Maps. The implication of detailed user comments received so far is that designing the map interface that closely resembles Google Maps should lower the bar for new users. Considering the map navigation toolbar, the zoom-in, zoom-out, pan, previous and next were considered as “easy to use”. However, a considerable number of users mentioned the usage of “selection” as difficult. In the software version of HydroDesktop that was used in the survey, selection required at least two clicks: Changing the map to selection mode and clicking on map or defining the selection rectangle. In addition, selection may be tied to a specific map layer, so selecting the layer may also have been necessary for the selection to become effective. The detailed user response has also identified the need for a “Find Place” map search function. In the task of finding the area of interest, many GIS- and non-GIS users knew the name or the coordinates of the location, but there was no easy way to find the location on the map by simply entering its name in a search box. 3.3
Hydrologic Data Searching Operations
The development of the search interface in HydroDesktop has gone through three major iterations with the goal of improving usability. In the first iteration, a “wizard” style interface in an independent window with five mandatory steps was designed. The required steps were: Select area, Select keywords, Select data source, Select time range and select series for download. This process was found to be too complex by many users. In addition, moving from one step to another didn’t refine the offered search criteria as expected by users. In the second iteration, the search panel was moved to a right-side sidebar with five tabs (area, keywords, options, search management and results). In each tab a search summary was displayed to inform the user about the currently entered search criteria. In the third iteration the search user interface was moved to the ribbon (Figure 3). A special ribbon tab with buttons, text boxes and drop-downs for selecting area, keywords, time range and data source was created. This reduced the number of clicks required for running a simple search. Most users familiar with the last two versions liked the ribbon-style version of the search. However, some critical comments were made especially by non-GIS users in the survey. For some users it was not obvious where to start a search and they would prefer a more guided, wizard-style interface. The most critical comments were on search behaviour. When entering two parameters (keywords), users expected that only sites that have simultaneous observation of both parameters would be returned. After selecting an area, users expect that the available selection of keywords, data sources and time range should be restricted to this area.
Figure 3. A ribbon –style search interface with area, keyword, time range and data source selection in one ribbon tab 3.4
Exploring Time Series Data
In the initial design of HydroDesktop all series returned by search were presented as one map point layer with category symbols using the data source logo icon. In many cases this resulted in multiple overlapping points at one location (if a location has several variables or several data sources that match search results). In order
J. Kadlec et al. / User Interface Design Considerations for a Time-Space GIS
to conduct a data download, users had to use the map selection or the “attribute table” tool, select series for download, specify a “theme name” and start the download operation. To simplify data download, a pop-up context menu feature was introduced (Figure 4). Whenever the user hovers the mouse over a site, the list of data sources and variables matching search results from the site is shown. This enables a more intuitive, interactive exploration of search results using the map.
Figure 4. A pop-up context menu for downloading data from a site found by search Preliminary results of the survey also revealed that not all users preferred using the pop-up feature for data download. In fact, some users complained about not being able to turn off this feature. This may also have been caused by the exercise used in the survey which typically required downloading data from multiple sites. Although a download button designed for the task of downloading data from multiple sites exists in the search ribbon tab, the placement of this button was found as “counter-intuitive”. The main reason was that the ribbon tab design didn’t match the major software user steps. The major steps are: Search, Download, Show Graph but the “Download” step appeared at a lower level, making the download button virtually invisible. Two solutions to this design have been proposed. In the first alternative it is proposed to introduce a specialized download tab with options for filtering, aggregating, selecting and downloading of multiple time series search results. The second alternative suggests removing the download step and only forcing the software to do an automated “on-demand” download if the user asks to display a graph or table of a time series. The comparison of the previous design, current design and proposed design is shown in Figure 5. 3.5
Space-Time Interactions
In traditional desktop GIS applications, non-spatial data associated with geographic features is typically displayed using an attribute table. However, based on the preliminary results of the survey, this design does not appear to be suitable for effectively interacting between point observations locations and associated time series data. The attribute table can only show the metadata of each time series or a limited number of aggregated data values over a time period, but it cannot efficiently display the complete time series. The second encountered issue is filtering or selecting subsets of time series associated with observation locations by time. To overcome this issue a special “Time Series Selector” panel was introduced in HydroDesktop. This panel is located on the same level as the map legend and it controls the visibility of time series in the graph view. This approach has still been found to be counter-intuitive by some users. Users expected to be able to use the legend to control what is visible not only in the map, but also in the graph and table views. It is expected that by combining the legend and the time series selector, improved usability of space-time interaction may be achieved.
J. Kadlec et al. / User Interface Design Considerations for a Time-Space GIS
HydroDesktop 1.2 - 4 Clicks Search Results
Activate Selection
View Graph
Select features in map for download
Select time series for graph
Specify name of theme layer
Data Download
HydroDesktop 1.3 – 2 Clicks Search Results
Mouse hover Over site
Data Download
Select time Series for graph
View Graph
HydroDesktop 2.0 (Proposed) – 1 Click Search Results
Mouse hover Over site -graph
View Graph
Figure 5. Number of steps required from showing search results in a map to displaying time series in a graph. The ellipse represents a required click operation. The current version of HydroDesktop has reduced the number of required steps, but a further reduction (automatic on-demand data download) is suggested. 4
CONCLUSIONS AND RECOMMENDATIONS
The preparation of usability surveys and exercises has motivated the developer team of HydroDesktop to think from a broader range of user perspectives when designing the user interface and to look at the software from a less-experienced non-GIS user point of view. The preliminary survey results have demonstrated that the majority of users is more familiar with web map interfaces (such as Google maps or Bing maps) than with desktop GIS interfaces (such as ArcGIS, QGIS or MapWindow with a toolbar, map and a list of layers in a legend). It has also been shown that reducing the number of required mouse clicks and simplifying the interface may require increased complexity or changing of architecture of the whole information system back-end. For example, the pop-up mouse-hover context menu of time series locations or defining area by place name is a standard expected feature in web mapping applications. However this feature is missing in many GIS development toolkits. Another example is an easy-to-follow search wizard. The main advantage of using a wizard, step-by-step guided approach is that the number of choices is reduced in each step. However this requires the creation of additional query services in the information system, such as a web service that limits the available keywords by area and by time range. The feedback from the user survey has helped the developer team to prioritize and justify the design of complex features on the information system back-end and to distinguish between highpriority and low-priority feature requests. Additional usability surveys are being designed and will be conducted in the near future. The planned exercises include: Creating a map of air temperature anomaly, Finding correlation of groundwater levels and river streamflow in an aquifer, Showing the trajectory of a tropical cyclone, and filling missing values in a precipitation time series from nearest stations. Completing these tasks will require a broad spectrum of time series processing and geospatial processing operations including filtering, overlay, interpolation or aggregation. It is expected that these studies, along with automated user behaviour tracking, will provide more insight into the current user interface
J. Kadlec et al. / User Interface Design Considerations for a Time-Space GIS
design so that HydroDesktop may serve as a prototype of a modern, user-friendly GIS platform for hydrologists. ACKNOWLEDGMENTS The authors would like to acknowledge all hydrology students of the Idaho State University and Brigham Young university who participated in the usability survey. REFERENCES Ames, D.P., Cao, Y., Horsburg, J., Kadlec, J., Valentine, D., Whiteaker, T (In review), HydroDesktop: A Web Services-Based Software for Hydrologic Data Discovery, Download, Visualization and Analysis, Environmental Modeling and Software, 2012. Beran, B., 2007. Hydroseek: an ontology-aided data discovery system for hydrologic sciences. Dissertation: Drexel University. CUAHSI, 2012. HydroDesktop Documentation. [Online] Available at http://hydrodesktop.codeplex.com/documentation. Accessed 3.11.2012. Huang, M., Maidment, D. & Tian, Y., 2011. Using SOA and RIAs for water data discovery and retrieval. Environmental Modelling & Software, Volume 26, pp. 1309-1324. Maidment, D., 2008. Bringing Water Data Together. Journal of Water Resources Planning and Management, pp. 1-2. Maidment, D., Salas, F., Domenico, B. & Nativi, S., 2010. Crossing the Digital Divide: Connecting GIS, Time Series and Space-Time Arrays. San Francisco, American Geophysical Union. Nielsen, J., 1993. Usability Engineering. San Diego, CA: Academic Press. Rubin, J., Chisnell, D., 2008. Handbook of Usability Testing: How to Plan, Design, and Conduct Effective Tests.Wiley, 2008. SDSC, 2011. CUAHSI HIS Central Catalog and Search Web Service. [Online] Available at: http://hiscentral.cuahsi.org [Accessed 1 12 2011].