Journal of the Urban and Regional Information Systems Association Vol. 9, No. 1, pp. 44-54, 1997.
User Interfaces for Map Algebra* H. Thomas Bruns† and Max J. Egenhofer National Center for Geographic Information and Analysis and Department of Spatial Information Science and Engineering University of Maine Orono, ME 04469-5711
[email protected] [email protected]
Abstract Implementations of Tomlin’s Map Algebra enjoy much popularity in GIS use and GIS education. While its basic concepts are easy to understand and teach, it also provides a fairly powerful framework for GIS analysis. Map Algebra reflects the general trend in GIS, where functional enhancements supersede usability enhancements. Recent developments in GIS software and research are also representative of another trend in computer systems, making systems easier and more intuitive to use. Besides variations in functionality and performance, Map Algebra products and prototypes differ primarily in their user interfaces. Implementations range from commandline interfaces to advanced graphical user interfaces. This paper reviews user interface design principles that underlie these different Map Algebra implementations and assesses the approaches taken in various commercial products and research prototypes. Since the very nature of Map Algebra offers a rich source of interface metaphors, these metaphors inspire the design of visual, direct-manipulation user interfaces. The review concludes that visual designs that afford direct manipulation similar to the operations in the source domain, yield highly usable interfaces for GIS Map Algebra and postulates similar rewards for other GIS functional groups.
Introduction The availability of computer technology outpaces its usability. Faster, less expensive computers find homes on the desks of more students, teachers, researchers, business people, and average citizens. Ironically, the same technological trends that make computers more available tends to make certain software “bigger”—more difficult to learn and use. This problem pervades many geographic information systems (GISs). GIS technology was developed to perform basic computerized mapping and spatial analysis. The technology afforded new tasks, ultimately increasing the amount and diversity of functionality in any given GIS to extremes. As a result, contemporary GISs are complex computer systems that often overwhelm their users (Gould 1993).
* This work was partially supported by the National Science Foundation under grant number SBR-8810917 for the
National Center for Geographic Information and Analysis. Max Egenhofer’s work is further supported by NSF grants IRI-9309230 and IRI-9613646; by grants from Rome Laboratories under grant number F30602-95-1-0042, Intergraph Corporation, Environmental Systems Research Institute, and the Scientific and Environmental Affairs Divisions of the North Atlantic Treaty Organization; and by a Massive Digital Data Systems contract sponsored by the Advanced Research and Development Committee of the Community Management Staff and administered by the Office of Research and Development.
† Current address: Human Computer Interaction Lab, University of Maryland, College Park, MD 20742.
Journal of the Urban and Regional Information Systems Association Vol. 9, No. 1, pp. 44-54, 1997.
To make complex software more intuitive and easier to use, the areas of cognitive science and human factors have been considered. Human-computer interaction (HCI) seeks to improve the usability of computer systems by developing theories and guidelines for design and development of user interfaces. HCI creates models of users, tasks, computers, and interactions. The design and implementation of GIS user interfaces has received recognition as a research area that could yield improvements in GIS usability (Kuhn and Egenhofer 1991; Mark et al. 1992; Nyerges et al. 1995). This paper reviews the user interface design principles that underlie different implementations of Map Algebra (Tomlin 1983; 1990) and compares the approaches taken in various commercial products and research prototypes. The basic Map Algebra concepts are easy to understand and teach, and provide a fairly powerful framework for GIS analysis. Besides variations in functionality and performance, Map Algebra systems present interesting differences in their user interfaces. Implementations range from command-line interfaces to directmanipulation interfaces. The differences closely parallel those found in GIS software, and indeed software in general. While the discussions are focused on Map Algebra systems, the reader is encouraged to consider the analysis in a broader sense. Following a brief summary of Map Algebra, a general framework for the systems studied is presented. This framework includes command-line systems and three types of visual user interfaces: form-based systems, flowchart systems, and stack-based systems. The rationale for the different types of visual user interfaces is a cognitive structure, called an image schema (Lakoff and Johnson 1980), that dominates each user interface. The principles of the interactions and visualization of each type of system is presented, along with examples and a discussion of shortcomings and potential improvements. Our review concludes that visual designs mimicking the map-overlay metaphor, derived from the surface image schema, yield highly usable interfaces for GIS Map Algebra and we postulate similar rewards for other GIS functional groups.
Map Algebra Map Algebra is a relatively new expression for a practice going back for over 100 years. It models the surface of the earth as a multitude of independent, coincident layers or themes. The layers interact according to mathematical models and are typically based on real world observations. Planners develop layers on development and population (Steinitz et al. 1976). Social scientists develop layers on demographics, ethnicity, and economic factors (McHarg 1969). Applying a Map Algebra model to input layers produces a new layer, which may be a physical map sheet, a vision perceived through a stack of mylars on a light table, or an electronic dataset displayed on a computer screen. Regardless of the mechanism, the result allows its users to explain complex phenomena, predict trends, or make adjustments to the model. However it is the mechanism which bounds the usability of Map Algebra. How easy is it for scientists to perform simple tasks? Can complex models be developed and tested? Historically, layers were plotted on individual transparent maps which, when superimposed and registered, provide a visually integrated view of the data. The manual process of map overlay is slow and tedious, and has analytical limitations. Computer-based map overlay is more efficient and allows implementations of complex models. The Canada Geogrpahic Information System (Tomlinson 1967) facilitated forms of computer-based map overlay. SYMAP included modules to perform overlay computations (Box 1979; Sheehan 1979). The Map Analysis Package of IMGRID (Sinton 1979) was later formalized by Dana Tomlin (1983, 1990). The term Map Algebra has since come to embody the process of combining map layers, representing distinct but coincident themes according to a mathematical model. Map Algebra is composed of variables, expressions, and functions. Variables are map layers, represented by symbols or names. Expressions (Equation 1) and functions (Equation 2) apply to one or more variables, and may have additional parameters. The left-hand side of these Map
Journal of the Urban and Regional Information Systems Association Vol. 9, No. 1, pp. 44-54, 1997.
Algebra statements is a new dependent variable that can be used in subsequent statements, or viewed as a new map layer. layer0 ← (layer1 + layer2) * layer3 (1) layer0 ← operationX (layer1, layer2, …, layerN, parameters) (2) The exact syntax of Map Algebra expressions, and how they are constructed, varies considerably with the implementation. While the concepts and functionality remain the same, the user interfaces for Map Algebra show a great diversity.
User Interface Design What makes a “good” user interface? Answers to this question are as plentiful as the number of times it is asked. The area of Human-Computer Interaction suggests that a thorough understanding of users and their tasks, together with sound development methodologies and principles, leads to more usable interfaces (Gould and Lewis 1985; Shneiderman 1987; Norman 1988; Molich and Nielsen 1990) such that users perform their tasks quicker and with greater subjective satisfaction. In the past decade, highly graphical and interactive user interfaces have become popular. The term visual is often used synonymously with graphical to characterize a user interface. In this paper the term visual is reserved for interfaces that go beyond the use of graphics to embed cognitive aids in the design itself. In many cases, the design employs interface metaphors— mappings from a familiar source domain onto an unfamiliar target domain (Lakoff and Johnson 1980)—together with direct manipulation, an interaction mechanism by which users see and manipulate objects to affect commands (Shneiderman 1983). In the early 1980s the Xerox Star interface presented users with a metaphor of a physical office, with icons for files, folder, printers, and mailboxes (Smith et al. 1983), followed by Apple’s Macintosh, which presented a similar interface based on a desktop metaphor. Both used direct manipulation to accomplish simple tasks. The theoretical position held here is that interfaces that present a familiar environment for completing a task reduce the cognitive load required of users and accelerate the completion of a task. This is consistent with action-evaluation theories of human behavior. For example, Norman (1988) presents a model where goals are formed, actions planned and executed, and results evaluated. In the first two steps of this model, users map parts of their own task onto allowable actions in the user interface. One study found that this thinking time is reduced with direct manipulation interfaces as with other interfaces, although the motor time was increased (Lim et al. 1996). Another study found that tasks were completed faster with direct-manipulation interfaces than with menu interfaces (Benbasat and Todd 1993). A third study concluded that the degree of support within users’ task domain is even more important than visual or interactive styles (Johnson and Nardi 1996). Together, these studies suggest that direct-manipulation domain-specific interfaces are more usable than other types of user interfaces currently popular. Map Algebra user interfaces parallel trends in commercial software and operating systems, from being text-based to highly graphical and interactive. This review examines the metaphor and interactions employed by some Map Algebra implementations. By no means an exhaustive account, the review discusses a small, representative subset broken down into four main categories: command-line interfaces, form interfaces, flowchart interfaces, and stack interfaces. The latter three are visual interfaces based on the image schemas of container, link, and surface, respectively. For each category, the underlying metaphors and interaction are discussed and examples presented.
Journal of the Urban and Regional Information Systems Association Vol. 9, No. 1, pp. 44-54, 1997.
Command-Line User Interfaces for GIS Map Algebra Principles of Command-Line Interaction With command-line user interfaces, users type in expressions in a formal language, following a strict syntax. Errors typically occur when users misspell or cannot recall a keyword or variable name, or when the syntax is violated. Metaphors are used to help users translate the mathematical models to the correct syntax. For example, the grammar of some systems comes close to that of spoken language, which facilitates the construction of syntactically correct commands. Statements are either entered and parsed one at a time, or in batch-mode read from a file. By adding certain programming constructs, such as conditionals, iteration, and functions, the power and flexibility of a complete programming language becomes available. Command-Line Implementations of GIS Map Algebra Command-line systems for Map Algebra existed before graphical user interfaces were available. Arc/Info’s (ESRI 1992a) commands, for example, have keywords followed by parameters. There are hundreds of commands and options available, so finding the one appropriate for a task often becomes a task in itself. Arc/Info uses a vector data model, which complicates Map Algebra. For example, to add two layers, the overlay of the two layers is first produced and then a new attribute for the sum is created and populated with the sum of the attributes of the original layers. The Arc/Info GRID module (ESRI 1992b) uses a raster data model. Statements in GRID resemble expressions in a programming language. New layers are created by expressing them as a function of other layers. OSU-MAP offers a slightly different form and syntax of Map Algebra (Sandhu et al. 1987). The new data layer created in an expression is specified last, following the keyword FOR. Intergraph’s Modular GIS Environment (MGE) implements Tomlin’s Map Algebra in Grid Analyst (MGGA) with a grid-cell data structure (Intergraph 1993). The command-line language is characterized by four groups of operations: focal, incremental, local, and zonal. The buffer operation, for example, falls under the zonal function group, which performs operations within the surrounding neighborhood of each grid cell in the structure. Beyond Command-Line User Interfaces The examples in Table 1 illustrate that command-line syntax has subtle variations, which may make it difficult for users to migrate between systems. With command-line interfaces, users interact with a screen of text, which has a very high density of information. Generally, it is more difficult to identify and locate textual objects on a screen than graphical objects. The fundamental interaction, typing, may be a burden for users without adequate typing skills. For users with more schematic views of their tasks, or for tasks with several parallel steps, breaking up a problem into discrete statements, which are entered and viewed sequentially, might be a challenge.
Journal of the Urban and Regional Information Systems Association Vol. 9, No. 1, pp. 44-54, 1997.
System Arc/Info
Command Format BUFFER in_cover out_cover {item} {table} {distance} {tolerance} { LINE|POLY|POINT} Arc/Info GRID outgrid = EXPAND (in_grid , #cells , LIST, value_list) OSU-MAP BUFFER layer BY distance FOR newlayer MGGA newlayer = FOCALPROXIMITY OF layer BY distance
Example BUFFER streams stream_buf # # 50 # LINE streams_buf = EXPAND (streams, 5, LIST, 1) BUFFER streams BY 50 FOR streams_buf streams_buf = FOCALPROXIMITY OF streams BY 10
TABLE 1: Command-line GIS formats and examples. The major problems with command-line interfaces are (1) determining the appropriate command for a task; (2) remembering its name and the names of variables; and (3) entering commands in the correct syntax. The latter two problems are significantly reduced in form-based interfaces.
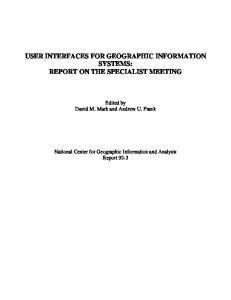
Form-Based User Interfaces for GIS Map Algebra Principles of Form User Interfaces Form-based user interfaces find their home in contemporary graphical user interfaces. Windows, icons, and menus in a high-quality graphical display create of a more pleasant environment than text-only terminals. A form is an independent graphical window, with a set of embedded controls designed to facilitate some task. Windows provide a well defined space, consistent with the container image schema, a basic concept people acquire and use to refer to the different between inside and outside. Windows allow users to jump rapidly and cleanly between multiple tasks, or multiple parts of a single task. The overhead of managing several forms can be burdensome and various strategies exist for alleviating this problem (Shneiderman 1987). Graphics are used to make icons instructive and informative, but the small space typically allocated necessitates careful design and testing (Cassel and Parker 1989). Dynamic or contextual form elements can constrain a user to allowable actions, reducing semantic errors. Pointing with a mouse and typing characterize the interaction in form-based user interfaces. Pointing is used to select icons, push buttons, and make menu selections. Form-assisted generation of text expressions is characteristic of form-based Map Algebra interfaces. Users create a command line, but instead of typing they interact with widgets and the system does the typing. Form Implementations of GIS Map Algebra In addition to the command-line interface, MGE Grid Analyst (MGGA), Intergraph’s Map Algebra module, presents a form to construct a complete Map Algebra statement (Intergraph 1993). The form contains lists of available thematic data layers and available Map Algebra functions, visually arranged in the syntax of a Map Algebra statement, with appropriate keywords between them (Figure 1). The user selects the desired functions and layers, and the system generates a Map Algebra expression in another field.
Journal of the Urban and Regional Information Systems Association Vol. 9, No. 1, pp. 44-54, 1997.
Map Algebra New Layer veg+soil.grd
and
=
Next Layer(s) soils.grd
Operation local
Function sum
of
First Layer veg.grd
slope.grd soils.grd streams.grd veg.grd
Map Algebra Statement veg+soil.grd = LocalSum of veg.grd and soils.grd
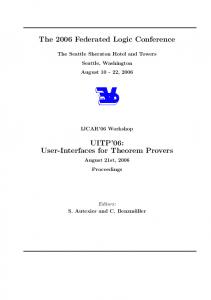
Figure 1: MGGA Map Algebra form. Map II, a GIS for the Macintosh, presents a window with two scrolling lists for operations and maps (Pazner et al. 1989). The user scrolls through the lists to make selections. In a field above the lists, a Map Algebra expression is created. As with the MGGA form, the user can bypass the lists and type in an expression directly, exactly as with a command-line system (Figure 2).
Figure 2: Map II Map Algebra form. IDRISI (Eastman 1992) has two large classes of functions related to Map Algebra: operations on one layer and operations on two layers. Users navigate to these modules via menu selections.
Journal of the Urban and Regional Information Systems Association Vol. 9, No. 1, pp. 44-54, 1997.
Users are presented a form in which they specify the operation, parameters, and input and output layers (Figure 3).
Figure 3: IDRISI. With Arc/Info’s macro facility, the Arc Macro Language (AML) (ESRI 1992c), users could create a form and list interface for constructing Map Algebra expressions, similar to MGGA or Map II. ESRI provides a package of forms and AMLs called ArcTools. The GRID ArcTools include a form for constructing GRID equations, which is very similar to the others described above (Figure 4).
Journal of the Urban and Regional Information Systems Association Vol. 9, No. 1, pp. 44-54, 1997.
Figure 4: Arc/Info GRID ArcTool. Beyond Form Interfaces Form-based interfaces eliminate the need for memorizing command names and syntax. Commands are typically found in hierarchical lists, so locating even a familiar command may take some time. The same metaphorical processes are occurring as with command-lines: users map their tasks onto available commands and available syntax. As with command-line interfaces, users only see a piece of their Map Algebra model at a time, typically one statement. The interactions with forms have little meaning, confined to pointing and clicking on buttons and menus. Flowchart interfaces offer more meaningful interactions, with the added bonus of visualizing an entire Map Algebra model.
Flowchart User Interfaces for GIS Map Algebra Principles of Flowchart User Interfaces A flowchart is a collection of objects arranged and connected in a meaningful way. The visual connectivity of flowchart elements suggests an association, consistent with the link image schema, which establishes connectivity between two or more things. Flowcharts have long been an aid in programming and in general provide a means to logically structure a task close to a user’s mental representation (Myers 1990). Flowchart user interfaces use graphics to convey the functionality of objects and how they are connected. Connecting is often accomplished with direct manipulation, a type interaction in which users see, point to, move, and place graphical objects using a pointing device, typically a mouse (Shneiderman 1983). With flowchart interfaces, users place flowchart elements in a design space and then connect them in a manner consistent with the interface, constructing a model. Data are then fed or plugged into the model and the results appear at the end of the flowchart.
Journal of the Urban and Regional Information Systems Association Vol. 9, No. 1, pp. 44-54, 1997.
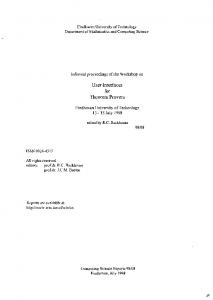
Flowchart Implementations of GIS Map Algebra Flowcharts have been used by GIS researchers to illustrate the structure of environmental models (Tomlin and Berry 1979; Berry 1987; Laurini and Thompson 1992; Berry 1993). Geolineus (Lanter and Essinger 1991), for example, is a flowchart interface that runs on top of Arc/Info and features iconic data layers connected by directional arrows (Figure 5). Its focus was to provide a lineage database (Lanter 1991). The data icons have symbols to reveal the type of data they represent. Attributes are revealed by pointing and clicking on the icons. The connecting arrows represent functions performed on the data layers. Commands are entered on a command line and later visualized as a flowchart.
STREAMS
BUFFER
STREAMS_BUF
SOILS
VEGETATION
SLOPE
ADD
VEG+SOILS
MULTIPLY
EROSION
Figure 5: Geolineus. Kirby and Pazner (1990) offer a different flowchart model with their Graphical Map Algebra. Both the data layers and the functions are represented by icons, connected by pipes (Figure 6). Icons for functions are illustrated with graphics depicting the operation performed. As with Geolineus, the icons can be queried by pointing and clicking.
Journal of the Urban and Regional Information Systems Association Vol. 9, No. 1, pp. 44-54, 1997.
streams Buffer 50m Product
Screen
soils Sum
vegetation
slope
Figure 6: Graphic Map Algebra. The Erdas Imagine Model Maker (ERDAS 1993) allows users to manipulate icons for data and functions for structuring image processing operations (Figure 7). Users select data, functions, or connector icons from a toolbox, and place them in a graphics window. The users associate each data icon with a dataset, using a dialog box. Connecting a data icon with a function icon causes the name of the dataset to appear in the function’s dialog box. The user then identifies the desired function and datasets by choosing them from a list. The Model Maker provides an appealing graphical display, but the direct manipulation is restricted to the placement of icons, since the user specifies the names of all data and functions in a dialog box.
Journal of the Urban and Regional Information Systems Association Vol. 9, No. 1, pp. 44-54, 1997.
streams
vegetation
BUFFER
soils
ADD
streams_buf
veg+soils
slope
MULTIPLY
erosion
Figure 7: Erdas Imagine Flowchart. Beyond Flowchart Interfaces While flowcharts eliminate the need for command lines, they do not eliminate the need for commands, and the command-search problem remains where users must map the parts of their task onto available commands. While some diagrammatic systems allow users to manipulate data layers, the physical process of stacking layers—as in the source domain of map overlay—is mapped onto a process of connecting lines or pipes. Additionally, users are able to see a whole model, a level appropriate for certain tasks. However, flowcharts can become large and complex such that there is the potential that the overhead involved in creating and maintaining a flowchart Map Algebra model will become a task in itself. As their name suggests, flowcharts illustrate flow through a model. Accordingly, the visualization of flowchart interfaces is sometimes derived from a flow metaphor, such as plumbing or electrical circuits. While instructional to the user, this imposes an additional, foreign metaphor to the execution of a task. If a user’s task was plumbing, a plumbing metaphor on a
Journal of the Urban and Regional Information Systems Association Vol. 9, No. 1, pp. 44-54, 1997.
flowchart interface would be appropriate. When the task is Map Algebra, thinking about plumbing distracts from thinking about the real task. The physical and visual aspects of map overlay are potential sources for other interface metaphors that are more native to the task of Map Algebra.
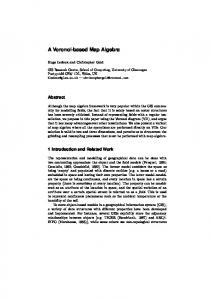
Stack User Interfaces for GIS Map Algebra Principles of Stack User Interfaces Stacking is an operation that is based on the image schema of a surface. A surface is a platform that is oriented such that gravity is orthogonal to it; therefore, any item that is put on top of the platform remains there. Stacks are built by putting items on the platform, one on top of the other. Within a stack, items can be reorganized by moving them to a higher or lower position with in the stack. Stack user interfaces use direct manipulation to place graphical icons in a vertical arrangement. The top of the computer screen is up, and gravity pulls the objects towards the bottom of the screen. These are consistent and sound mappings as long as computer screens are oriented vertically. Stack Implementations of GIS Map Algebra Stack implementations exploit the strong connection between the physical process of map overlay and GIS Map Algebra. Thematic layers were once physically stacked on a light table to combine data for visual analysis. Interfaces that allow users to stack iconic representations of map layers to view GIS data and construct Map Algebra expressions exploit existing knowledge. These interfaces use the map-overlay metaphor. This metaphor has some precedence in GIS user interfaces. In an article on exploratory data analysis, Hazelhoff and Gunnink (1992) included a screen shot of a user interface that shows three stacked iconic layers. The sole purpose of the stack is to illustrate which layers are being displayed; it cannot be manipulated. Standing and Roy (1995) offer a system with icons for different data types and icons for functions. Icons fit together like puzzle-pieces that visually illustrates allowable actions. The visually distinctive parts of the icons, however, are somewhat abstract. A commercial system allowing the direct manipulation of data layers is ArcView 2 (ESRI 1994). Although ArcView 2 does not support Map Algebra, the table of contents of an ArcView view document supports direct manipulation of stacked map layers. A metaphor of a visual overlay is used and the data are drawn in the order that the layers appear in the legend, bottom to top. The data layers can be manipulated, using the mouse to drag them up or down in order to change the draw order. The Geographer’s Desktop (Frank 1992; Egenhofer and Richards 1993a; 1993b) offers a visual, direct-manipulation environment for GIS operations. Familiar direct manipulations (pointing, clicking, and dragging) are applied to iconic representations of GIS datasets and GIS operations. To visualize GIS data, users place data layer icons onto a viewing platform, a metaphor for a light table. Each icon represents a single thematic map layer. The icons are visualized as a perspective view of a map sheet. This metaphor is strengthened when several such icons are stacked on top of each other. The computational platform (Egenhofer and Bruns 1995) combines the map-overlay metaphor with one for addition line computations, an aid for constructing mathematical expressions (Figure 8). The addition line appears as a structure with a vertical arrangement of operands, all above a line that separates the result of the computation. The overlay function also appears above the line, to the left of the operands. This framework is often used to teach children addition, or by adults when adding a column of numbers. On the Geographer’s Desktop, users perform a task in much the same way as with physical map layers. The knowledge the user brings to the task is mapped onto the objects and actions present in the interface.
Journal of the Urban and Regional Information Systems Association Vol. 9, No. 1, pp. 44-54, 1997.
Figure 8: Geographer’s Desktop Beyond Stack Interfaces Stack interfaces for GIS Map Algebra are based on the concept of a surface, the same image schema as in map overlay, the task they facilitate. They employ metaphors strongly based on the visual and physical characteristics of the users’ task. As such, they narrow the gap between users’ conception of a task and the steps required to complete it, more than any other type of interface discussed here. A problem that pervades all systems discussed in this paper remains: the function selection problem. With multitudes of functions available, systems are challenged to create visually distinctive and instructive icons. A hierarchy of functions, with a hierarchy of visualizations, may be appropriate. Major classes of functions are visualized with significant differences, less different within categories. To make all visualizations and interactions based on metaphor is a significant challenge. Interesting new directions might mix multiple image schemas in a single interface. For example, a movable filters window (Bier et al. 1994; Stone et al. 1994), which is based on a container image schema, may be passed over various data layers or other filters, all of which are conceptually stacked on top of each other, consistent with the surface image schema.
Conclusions The purpose of any computer system is to facilitate some task. To complete a task, users must first become familiar with the user interface, its objects, and behaviors. Then users might begin
Journal of the Urban and Regional Information Systems Association Vol. 9, No. 1, pp. 44-54, 1997.
mapping pieces of their tasks onto interactions. The complexity of this mapping is related to how familiar the interface appears, and how specific it is to the task domain. Ideally, both the data and the operations of a user interface have visual, graphical representations. Furthermore, their visualizations afford actions appropriate for each component. Additionally, the visualizations of the components and the interactions used to piece components together are based on a metaphor from the domain of the user’s task. Users see and recognize the components and the actions appropriate for each component. They understand the functionality of each component and how components can be pieced together. All that remains is the user’s task. None of the interfaces discussed here fully meet the above goals. All require some learning. They have vocabularies of functions and certain rules of operation. Command-line interfaces further require spelling and syntax knowledge, as well as typing skills. Users of forms must learn how to navigate hierarchies to locate a specific function. Flowcharts have rules for creating, editing, and connecting elements. How to move and stack data layer icons using direct manipulation must be learned with stack interfaces. With stack interfaces, an attempt is made to exploit the same image schema found in the users’ task away from the computer. Interface metaphors are chosen to communicate this schema. The appearance of interface objects is modeled after geographic data layers, and the interaction is modeled after the physical process of map overlay. But is this enough to improve a user’s performance or increase subjective satisfaction? Empirical studies are needed to compare the usability of all the types of interfaces for GIS Map Algebra discussed here. The lessons learned will be applicable to the broader issue of GIS user interface design.
References Benbasat, I. and Todd, P. 1993. “An Experimental Investigation of Interface Design Alternatives: Icon vs. Text and Direct Manipulation vs. Menus.” International Journal of Man-Machine Studies 38(3):369-402. Berry, J. 1993. “Cartographic Modeling: The Analytical Capabilities of GIS.” In Environmental Modeling with GIS. M. Goodchild, B. Parks, and L. Steyaert, eds. New York: Oxford University Press. 58-74. Berry, J. 1987. “Fundamental Operations in Computer-Assisted Map Analysis.” International Journal of Geographic Information Systems 1(2): 119-136. Bier, E., Stone, M., Fishkin, K., Buxton, W., Baudel, T. 1994. “A Taxonomy of See-Through Tools.” Proceedings of ACM CHI’94 Conference on Human Factors in Computing Systems, 358-364. Box, E. 1979 “The MAPCOUNT Series of Programs for Analysis and Manipulation of SYMAP Results.” In Harvard Library of Computer Graphics, Mapping Software and Cartographic Data Bases. Cambridge, MA: Harvard University. Cassel, R. and Parker, H. 1989. “Design and User Testing of a GIS User Interface.” In GIS/LIS 1989, Orlando, FL. 538-541. Eastman, R. 1992. “IDRISI User’s Guide.” Worcester, MA: Clark University. Egenhofer, M. and Bruns, H. T. 1995. “Visual Map Algebra: A Direct-Manipulation User Interface for GIS.” In Visual Database Systems 3, Visual Information Management, Proceedings of the Third IFIP 2.6 Working Conference on Visual Database Systems. S. Spaccapietra and R. Jain, eds. London: Chapman & Hall. 235-253. Egenhofer, M. and Richards, J. 1993a. “Exploratory Access to Geographic Data Based on the Map-Overlay Metaphor.” Journal of Visual Languages and Computing 4(2):105-125.
Journal of the Urban and Regional Information Systems Association Vol. 9, No. 1, pp. 44-54, 1997.
Egenhofer, M. and Richards, J. 1993b. “The Geographer’s Desktop: A Direct-Manipulation User Interface for Map Overlay.” In Auto-Carto 11, R. McMaster and M. Armstrong, eds. Minneapolis, MN. 63-71. ERDAS. 1993. “Model Maker Tour Guide.” Atlanta, GA: ERDAS, Inc. ESRI 1994. “Introduction to ArcView.” Redlands, CA: Environmental Systems Research Institute, Inc. ESRI 1992a. “ARC Command Reference.” Redlands, CA: Environmental Systems Research Institute, Inc. ESRI 1992b. “GRID Command Reference.” Redlands, CA: Environmental Systems Research Institute, Inc. ESRI 1992c. “AML User’s Guide.” Redlands, CA: Environmental Systems Research Institute, Inc. Frank A. 1992. “Beyond Query Languages for Geographic Databases: Data Cubes and Maps.” In Geographic Database Management Systems. G. Gambosi, M. Scholl, and H.-W. Six, eds. New York: Springer-Verlag. 5-17. Gould, J. and Lewis, C. 1985. “Designing for Usability—Key Principles and What Designers Think.” Proceedings of ACM CHI’83 Conference on Human Factors in Computing Systems. 50-53. Gould, M. 1993. “Two Views of the User Interface.” In Human Factors in Geographic Information Systems. D. Medyckyj-Scott and H. Hearnshaw, eds. Boca Raton, FL: Belhaven Press. 101-110. Hazelhoff, L. and Gunnink, J. 1992. “Linking Tools for Exploratory Analysis of Spatial Data with GIS.” In Third European Conference and Exhibition on Geographic Information Systems, Munich, Germany. 204-213. Intergraph 1993. “MGE Grid Analyst (MGGA) Reference Manual.” Huntsville, AL: Intergraph Corporation. Johnson, J. and Nardi, B. 1996. “Creating Presentation Slides: A Study of User Preferences for Task-Specific versus Generic Application Software.” ACM Transactions on ComputerHuman Interaction 3(1): 38-65. Kirby, K. and Pazner, M. 1990. “Graphic Map Algebra.” In Proceedings of the 4th International Symposium on Spatial Data Handling, K. Brassel and H. Kishimoto, eds. Zurich, Switzerland. 413-422. Kuhn, W. and Egenhofer, M. 1991. “Visual Interfaces to Geometry: CHI’90 Workshop Report.” SIGCHI Bulletin 23(2): 46-55. Lakoff, G. and Johnson, M. 1980. “Metaphors We Live By.” Chicago: University of Chicago Press. Lanter, D. 1991. “Design of Lineage-Based Meta-Data Base for GIS.” Cartography and Geographic Information Systems 18(4): 255-261. Lanter, D. and Essenger, R. 1991. “User-Centered Graphical User Interface Design for GIS.” Technical Report 91-6, Santa Barbara, CA: National Center for Geographic Information and Analysis. Laurini, R. and Thompson, D. 1992. “Fundementals of Spatial Information Systems.” New York: Academic Press. Lim, K., Benbasat, I., and Todd, P. 1996. “An Experimental Investigation of the Interactive Effects of Interface Style, Instructions, and Task Familiarity on User Performance.” ACM Transactions on Computer-Human Interaction 3(1): 1-37.
Journal of the Urban and Regional Information Systems Association Vol. 9, No. 1, pp. 44-54, 1997.
Mark, D., Frank, A., Kuhn, W., McGranaghan, M., Willauer, L., and Gould, M. 1992. “User Interfaces for Geographic Information Systems.” In ASPRS-ACSM Annual Convention, Albuquerque, NM. 264-273. McHarg, I. 1969. “Design with Nature.” Garden City, NY: Natural History Press. Molich, R. and Nielson, J. (1990) Improving a Human-Computer Dialog. Communications of the ACM 33(3): 338-348. Myers, B. 1990. “Taxonomies of Visual Programming and Program Visualization.” Journal of Visual Languages and Computing 1(1): 97-123. Norman, D. 1988 “The Design of Everyday Things.” New York: Doubleday. Nyerges, T., Mark D., Laurini, R., and Egenhofer, M., eds. 1995. “Cognitive Aspects of User Interface Design for Geographic Information Systems.” Dordrecht: Kluwer Academic Publishers. Pazner, M., Kirby, K., and Thies, N. 1989. “MAP II: Map Processor—A Geographic Information System for the Macintosh.” New York: John Wiley & Sons. Rubine, D. 1992. “Combining Gestures and Direct Manipulation.” In Proceedings of ACM CHI’92 Conference on Human Factors in Computing Systems. 659-660. Sandhu, J., Amundson, S., Marble, D. 1987. “The Map Analysis Package.” Columbus, OH: The Ohio State University. Sheehan, D. 1979. “A Discussion of the SYMAP Program.” In Harvard Library of Computer Graphics, Mapping Software and Cartographic Data Bases. Cambridge, MA: Harvard University. Shneiderman, B. 1983. “Direct Manipulation: A Step Beyond Programming Languages.” IEEE Computer 16(8): 57-68. Shneiderman, B. 1987. “Designing the User Interface—Strategies for Effective HumanComputer Interaction.” Reading, MA: Addison-Wesley. Sinton, D. 1979. “An Introduction to IMGRID—An Information Manipulation System for Grid Cell Data Structure.” In Harvard Library of Computer Graphics, Mapping Software and Cartographic Data Bases. Cambridge, MA: Harvard University. Smith, D., Harslem, E., Irby, C., Kimball, R., Verplank, V. 1983. “Designing the Star User Interface.” Byte 7(4): 297-313. Standing, C. and Roy, G., 1995. “The Integration of Functional and Visual Programming for the Development of a Knowledge Based Interface.” In Visual Database Systems 3, Visual Information Management, Proceedings of the Third IFIP 2.6 Working Conference on Visual Database Systems.S. Spaccapietra and R. Jain, R., eds. London: Chapman & Hall. 287-298. Steinitz, C., Parker, P. and Jordan, L. 1976. “Hand Drawn Overlays: Their History and Prospective Uses.” Landscape Architecture, 66 (5): 444-455. Stone, M., Fishkin, K., Bier, E. 1994 “The Moveable Filter as a User Interface Tool.” Proceedings of ACM CHI’94 Conference on Human Factors in Computing Systems. 306312. Tomlin, C. D. 1990. “Geographic Information Systems and Cartographic Modeling.” Englewood Cliff, NJ: Prentice-Hall. Tomlin, C. D. 1983. “A Map Algebra.” In Proceedings of the 1983 Harvard Computer Graphics Conference, Cambridge, MA. Tomlin, C. D. and Berry, J. 1979. “A Mathematical Structure for Cartographic Modeling in Enviromental Analysis.” In Proceedings of the ACSM, 269-283.
Journal of the Urban and Regional Information Systems Association Vol. 9, No. 1, pp. 44-54, 1997.
Tomlinson, R. 1967 “An Introduction to the Geographic Information System of the Canada Land Inventory.” Department of Forestry and Rural Development, Ottawa, Canada.