User-level Resource-constrained Sandboxing Fangzhe Chang, Ayal Itzkovitz, and Vijay Karamcheti Department of Computer Science Courant Institute of Mathematical Sciences New York University ffangzhe, ayali,
[email protected], http://cs.nyu.edu/pdsg
Abstract The popularity of mobile and networked applications has resulted in an increased demand for execution “sandboxes”—environments that impose irrevocable restrictions on resource usage. Existing approaches rely on kernel modification for enforcing quantitative restrictions (e.g., limiting CPU utilization of an application to 25%). However, the general applicability of such approaches is constrained by the difficulty of modifying shrink-wrapped operating systems such as Windows NT. This paper presents a user-level sandboxing approach for enforcing quantitative restrictions on resource usage of applications. Our approach actively monitors an application’s interactions with the underlying system, proactively controlling them to enforce the desired behavior. Our approach leverages a core set of user-level mechanisms that are available in most modern operating systems: fine-grained timers, monitoring infrastructure, debugger processes, priority-based scheduling, and pagebased memory protection. We describe implementation of a sandbox on Windows NT that imposes quantitative restrictions on CPU, memory, and network usage. Our results show that application usage of system resources can be restricted to within 3% of desired limits with minimal run-time overhead.
1 Introduction The increasing availability of network-based services and the growing popularity of mobile computing has resulted in an increased demand for execution “sandboxes”—environments that support differentiated service and impose irrevocable restrictions on resource usage. For instance, the execution environment can ensure qualitative restrictions such as permitting an application component to only access certain portions of the file system (e.g., c:ntemp), and quantitative restrictions such as limiting the component to 20% of CPU share. These qualitative and quantitative restrictions isolate the behavior of other activities on the system from a potentially malicious application component,
and are desirable for the wider deployment of distributed component-based applications. Existing approaches for enforcing qualitative and quantitative restrictions on resource usage rely on kernel support [JLDB95, MST94], binary modification [WLAG93], or active interception of the application’s interactions with the operating system (OS) [BG99, ET99, GWTB96]. The kernel approaches are general-purpose but require extensive modifications to OS structure, limiting their applicability for expressing flexible resource control policies. The remainder of the approaches rely on deciding for each application interaction with the underlying system whether or not to permit this interaction to proceed; consequently, they provide qualitative restrictions (such as whether or not a file-reading operation should be allowed), but are unable to handle most kinds of quantitative restrictions, particularly since usage of some resources (e.g., the CPU) does not require explicit application requests. This paper presents a user-level sandboxing approach for enforcing quantitative restrictions on application’s resource usage. Our approach actively monitors the application’s interactions with the underlying system, proactively controlling them to enforce the desired behavior. Our strategy recognizes that application access to system resources can be modeled as a sequence of requests spread out over time. These requests can be either implicit such as for a physical memory page, or explicit such as for disk access. 1 This observation provides two alternatives for constraining resource utilization over a time window: either control the resources available to the application at the point of the request or control the time interval between resource requests. In both cases and for all kinds of resources, the specific control is influenced by the extent to which the application has exceeded or fallen behind a progress metric. The latter represents an estimate of the resource consumption of the application program. 1 Those
disk operations incurred by paging are also implicit.
For this approach, the primary challenge lies in accurately estimating the progress metric and effecting necessary control on resource requests with acceptable overhead. It might appear that appropriate monitoring and control would require extensive kernel involvement, restricting their applicability. Fortunately, most modern OSes provide a core set of user-level mechanisms that can be used to construct the required support. Presence of fine-grained timers and monitoring infrastructures such as the Windows NT Performance Counters and the UNIX /proc filesystem provides needed information for building accurate progress models. Similarly, fine-grained control can be effected using standard OS mechanisms such as debugger processes, priority-based scheduling, and page-based memory protection. We describe the implementation of a sandbox using the above strategy to impose quantitative restrictions on three representative resources—CPU, memory, and network on Windows NT (The same approach has also been used to implement sandboxing on Linux). A detailed evaluation shows that our implementation is able to restrict resource usage of unmodified applications to within 3% of the prescribed limits with minimal runtime overhead. We also present a synthetic application that demonstrates the flexibility of a user-level sandbox. In this case, our approach permits application-specific control at fine granularity—over differentiated thread and socket groups. The rest of this paper is organized as follows. Section 2 describes background and related work. Section 3 presents the overall sandboxing strategy and discusses its application for three example resource types: CPU, memory, and network. The concrete implementation of the sandbox on Windows NT is presented and evaluated in Section 4. Section 5 highlights the flexibility of userlevel sandboxing, and we conclude in Section 6.
2 Background and Related Work The problem of ensuring that application components are guaranteed a required level of service and do not violate certain qualitative and quantitative restrictions on resource usage has recently attracted a lot of attention. Related approaches can be classified into two broad categories: kernel-level mechanisms and code transformation techniques. Kernel-level mechanisms Real-time Mach supports a Capacity Reserve abstraction [MST94] that guarantees applications a predictable CPU share over periodic time interval. Rialto [JLDB95, JR99] introduces CPU Reservation and Time Constraints, extending the NT kernel to support real-time applications. Resource containers [BDM99] proposes a new UNIX
kernel model for accounting and scheduling resources, which enables fine-grained and predictable resource allocation. Eclipse [BGOS98] implements reservationdomain scheduling of multiple resources (CPU, disk, and physical memory). Resource Kernels [RJMO99] guarantees an application’s timeliness requirements and disk bandwidth using classified reservation schemes. All these approaches require extensive modifications to OS structure. Consequently, their applicability for implementing flexible resource control policies is limited, particularly for shrink-wrapped OSes such as Windows NT. In addition, primarily in the context of real-time operating systems, several scheduling algorithms have been proposed for constraining/fair-sharing CPU resources (e.g., Stride scheduling [WW95], Lottery scheduling [WW94], SMART scheduler [NL97], and Start Time Fair Queuing [GGV96]) and network resources (e.g., Weighted Fair Queuing [DKS89] and Virtual Clock [Zha91]). Implementing these algorithms in a user-level scheduler on Windows NT is restricted because of the interference from OS-level scheduler. Restricted versions of such mechanisms are also available in the form of job control mechanisms [Ric99] in Windows 2000. The latter allows expression of constraints on resource limits for process groups (e.g., maximum total execution time). We complement the job control scheme using a flexible user-level approach, which additionally provides support for constraining network bandwidth and weighted fair-sharing of CPU resources. Code transformation techniques provide a user-level approach for imposing restrictions on resource usage. These techniques, which include binary modification approaches (such as software fault-isolation [WLAG93]) and API interception approaches (such as Janus [GWTB96], Mediating Connectors [BG99], and Naccio [ET99]), all rely on monitoring an application’s interactions with the underlying OS. These techniques leverage OS mechanisms such as system-call interception by a debugger process [GWTB96], or application structuring mechanisms such as DLL import-address-table rewriting [BG99, HB99] to execute some checking code whenever the application interacts with the OS. This code decides, for relevant interactions, whether to allow, delay, or deny the interaction from proceeding. 2 Consequently, such approaches provide the necessary hooks for enforcing qualitative restrictions (e.g., only files in /tmp are readable), but have not been successfully employed for quantitative restrictions because us2 Or,
in some cases (e.g., Janus [GWTB96]), to modify the request into a compliant form prior to allowing it to proceed.
1.0
1.0
1.0
1.0
0.5
0.5
0.5
0.5
0
0 0
t
2t
0
0 0
t
2t
0
(a)
t
2t
0
t
2t
(b)
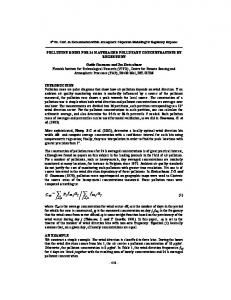
Figure 1. Desired effects on application execution time (x axis) under a resource-constrained sandbox that limits CPU share (y axis) to 50% when the application contains (a) no wait states, and (b) wait states. In the latter case, the sandbox should only cause the ready periods to get stretched out. age of some resources (e.g., the CPU) does not require explicit application requests. In this paper, we extend these techniques to enforce quantitative restrictions over resource usage, with a scheme built upon core monitoring and control mechanisms that are a feature of most modern OSes.
3.1
3 Enforcing Quantitative Restrictions
Constraining CPU usage of an application utilizes the general strategy described earlier. The application is sandboxed using a monitor process that either starts the application or attaches to it at run time. The monitor process periodically samples the underlying performance monitoring infrastructure to estimate a progress metric. In this case, progress can be defined as the portion of its CPU requirement that has been satisfied over a period of time. This metric can be calculated as the ratio of the allocated CPU time to the total time this application has been ready for execution in this period. However, although most OSes provide the former information, they do not yield much information on the latter. This is because few OS monitoring infrastructures distinguish (in what gets recorded) between time periods where the process is waiting for a system event and where it is ready waiting for another process to yield the CPU. To model the virtual processor behavior of an application with wait times (see Figure 1 for a depiction of the desired behavior), we use a heuristic to estimate the total time the application is in a wait state. The heuristic periodically checks the process state, and assumes that the process has been in the same state for the entire time since the previous check.
Our strategy manages the allocation of system resources to an application by relying upon techniques for instrumenting the application, monitoring its progress, and as necessary, controlling its progress of execution. Progress metrics represent estimates of an application’s resource consumption. Instrumenting (using tools such as [BG99, HB99]) allows us to inject code into the application and intercept its API calls on the fly. Since some system resources such as CPU and memory can be accessed without going through a high-level API call that can be intercepted, we control the resources available to the application both at the point of the request (e.g., when sending a message), and between resource requests (e.g., between memory allocations). These techniques leverage a core set of user-level mechanisms that are provided by most modern OSes such as prioritybased process scheduling, page-based memory protection, and fine-grained timers. In the rest of this section, we describe how this strategy can be used to control application consumption of three representative resources: CPU, memory, and network. The goal of controlling resource consumption can be twofold: to simply prevent an application from overusing system resources and starving other applications, or to provide a soft guarantee of and weighted fair sharing of resources to the controlled applications. The latter goal can create, for each application, a virtual execution environment that simulates a physical machine with the prescribed resource limitations. However, meeting this goal requires that extra resources cannot be given to the constrained application even if available. The techniques described in the rest of this paper address this more general goal.
CPU Resources
Here, the quantitative restriction is to ensure that the application receives a stable, predictable processor share. From the application’s perspective, it should appear as if it were executing on a virtual processor of the equivalent speed.
The actual CPU share allocated to the application is controlled by periodically determining whether the granted CPU share exceeds or falls behind the desired threshold. The guiding principle is that if other applications take up excessive CPU at the expense of the sandboxed application, the monitor compensates by giving the application a higher share of the CPU than what has been requested. However, if the application’s CPU usage exceeds the prescribed processor share, the monitor would reduce its CPU quantum for a while, until the average
utilization drops down to the requested level. While the application is waiting for a system event (e.g., arrival of a network message), it is waiting for resources other than the CPU. Consequently, the time in a waiting state is not included in estimating the CPU share and the application would not get compensated for being in a wait state. For this scheme to be effective, the lifetime of the application needs to be larger than the period between sampling points where the progress metric is recomputed.
3.2
relying on an OS-specific protocol for voluntarily relinquishing the surplus physical memory pages allocated to the application (see Figure 2). Also, unlike the CPU case where periodic monitoring and control of application progress is required, here the monitoring and control can adapt itself to application behavior. The latter is required only if the application physical memory usage exceeds the prescribed threshold, which in turn can be detected by exploiting OS support for user-level protection fault handlers.
Memory Resources
The quantitative restriction of interest here is the amount of physical memory an application can use. The sandbox would ensure that physical memory allocated to the application does not exceed a prescribed threshold. Monitoring the amount of physical memory allocated to an application is straightforward. The monitoring infrastructure on all modern OSes provides this information in the form of the process working set (resident set) size. The progress metric is the application’s peak working set size over a period. No control is necessary when the progress is less than the threshold. User-level pager Monitor
Exception handler
3.3
Network Resources
Here, the quantitative restriction refers to the sending or receiving bandwidth available to the application on its network connections. Unlike CPU and memory resources, application usage of network resources involves an explicit API request. This permits the monitoring code injected into the application to keep track of the progress (i.e., amount of data sent/received over a time window) and estimate the bandwidth available to the application. Control is straightforward: if the application is seen to exceed its bandwidth threshold, it can be made compliant by just stretching out the data transmission or reception over a longer time period (e.g., by using finegrained sleeps). The amount of delay is calculated so that the bandwidth at the end-point is not above the prescribed threshold. 3
faults (3)
3.4 Working Set
Non-resident
add (4) remove (5)
ac
)
(1
ce
ss
ss
ce
(2
)
ac
Application
Figure 2. A user-level strategy for controlling application physical memory usage. The application has normal access to pages in its working set (1). When it accesses a non-resident page (2), a page fault is triggered (3). The user-level pager adds this page to the working set (4), and removes extra pages when working set size is above the threshold (5). However, it is more involved to control the application behavior in case the OS allocates more physical pages than the threshold. The problem is that these resources are allocated implicitly subject to the OS memory management policies. The basic idea is to have the monitor act as a user-level pager on top of the OS-level pager,
Other issues
Integrated and implicit resource usage Applications do not access system resources in an isolated fashion. For instance, accessing a non-resident virtual memory page results in the triggering of an interrupt handler, transfer of a page from disk, accompanied with optional swapping out of a resident page and possible enlargement of the process working set size. To correctly handle such coupled accesses to system resources, we need to take into account effects such as increased CPU usage due to OS activity triggered on behalf of the application and additional disk usage because of reduced availability of physical memory pages. Our sandboxing strategy factors in the above effects by appropriately defining the progress metric to reflect both explicit and implicit resource usage. The overall resource usage is forced to adhere to the requested limits by controlling the explicit requests. For example, even though an application’s disk bandwidth usage due to paging is not controllable at the user level, its aggregate disk bandwidth usage can be reduced by controlling 3 For clarity of description, we restrict our attention in this paper to synchronous communication operations and also assume that the data transmission rate in the network is not the bottleneck. The approach needs to be refined slightly to handle situations where communication operations are asynchronous.
explicit disk requests such as file read/write. As a last resort, quantitative rate-based limits on resource usage can be enforced by controlling allocation of CPU resources to the application. Security concerns Given the user-level nature of our solution, a concern might be that an application can escape the sandboxing controls by bypassing our instrumented code. Currently we address this problem by having an enforcer process periodically verify that an application is adhering to its resource limits. The enforcer process terminates the offending process if it finds that the latter’s resource consumption cannot be brought down below prescribed thresholds. As part of our future work, we are working on developing a finer granularity scheme that prevents code modification once sandboxing code is injected into the application, and additionally ensures at run time that the sandboxing code is not bypassed.
4 Implementation on Windows NT This section discusses NT-specific issues and demonstrates the control of CPU, memory, and network resources with experiments. The implementation and performance results below refer to NT 4.0, service pack 5, running on Pentium II 450 MHz machines.
4.1
Constraining use of CPU resources
Monitoring progress The CPU monitor is attached as a callback routine of the fine-grained multimedia timers, and is triggered every 10ms with high accuracy using a technique introduced in [Gri98]. Note that the scheduling quantum on NT is at least 20ms for the workstation installation and 120ms for the server installation. The monitor obtains an application’s CPU usage in terms of kernel time and user time through system API calls. The kernel time refers to the time the application is executing in kernel mode. However, this statistic does not account for all OS activity performed on behalf of the application. For instance, the overhead of memory paging is not included in per-process statistics, instead being recorded in the per-processor statistic. As a heuristic, we estimate the application’s portion of this non-accounted kernel time by considering the ratio of the number of application events triggering such kernel activity (e.g., page faults) to the overall system-wide number of such events. As described in Section 3, the monitor estimates process wait time within a time window by checking the process state and accumulating the time slots at which the process is found waiting. Although NT allows examining process state via its performance counter infrastructure, this incurs high overhead (on the order of milliseconds).
Instead, we employ a heuristic that infers process state based on thread contexts. We observe that a thread can be in a wait state only when it is executing a function inside the kernel. Recognizing that if the thread is not blocked it is unlikely to stay at the same place in kernel code, the heuristic checks the instruction pointer register to see whether a trap instruction (int 2Eh) has just been executed, and whether any general registers have changed since the last check. If the same context is seen, it regards the thread as being in a wait state, with the process regarded as waiting if all of its threads are waiting. Controlling progress Based on the progress metric, the controlling code decides whether or not to schedule the process in the next time slot. Although this decision could be implemented using OS support for suspending and resuming threads (which we use in our Linux implementation), the latter incurs high overheads. Consequently, we adopt a different strategy that relies on finegrained adjustment of application process priorities to achieve the same result. Our approach requires four priority classes (see Figure 3), two of which encode whether CPU resource are available or unavailable to the application. The monitor runs at the highest priority (level 4), and a special compute-bound “hog” process runs at priority level 2. 4 An application process not making sufficient progress is boosted to priority level 3, where it preempts the hog process and occupies the CPU. A process that has exceeded its share is lowered to priority level 1, allowing other processes (possibly running within their own sandboxes) or in their absence, the hog, to use the CPU. Note that this scheme allows multiple sandboxes to coexist on the same host. Priority level 4 3 2 1
CPU available Monitor Application Hog
CPU not available Monitor Hog Application
Figure 3. Controlling application CPU availability by changing process priorities. Effectiveness of the sandbox Our experiments show that this implementation enables stable control of CPU resources in the 1% to 97% range. When the requested share is above 97%, the measured allocation includes perturbations from background load (the performance monitor, system processes, and the sandboxing code). 4 Hog runs at a very low priority and executes only when no other normal applications are active, ensuring that even when CPU resources are available, each application does not receive more than its prescribed share.
The interference from sandboxing code consists of the monitor overhead and bursty allocation of resources to the hog process over long runs (this is an NT feature for avoiding starvation). The overhead of adjusting the priority is negligible. To measure the overall costs of running an application within a sandbox, we compare the wall-clock execution time of a synthetic CPU-intensive application running within and outside of a sandbox. On average, this application took 35.529 seconds to finish when running alone, and took 36.064 seconds when running inside a sandbox prescribing a CPU share of 100%, indicating an overhead of about 1.5%. CPU
50
sleeps periodically, without sandboxing (left) and with a sandboxed CPU share of 50% (right). The working time with the sandbox is twice the amount on the left, corresponding to the halved CPU resource. More importantly, the sleep (wait) time is kept the same, consistent with Figure 1 and verifying the effectiveness of our state-checking heuristic.
4.2
Constraining use of memory resources
Monitoring progress An API call, GetProcessMemoryInfo, provides information about the resident memory of a process. Unlike the CPU case, the sampling of this information can be adapted to the rate at which the application consumes memory resources. To estimate the latter, we integrate the sampling with the controlling scheme described below.
30
10 t1
t2
t3
t4
t5
Time
(a) CPU
75
50
25
0 outside of sandbox
inside sandbox (50% CPU)
Time
(b) Figure 4. (a) Weighted CPU sharing for multiple applications. (b) Constraining CPU share for applications with wait states. Figure 4(a) is a snapshot of the performance monitor display showing three sandboxed applications running on the same host. They start at times t1, t2, and t3, requesting 10%, 30%, and 50% of the CPU share, respectively. With the total CPU load at 90%, all three applications receive a steady CPU share until time t4, when we deliberately perturb the allocation by dragging a window. This causes the total available CPU to decrease drastically (because of the kernel activity), and a sharp decrease in the immediate CPU shares available to each application. However, this drop is compensated with additional CPU resources once the system reacquires CPU resources (end of window movement). These results indicate that the sandbox can support accurate and stable CPU sharing with resilient compensation. Figure 4(b) shows the execution of an application that
Controlling progress As described in Section 3, controlling progress of memory resources requires the sandboxing code to relinquish surplus memory pages to the OS. To do this, we rely on a convention in NT: pages whose protection attributes are marked NoAccess are collected by the swapper. The same core OS mechanism, user-level protection fault handlers, is used to decide both (a) when a page must be relinquished, and (b) which page this must be. Our scheme intercepts the memory allocation APIs (e.g., VirtualAlloc and HeapAlloc) to build up its own representation of the process working set. When the allocated pages exceed the desired working set size, the extra pages are marked NoAccess. When such a page is accessed, a protection fault is triggered: the sandbox catches this fault and changes page protection to ReadWrite. Note that this might enlarge the working set of the process, in which case a FIFO policy is used to evict a page from the (sandbox-maintained view of the) working set. The protection fault handler also provides a natural place for sampling the actual working set size, since a process’s consumption of memory is reflected by the number of faults it incurs. A few additional points need clarification. The implementation is simplified by not evicting pages containing executable code, so this limits the least amount of memory that can be constrained. Eviction at the sandbox level may or may not cause the page to be written to disk although these pages are excluded from the process working set; when the system has large amounts of free memory, NT maintains some pages in a transition state delaying writing them to disk. Note that with our design, if the application is running within its memory limits, it will not suffer from any runtime overhead (except that of intercepting API calls). Beyond that point, the overheads are a function of process virtual memory locality
Measured Memory (MB)
behavior.
Figure 5(a) shows the requested and measured physical memory allocations for an application that has an initial working set size of 1.5MB and allocates an additional 20MB of memory. The sandbox is configured to limit available memory to various sizes ranging from 2MB to 21MB. As the figure shows, the measured memory allocation of the application (read from the NT Performance Monitor) is virtually identical to what was requested.
21 17 13 9 measured
5
ideal
1 1
5
9
13 17 21 Requested Memory (MB)
Execution time (sec)
(a) 800 700 600 500 400 300 200 100 0 5
6
7
8
9 10 11 12 Working set size (MB)
(b) Figure 5. (a) Controlling the amount of physical memory utilized by an application. (b) Execution time as size of working set varies. Effectiveness of the sandbox Our experiments show that, on a 450 MHz Pentium II machine with 128MB memory, this sandbox implementation can effectively control actual physical memory usage from 1.5MB up to around 100MB. The lower bound marks the minimal memory consumption when the application is loaded, including that by system DLLs. 5 The upper bound approximates the maximum amount of memory an application can normally use in our system. The memory overhead includes 64KB for the code injected into application address space and 4 bytes for keeping track of each page in the working set. The overhead of intercepting a memory allocation call is measured as 1.07µ s when the specified memory constraints are above the working set size (thus no page fault is incurred). When the constraints are below the required working set size, process memory locality behavior determines the overhead. However, because of our CPU accounting scheme, only this process’s execution time is affected. 5 To
compare, a “Hello, world” program consumes about 500KB memory and one that creates a TCP socket consumes 1MB memory.
Figure 5(b) demonstrates the impact of the memory sandbox on application execution time. The application under study has a memory access pattern that produces page faults linearly proportional to the non-resident portion of its data set. In this case, the application starts off with a working set size of 1.5MB and allocates an additional 8MB. The sandbox enforces physical memory constraints between 5MB and 12MB. As the figure shows, the execution time behavior of the application can be divided into three regions with different slopes. When the memory constraint is more than 9.5MB, all of the accessed data can be loaded into physical memory and there are no page faults. When the memory constraint is below 9.5MB, total execution time increases linearly as the non-resident size increases, until the constraints reaches 6.25MB. In this region, page faults occur as expected but the process pages are not written to disk. When available memory is below 6.25MB, we observe heavy disk activity. In this segment, the execution time also varies approximately linearly, with the slope determined by disk access characteristics. These experiments show that our sandboxing scheme does not produce any anomalous page faulting behavior.
4.3
Constraining available network bandwidth
Monitoring and controlling progress As described in Section 3, we intercept socket APIs (accept, connect, send, and recv) to monitor and control available network bandwidth. Effectiveness of the sandbox The effectiveness of the sandbox is evaluated on a pair of Pentium II (450 MHz) machines connected to a 10/100 auto-sensing Fast Ethernet hub. The application consists of a server and one or more clients in a simple ping-pong communication pattern. The peak bandwidth measured without the sandbox is 9.7MBps, whereas the sandbox permits effective control of bandwidth over the range 1Bps to 8.8MBps. The overhead of sandboxing due to API interception lowers the maximum achievable bandwidth by about 0.4%, measured by comparing the case when the application is running alone and the case when it is running inside the sandbox with a bandwidth threshold that will never be reached. Figure 6(a) shows the perceived bandwidth (at both
Ideal
10
Server Client 1 1
10 100 1000 Requested bandwidth (KBps)
7000 5000 Ideal 3000
Server Client
1000 1000
3000
(a)
5000 7000 Requested bandwidth (KBps)
(b)
Measured bandwidth (KBps)
100
Measured bandwidth (KBps)
Measured bandwidth (KBps)
1000
7000 5000 Ideal 3000
Server Client
1000 1000
3000
5000 7000 Requested bandwidth (KBps)
(c)
Figure 6. Measured bandwidth (a) for 1KB messages as requested bandwidth varies from 1KBps to 1000KBps, (b) for 1KB messages as requested bandwidth varies from 1000KBps to 8000KBps, (c) for 10KB messages as requested bandwidth varies from 1000KBps to 8000KBps. server and client), measured by the application, as the sandbox constrains network bandwidth from 1KBps to 1000KBps. In the figure, the server and client bandwidth lines are virtually indistinguishable from each other and within 1% of the requested limit. Figure 6(b) shows the same measurement when bandwidth constraints are applied in the range 1000KBps to 8000KBps. When the requested bandwidth is below 4000KBps, the sandbox enforces the request with an error of at most 2%. However, error grows for higher bandwidths. For example, at 8000KBps, the sandbox can sustain a bandwidth at best 16% lower than requested. This is mainly due to the inaccuracy of the fine-grained sleep at sub-millisecond level on NT as well as the overhead of API interception. Figure 6(c), using 10KB messages, shows that the sandbox can be used to accurately sustain higher requested bandwidth as long as the message size scales proportionally. Here, the error between measured and requested bandwidths is less than 2%.
4.4
Experience with NT implementation
We have used the sandbox for various kinds of applications, including Microsoft Windows Media Player and Apple Quicktime Player for playing video streams in presence of compute and memory-intensive background processes. We can guarantee a smooth streaming video (without perceptible frame loss) either by sandboxing the background processes or by sandboxing the media players with a high CPU share. Our experiments have highlighted some limitations that we plan to address in future work. When we play two media players at the same time with one of them receiving a small CPU share, we observe frame loss in the other player due to priority inversion. The media player receiving the smaller share holds on to a shared resource (e.g., the sound card) even when it is not scheduled, causing the other player to drop frames. This problem could be addressed by intercepting the API calls used for acquiring such resources and integrating a priority inheritance mechanism into our pol-
icy for controlling CPU progress. In addition, our existing strategy cannot guarantee predictable resource allocation for hard real-time applications. This limitation can be fixed by using a real-time scheduling policy to determine allocation of CPU resources, instead of the current greedy policy.
4.5
Differences in Linux implementation
Linux provides support very similar to Windows NT for instrumenting application binaries, and monitoring and controlling resource consumption. For instance, library functions such as the sockets and memory allocation APIs, can be intercepted by preloading shared libraries. The mechanisms and performance of network bandwidth control are identical across the Windows NT and Linux platforms. However, there are small differences in how CPU and memory resources are constrained under Linux. Controlling CPU resource Adjusting scheduling priorities requires superuser privilege on Linux. Therefore, we use a scheme based on thread suspend/resume: the sandbox sends an application a SIGSTOP signal to suspend and a SIGCONT signal to resume its execution. Controlling memory resource Linux provides a setrlimit API for limiting the maximum amount of physical memory a process can use. However, current versions of the kernel (e.g., v2.2.12) do not enforce this constraint. Consequently, we adopt a scheme identical to the one on NT. However, unlike on NT, where an implicit protocol (using NoAccess protection bits) between the OS and the application permits the former to collect pages not required by the latter, no such protocol exists on Linux. The page protection bits can be set as on NT, but the kernel swapper (kswapd), does not check the page attributes to decide which page must be swapped out. We get around this problem somewhat inelegantly by
handling the swapping ourselves. First, we intercept memory allocation functions (e.g., malloc) to make sure that only the requested amount of physical memory is kept valid; all other memory pages are protected to be unavailable for access. When a page fault happens due to invalid access, we pick another page (in FIFO order) from the resident set (maintained by the sandboxing code), save its contents to our own swap file, and take it out of the resident set using the munmap mechanism in Linux. Subsequently, an invalid access requires that the saved contents be mapped back to the corresponding virtual address.
CPU 40 Thread group 1 30
20
Thread group 2
10
0 Time
Figure 7. Control of CPU usage at the level of thread groups.
5 Extensibility of User-level Sandboxing This paper has described a general, user-level strategy for building sandbox environments that has been tested on both Windows NT and Linux. It is interesting to observe that modern OSes provide sufficient support to permit implementation of quantitative constraints at the user level. The shared library support enables interception of system APIs; the monitoring infrastructure makes possible acquiring of almost all necessary information; the priority-based scheduling, debugger processes, and signal handling mechanisms allow the adjustment of an application’s CPU usage; the memory protection and memory-mapped file mechanisms permits control of the amount of physical memory available to an application. Finally, the socket interface gives direct control of network activities. Most resources in an operating system can benefit from some combination of these techniques. In fact, user-level approaches provide more flexibility in deciding the granularity, the policies, and monitoring/controlling mechanisms available for enforcing sandbox constraints. We demonstrate this extensibility by customizing our process-level sandbox implementation on Windows NT to limiting resource usage at the level of thread and socket groups, instead of the default process granularity assumed in Section 3. The required modifications were simple, just involving changes in the progress expressions used in the monitoring code and some specialization of the controlling code. Controlling CPU usage of thread groups Figure 7 shows a snapshot of the system CPU usage (as measured by the NT Performance Monitor) for an application with two groups of threads, each of which is constrained to a total CPU share of 40%. The application itself consists of three threads which start at different times. Initially, the first thread starts as a member of thread group one and takes up a 40% CPU share. The second thread starts after ten seconds and joins thread group two. It also gets 40% of the CPU share, the total capacity of this thread group. After another ten seconds, the third
thread joins thread group two. The allocation for the second thread group adjusts: the third thread gets a 30% CPU share and the second thread receives a 10% CPU share, keeping the total CPU share of this thread group at 40%. Note that the CPU share of the first thread group is not affected, and that we are able to control CPU usage of thread groups as accurately as at the process level. Currently, the resource allocation to threads in the same group is arbitrary and not controlled. However, one could set up a general hierarchical resource sharing structure, attesting to the extensibility of the user-level solution. Controlling bandwidth of socket groups Figure 8 shows the effect of restricting network bandwidth at the level of socket groups, where the total bandwidth of a socket group is constrained. The application used in the experiment consists of one server instance and three client instances. The server spawns a new thread for each client, using a new socket (connection). The communication pattern is a simple ping-pong pattern between the clients and the server. Figure 8(a) shows the performance of server threads when the bandwidth constraint is enforced at the process level. The total network bandwidth is restricted to 6MBps. The clients and server exchange 100,000 4KB-sized messages. The figure shows the number of messages sent by the server to each client as time progresses. The first client starts about the same time as the server and gets the total bandwidth of 6MBps (as indicated by the slope). The second client starts after one minute, sharing the same network constraint. Therefore, the bandwidth becomes 3MBps each. The communication is kept at this rate for another minute until the third client joins. This makes all three of them transmit at a lower rate (2MBps). As a result, the first client takes more than 400 seconds to complete its transmission, due to the interference from the other two clients. Figure 8(b) shows the case where the first client needs
Number of messages
on an application’s resource usage. It evaluates a concrete implementation of the sandbox on Windows NT, using three representative resource types as examples: CPU, memory, and network. Our evaluation shows that the user-level sandboxing approach can achieve accurate quantitative restrictions on resource usage with minimal run-time overhead, and can be easily extended to support application-specific constraining policies.
100000 Socket 1 80000
Socket 2 Socket 3
60000 40000 20000 0 0
50
100
150
200
250
300
350
400 Time (sec)
Number of messages
(a) 100000
In future work, we plan to develop a security architecture that ensures sandbox compliance from malicious applications at a finer granularity and address problems arising from priority inversion and the absence of real-time scheduling.
Socket 1 Socket 2
80000
Socket 3
Acknowledgments
60000
40000 20000
0 0
50
100
150
200 Time (sec)
(b) Figure 8. Control of network bandwidth (a) at process level, (b) at socket group level. to receive a better and guaranteed level of service. Two socket groups are used, with the network bandwidth of the first constrained to 4MBps and that of the second group to 2MBps. Clients start at the same times as before. However, the performance of the first client is not influenced by the arrival of the other two clients. Only the two later clients share the same bandwidth constraint. In consequence, the first client takes only 200 seconds to finish its interactions. These experiments demonstrate that user-level sandboxing techniques can be used to create flexible, application-specific predictable execution environments for application components of various granularity. As a large-scale application of such mechanisms, we have exploited these advantages in other work [CK00] to create a cluster-based testbed that can be used to model execution behavior of distributed applications under various scenarios of dynamic and heterogeneous resource availability.
6 Conclusion and Future Work This paper describes the construction of a user-level resource-constrained sandbox, which exploits widely available OS features to impose quantitative restrictions
We would like to thank Zvi Kedem, who suggested using different priority levels to efficiently control a sandboxed process’ CPU usage, and Anatoly Akkerman and Arash Baratloo for their help with implementing the sandbox on Linux. We also thank Lionell Griffith for giving us his implementation of fine-grained timers on Windows NT. This research was sponsored by the Defense Advanced Research Projects Agency under agreement numbers F30602-96-1-0320, F30602-99-1-0157, and N66001-00-1-8920; by the National Science Foundation under CAREER award number CCR-9876128; and Microsoft. The U.S. Government is authorized to reproduce and distribute reprints for Government purposes notwithstanding any copyright annotation thereon. The views and conclusions contained herein are those of the authors and should not be interpreted as necessarily representing the official policies or endorsements, either expressed or implied, of the Defense Advanced Research Projects Agency, Rome Laboratory, SPAWAR SYSCEN, or the U.S. Government.
References [BDM99]
G. Banga, P. Druschel, and J. Mogul. Resource containers: A new facility for resource management in server systems. In Proc. of 3rd USENIX Symposium on Operating Systems Design and Implementation (OSDI), Feb. 1999.
[BG99]
R. Balzer and N. Goldman. Mediating connectors. In ICDCS Workshop on Electronic Commerce and Web-based Applications, 1999.
[BGOS98] J. Bruno, E. Gabber, B. Ozden, and A. Silberschatz. The Eclipse operating system: Providing quality of service via reservation
domains. In Proc. of USENIX 1998 Annual Technical Conference, Jun. 1998. [CK00]
F. Chang and V. Karamcheti. Automatic configuration and run-time adaptation of distributed applications. In Ninth IEEE Intl. Symposium on High Performance Distributed Computing, 2000.
[DKS89]
A. Demers, S. Keshav, and S. Shenkar. Analysis and simulation of a fair queueing algorithm. In Proc. SIGCOMM ’89 Symposium, Sep. 1989.
[ET99]
D. Evans and A. Twyman. Flexible policydirected code safety. In IEEE Symposium on Security and Privacy, 1999.
[GGV96]
[Gri98]
P. Goyal, X. Guo, and H. Vin. A hierarchical CPU scheuler for multimedia operating systems. In Proc. of 2nd Symposium on Operating Systems Design and Implementation, 1996.
[Ric99]
G. Hunt and D. Brubacher. Detours: Binary interception of Win32 functions. In Proc. of 3rd USENIX Windows NT Symposium, Jul. 1999.
[JLDB95]
M. Jones, P. Leach, R. Draves, and J. Barrera. Modular real-time resource management in the Rialto operating system. In Proc. of 5th Workshop on Hot Topics in Operating Systems, May 1995.
[JR99]
M. Jones and J. Regehr. CPU reservations and time constraints: Implementation experience on windows NT. In Proc. of 3rd USENIX Windows NT Symposium, Jul. 1999.
[MST94]
C. Mercer, S. Savage, and H. Tokuda. Processor capacity reserves: Operating system support for multimedia applications. In Proc. of IEEE International Conference on Multimedia Computing and Systems, May 1994.
[NL97]
J. Nieh and M. Lam. The design, implementation & evaluation of SMART: A
J. Richter. Make your windows 2000 processes play nice together with job kernel object. In Microsoft Systems Journal, Mar. 1999.
[RJMO99] R. Rajkumar, K. Juvva, A. Molano, and S. Oikawa. Resource kernels: A resourcecentric approach to real-time systems. In Proc. of SPIE/ACM Conference on Multimedia Computing and Networking), Jan. 1999. [WLAG93] R. Wahbe, S. Lucco, T. Anderson, and S. Graham. Efficient software-based fault isolation. In 14th ACM Symposium on Operating Systems Principles, 1993. [WW94]
C. Waldspurger and W. Weihl. Lottery scheduling: Flexible proportional-share resource management. In Proc. of 1st Symposium on Operating Systems Design and Implementation, Nov. 1994.
[WW95]
C. Waldspurger and W. Weihl. Stride scheduling: Deterministic proportionalshare resource mangement. Technical Report Technical Memorandum MIT/LCS/TM-528, MIT Laboratory for Computer Science, Jun. 1995.
[Zha91]
L. Zhang. Virtual clock: A new traffic control algorithm for packet switched networks. In Proc. ACM Trans. on Computer Systems, May 1991.
L. Griffith. Precision NT event timing. Windows Developer’s Journal, Jul. 1998.
[GWTB96] I. Goldberg, D. Wagner, R. Thomas, and E. Brewer. A secure environment for untrusted helper applications. In Proc. of 6th USENIX Security Symposium, Jul. 1996. [HB99]
scheduler for multimedia applications. In Proc. of 16th ACM Symposium on Operating System Principles, Oct. 1997.