tracking system is necessary for an exact user interaction. So far, common ... deployed in ticketing and cash machines as well as in kiosk application in public areas, .... assistants. We informed them about logging the pointing interactions on ...
User Model for Predictive Calibration Control on Interactive Screens Bastian Migge, Andreas Kunz Department of Mechanical and Process Engineering ETH Zurich Tannenstrasse 3, 8092 Zurich, Switzerland {migge, kunz}@iwf.mavt.ethz.ch
Abstract— On interactive surfaces, a precise calibration of the tracking system is necessary for an exact user interaction. So far, common calibration techniques focus on eliminating geometric distortions. This static calibration is only correct for a specific viewpoint of one single user and parallax error distortions still occur if this changes (i.e. if the user moves in front of the digital screen). In order to overcome this problem, we present an empirical model of the user’s position and movement in front of a digital screen. With this, a model predictive controller is able to correct the parallax error for future positions of the user. We deduce the model’s parameters from a user study on a large interactive whiteboard, in which we measured the 3D position of the user’s viewpoint during common interaction tasks. Keywords- Parallax Error; Parallax Correction; Model Predictive Control; User Model; User Viewpoint; User Study; Interactive Surface; Digital Whiteboard
I.
display device (output) is essential. Today, this is usually done initially by a manual so-called static calibration, which mainly corrects time-invariant geometrical distortions. A static calibration is done by sampling a certain set of target points against tracking points, asking the user to hit one after the other. However, this approach does not overcome the parallax error, which results in an offset between the coordinates of the tracking system and the corresponding coordinates on the display (see Figure 1. ). The error is caused by the distance between the screen’s surface and the glass plane of the tracking overlay, which is necessary to accomplish physical robustness of the system. Even a distance of a few millimeters between image plane and interaction plane can cause enough optical distortion to significantly impair the user’s interaction.
INTRODUCTION
Interactive surfaces become increasingly popular as human-computer interaction technology. They are widely deployed in ticketing and cash machines as well as in kiosk application in public areas, due to the robust and intuitively useable Human Computer Interface. Moreover, large digital whiteboards [4] and tablets are already widely spread in distributed collaborative environments of development and research teams. They allow multiple users to interact on the same digital content at a time [1][5]. The emerging tracking technologies enable mighty but intuitive and easy to learn interaction techniques like multi touch and gesture-based interaction. For example, interactive surfaces allow integrating well-known real objects into the communication between digital and real world, such as pens, rulers and erasers [15][16] (e.g. SMARTBoard1). To assure a high quality interaction, a close coupling between the touch-sensitive tracking device (input) and a 1
http://www.smarttech.com
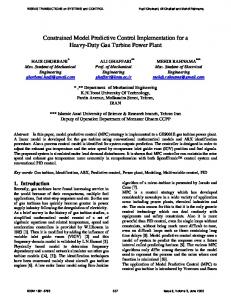
Figure 1. Parallax distortion at a NY ticket machine
The resulting so-called parallax distortion can be derived from the geometry as shown in Figure 2.
II.
Vx ax
3
2
Image plane vz Interaction plane
1
az
z x
User Figure 2.
y Parallax distortion in x-direction.
It is: • Vz: Distance (offset) between image plane and interaction plane • Vx: Resulting parallax distortion in x-direction • ax: Distance from user to interaction point in xdirection • az: Distance from user to interaction point in zdirection Point 1 in Figure 2. represents the interaction point, i.e. the point of contact on the interaction plane. Point 2 is the one the user aims at, while point 3 is the registered point resulting from the parallax distortion. Once the user’s viewpoint is known, the distortion Vx can be easily calculated by equation 1 for the x-direction. Vx =
Vz ⋅ ax az
positions is deduced from a preliminary study, which we will present first.
(1)
Note that this equation only takes the geometric conditions into account and omits refraction indexes caused by the different media and different attenuations. As shown in Figure 2. the parallax error depends on the offset between image plane and interaction plane, as well as on the user’s viewpoint. Since the user moves while interacting with the system, a conventional calibration, which is done for a static viewpoint, does not correct the upcoming error. The error has to be corrected by continuously adapting to the user’s behavior, minimizing the user’s irritation due to changing the applied correction parameter. Since the controller has to set up the parallax correction particularly for the future position of the user, it uses model predictive control [2]. To select the correction parameter as a tradeoff between the immediate effects and the future, the controller prediction has to be made based on a model that describes the user’s viewpoint. In this paper, we present an empirical model of the user’s viewpoint in front of large interactive vertical screens, which is derived from a user study. Since the user’s viewpoint strongly depends on the position of the aimed targets on the screen, the task for the study is to measure the viewpoint by simulating the click behavior for daily business office tasks. Therefore, the underlying probability distribution of click
RELATED WORK
Common display calibration mechanisms were initially developed to establish the geometrical alignment between tracking and projection systems. Dao et al. [13] and Lee et al. [14] show how to automatically adapt the projector calibration parameters to the projection surface. However, these systems ignore the influence of the user’s viewpoint. Nowadays, interactive screens use a flat (LCD) screen instead of a projector with very limited geometrical calibration capabilities. Due to this fact, the alignment between image and interaction plane has to be integrated into the tracking system. Common calibration methods transform the user input (touch screen coordinates) into display point coordinates by a static linear transformation [7]. Its parameters are derived from a dedicated sampling session, instructing the user to hit upon a finite set of targets (calibration points) on the screen. Inoue et al. describe an effective sequence of calibration points to successively refine the touch error [8]. Afterwards, the measurements of the local pointing error are generalized to parameterize a static correction system. Kent et al. [9] extend this to a non-linear correction, which takes the noise of the tracking system input into account. Moreover, HongPing et al. [10] introduced a learning calibration method based on back propagation neuronal networks. An online correction approach is presented by Migge et al. [11]. It continuously adapts the error correction to an inferred viewpoint at runtime. The underlying discrete user model defines the movement probability relative to the users current position for the next discrete time step and the overall probability of the users position relative to the screen. Due to the fact of being defined relative to the inferred viewpoint, the controller’s model must be small enough to be implemented into the embedded tracking system’s firmware. However, it still has to be solved how the model of the user’s behavior will be defined in detail. III.
PRELIMINARY WORK
In order to simulate a common task for studying the user’s viewpoint in front of the screen, we performed a preliminary study investigating the clicked Graphical User Interface (GUI) target positions on conventional computer systems, as illustrated in Figure 3. Therefore, we evaluated the absolute 2-dimensional display coordinates of pointing device interaction on desktop computers during common office tasks over weeks.
Figure 3. Typical GUI targets on a screen
All participants of the study are research assistants. We informed them about logging the pointing interactions on
their workstations. The operating system on all test machines is Microsoft® Windows® XP with standard settings of the taskbar and text size. We distinguish between two hardware setups for participants using single or equal dual monitor systems. On the dual monitor systems, the main screen is shown on the left monitor. The average age of the 8 participants is 39.87; the median age is 41.5.
Figure 4. and Figure 5. show the normalized results of the click position probability distribution. The data set for the single screen system shows an almost uniform distribution of clicks in the center of the screen in both dimensions, with accumulations at the upper and left part of the screen and rectangular areas on the left and lower partition with few interactions. The accumulations correspond to the common widget structure of the Microsoft® Windows® XP GUI structure: A file-menu in the upper and a vertical scrollbar at the right area of the main application window. Moreover, in the lower screen section, the measurements show a pattern, which corresponds to the elements of the operating system’s taskbar, which is used to switch between the running programs. As shown in Figure 5. , the data sets for dual screen systems confirm this effect on each monitor separately, although the primary monitor is used more often. To describe the click coordinates independently, we model the pair-wise transition probability within the sequence of clicks: For a given certain click position, we deduce the probability of the successor click position. Due to the high resolution of today’s displays, the click transition function is not defined for each pixel, but for 100 equally sized partitions on the screen. The resulting function is expressed in a matrix: Each row defines the transition probability from a source to all possible sink partitions of the click transition. We will use this data for the target’s transition function to simulate the target behavior of common office tasks in our main user study, which we present in the next section. IV.
Figure 4. Click positions on a single screen setup
Figure 5. Click positions on a dual screen setup.
CONTRIBUTION
In order to use a model predictive control for correcting the parallax error, the user’s position in front of the screen has to be modeled. Therefore, two characteristics of the user are considered: his position and his movement in front of the screen for discrete time steps. We shall answer the question of the user’s typical position and where he will probably move in the next time-step ti+1 step relative to the current position at ti. To set up a model that matches the user’s behavior closely, we performed a user study, which tracked the position of the user’s head (viewpoint) in front of a large digital whiteboard. Since the viewpoint depends on the position of the aimed widget element (e.g. GUI button) on the screen, we set up the task for this study based on empirical results of typical click positions for common everyday jobs in window applications derived from the preliminary user study. The average age of the 12 male and 2 female participants is 32.5. Their median age is 30. The average (medium) height is 179 (183) mm. Two test persons were left-handed and 1 of the test candidates wore glasses. We did inform the participants about how to interact with the hardware system and the task, which is described below. We also informed them about tracking their heads during performing the given task. A. Test Setup (Hardware and Software) The user study was performed while standing in front of a vertically mounted 65” interactive surface with an offset of approximately 7 mm between image and interaction plane
and located 950 mm above the ground. The system is equipped with a flat panel overlay from SMART Tech. to track user inputs. It is mounted on top of the LC-display. The system is capable of tracking a set of pens and an eraser, as well as the user’s finger. The tracking position is forwarded to the operating system as pointing device coordinates. Hence, the overlay can be used to control any GUI application. To track the user’s head continuously, a low-cost 3D tracking system was developed. Two Wiimotes (Nintendo Wii Remotes) [12] track a set of active IR-markers, which are attached to the user’s head. As shown in Figure 6. , the 3D position of the user’s viewpoint is triangulated, combining separate information of detecting the user on a straight line that goes through the position of the camera of the Wiimote and the camera’s image plane. The tracking setup covers the working area in front of the interactive display. Since the system interaction on the interactive screen is limited by the user’s arm length (95% of human men (women) between 662 and 787 (616 and 762) mm [DIN33402]), the tracking area is limited to two times the maximum arm length plus the display width times the arm length (distance to the display) times the user’s height (95 % of men (women) between 1629 and 1841 (1510 and 1725) mm). The tracking system captures the user’s position continuously with an update frequency of approximately 10 Hz.
B. Task The user’s task is to stand in front of the digital whiteboard, trying to hit a button that continuously appears on different positions on the screen. After hitting the button, the button changes its position and the process starts over. If the user misses the button, nothing happens. In the process, the user is told to move freely in front of the screen while looking at the screen. The typical task duration (measurement acquisition time) is 5 minutes. The user’s viewpoint is not only biased by his characteristics (height and arm length), it also depends on the position of the actually aimed widget element on the screen. And these targets are primarily defined by the application specific dialogue design. To cover a large field of applications, we implemented a full screen GUI application that simulates common office tasks by sampling a sequence of targets from the prior defined transition probability distribution of the positions on the screen. The distribution is derived from a long-term study, logging the position of pointing device clicks on desktop computers in an office environment (see section III ). Hence, the resulting parallax error controller adapts best to daily business office tasks. C. Measurement Results In this section, we discuss two characteristics of the user’s behavior. First, we analyze the measurements of the user’s absolute position. Second, we analyze the relative movement of the user for different time intervals. We refer the dimensions as follows: The x-dimension is the horizontal dimension parallel to the surface of the screen, increasing to the right; the y-dimension is the vertical axis parallel to the screen increasing to the floor; and the z-dimension is defined to be orthogonal to the screen, decreasing with the distance to the screen. The origin is defined to be at the upper left corner of the display. The screen size is 1480 x 800 mm.
Figure 6. Head tracking area in front of the interactive screeen (topview)
The test application representing the user’s task (see Figure 7. ) is implemented in Python using the Qt GUI Library on a Linux system running an X-Server.
Figure 8. Head tracking trace in front of the digital screen Figure 7. Screenshot of the application simulating the click targets
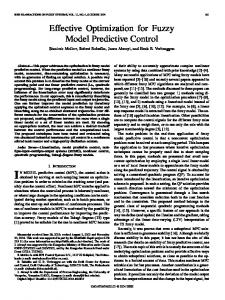
Figure 8. shows a short linearly interpolated trace of the user’s viewpoint position in front of the rectangular screen. The analysis of the absolute position of the user’s head, shown in Figure 9. ,indicates that the user’s horizontal
position is typically in the middle section of the screen, covering around 70%. The vertical position corresponds to the height distribution of the test persons, and leads to the assumption, that the users do hardly move in this direction. The distance to the screen (z-dimension) is approximately a Gaussian distribution around the mean distance of 600 mm (see Figure 9. (b)). We shall deepen the analysis of this property in the next section.
D. User Model Based on the measurement results presented in the previous section, we now describe how to generate the transition model for the parallax error controller. Since we investigated the user’s motion within discrete time steps, the user is also discretely modeled, following the histograms in the previous section, and thus depending on the accuracy of the controller’s adaption. The model contains two parts: The absolute position of the user, which gives an upper bound to the movement of the user, and a movement model. The model of the absolute position can be directly transformed into a discrete model, as described in [7]. To set up the movement model, the measurement data has to be adjusted to the sampling frequency, depending on the update frequency of the planner’s observations (user interaction). V.
CONCLUSION
In this paper, we presented two user studies to set up a discrete model that describes the user’s behavior in front of interactive surfaces. It covers the position and the movement of the user. The study results are used to generate a model for a controller that uses predictive control to compensate the parallax error in a non-myopic way, since the parallax correction has to be set up for the future viewpoint of the user. VI.
Figure 9. Users viewpoint position in front of the screen (a): horizontal movement; (b): distance to the screen
In addition to the absolute position of the users in relation to the screen, we analyzed their movements, which describe the change of position within a certain timeframe. Since the parallax controller [7] sets the correction parameter based on the assumed viewpoint, which is deduced from the screen interactions (observations), the user’s movement has to be modeled correspondingly: The average interaction rate during the study is 1.13 Hz. Hence, we evaluate the user’s movement within 5.1 and 0.1 seconds. The data for a timeframe of 1 second is illustrated in Figure 10. .It is based on the same unit as the first one. In this case, zero means ‘no movement’. As we already assumed from the absolute position measurements, the test persons move very little in the vertical dimension (y) within 1 second, but they move along the horizontal axis (Figure 11. (a)), although the peak clearly indicates the inertia of the motion. Compared to the movement within a 5 seconds timeframe (shown in Figure 10. ), the user does move less in each direction, which is intuitively clear. This trend of less movement within shorter timeframes continues up to the full sampling rate of 10 Hz.
OUTLOOK
Modeling the user is essential to apply predictive control to correct the parallax error as described in [7]. But since the controller makes assumptions about the user’s viewpoint based on observations (user’s pointing accuracy for certain targets at the screen), the correlation between observation and the user’s position has to be formulated more in detail. Therefore, a user study has to measure the viewpoint, the target position on the screen and the resulting pointing accuracy. Since the accuracy may depend on the size and shape of the target, the test application has to be extended [6]. Defining the user’s behavior and its correlation to the accuracy of the user’s interaction will allow implementing the controller as POMDP [3]. The framework allows defining models without any assumptions to the probability distribution. VII. ACKNOWLEDGEMENTS We thank Claudio Giovanoli for setting the Wii tracking system, and all our colleagues and students who participated in the user studies.
Figure 10. Histogram of the user’s movement in front of the screen within 5 seconds
Figure 11. Histogram of the user’s movement in front of the screen within 1 second [9]
REFERENCES [1]
[2] [3]
[4]
[5]
[6]
[7]
[8]
A. Kunz, and Fjeld, M. “From Table-Systems to Table-top: Integrating Technology into Interactive Surfaces,” Müller-Tomfelde, C. (Eds.): Tabletops – Horizontal Interactive Displays, pp. 53-72, Springer Verlag, 2010 E.F. Camacho, and C. Bordons, “Model predictive control,” Springer Verlag, 2004 L.P. Kaelbling, M.L. Littman, and A.R. Cassandra, “Planning and acting in partially observable stochastic domains,” Artificial Intelligence, Elsevier, vol. 101, pp. 99-134, 1998 M. Haller, D. Leithinger, J. Leitner, T. Seifried, P. Brandl, J. Zauner, and M. Billinghurst, “The shared design space,” Proceedings of SIGGRAPH’06: ACM SIGGRAPH 2006 Emerging technologies. ACM Press, NY, pp. 29, 2006 P. Dietz, and D. Leigh, “DiamondTouch: a multi-user touch technology,” Proceedings of the 14th annual ACM symposium on User interface software and technology, ACM Press, NY, pp. 226. 2001 J. Kong, and X. Ren, “Calculation of Effective Target Width and Its Effects on Pointing Tasks,” Transactions of Information Processing Society of Japan, pp. 1570-1572, 2006 W. Zhang, L. Wu, J. Liu, “Research and Application of Matrix Transformation in Position Calibration,” Fourth International Conference on Computer Sciences and Convergence Information Technology, 2009 T. Inoue, Y. Sakamoto, K. Shimohashi, M. Toyota, “Correcting Coordinates on Touch Panel to True Display Coordinates,” United States Patent Allocation Publication No. 2009/0046079 A1, 2009
[10]
[11]
[12]
[13]
[14]
[15]
[16]
J.C. Kent, and R.J. Warmack, “Method and apparatus for Laplace constrained touchscreen calibration,” United States Patent Allocation Publication No. 2009/0109195 A1, 2009 Wu Hong-Ping, and Ge Hai-jiang, “Calibration algorithm of touch screen based on BP neural network,” Mechanical & Electrical Engineering Magazine, 2009 B. Migge, T. Schmidt, and A. Kunz, “POMDP Models for Continuous Calibration of Interactive Surfaces,” 2010 AAAI Spring Symposium, Embedded Reasoning: Intelligence in Embedded Systems, AAAI Press, pp. 86-92, 2010 J.C. Lee, “Hacking the Nintendo Wii Remote”, IEEE Pervasiv Computing, IEEE Computer Society, New York, vol. 7, pp. 39-45, 2008 V.N. Dao, K. Hosoi, and M. Sugimoto, “A semi-automatic realtime calibration technique for a handheld projector,” Proceedings of the 2007 ACM Symposium on Virtual Reality Software and Technology, November 05-07, CA, pp. 43-46, 2007 Lee, J.C., Dietz, P.H., Maynes-Aminzade, D., Raskar, R. and Hudson, S.E. Automatic projector calibration with embedded light sensors. In: Proceedings of the 17th annual ACM symposium on User Interface Software and Technology. 2004. pp 123-126 C. Ganser Schwab, A. Steinemann, R. Hofer, and A. Kunz, “InfrActables: Supporting Collocated Group Work by Combining Pen-Based and Tangible Interaction,” Proceedings of Tabletop 2007, Newport, 2007 R. Hofer, A. Kunz, and P. Kaplan, “MightyTrace: Multiuser Tracking Technology on LC-displays,” Proceeding of the twenty-sixth annual SIGCHI conference on Human factors in computing systemsFlorence, Italien, ISBN 978-1-60558-011-1, Seiten 215-218, 2008