IEEE TRANSACTIONS ON FUZZY SYSTEMS, VOL. 12, NO. 5, OCTOBER 2004
661
Effective Optimization for Fuzzy Model Predictive Control Stanimir Mollov, Robert Babuˇska, Janos Abonyi, and Henk B. Verbruggen
Abstract—This paper addresses the optimization in fuzzy model predictive control. When the prediction model is a nonlinear fuzzy model, nonconvex, time-consuming optimization is necessary, with no guarantee of finding an optimal solution. A possible way around this problem is to linearize the fuzzy model at the current operating point and use linear predictive control (i.e., quadratic programming). For long-range predictive control, however, the influence of the linearization error may significantly deteriorate the performance. In our approach, this is remedied by linearizing the fuzzy model along the predicted input and output trajectories. One can further improve the model prediction by iteratively applying the optimized control sequence to the fuzzy model and linearizing along the so obtained simulated trajectories. Four different methods for the construction of the optimization problem are proposed, making difference between the cases when a single linear model or a set of linear models are used. By choosing an appropriate method, the user can achieve a desired tradeoff between the control performance and the computational load. The proposed techniques have been tested and evaluated using two simulated industrial benchmarks: pH control in a continuous stirred tank reactor and a high-purity distillation column. Index Terms—Linearization, model predictive control, multiple-input–multiple-output systems (MIMO), nonlinear control, quadratic programming, Takagi–Sugeno fuzzy models.
I. INTRODUCTION
I
N MODEL predictive control (MPC), the control action is obtained by solving at each sampling instant an optimization problem in order to minimize the tracking error (and possibly also the control effort). Nonlinear MPC must be applied in situations where the controlled process is inherently nonlinear, or where large changes in the operating conditions can be anticipated during routine operation, such as in batch processes, or during the start-up and shutdown of continuous processes. The use of nonlinear models in MPC is motivated by the possibility to improve the control performance by improving the prediction accuracy. Fuzzy models of the Takagi–Sugeno (TS) type [1] proved to be suitable for the use in nonlinear MPC because
Manuscript received June 28, 2001; revised August 2, 2002 and November 20, 2003. This work was supported in part by the FAMIMO Esprit project LTR 219 11 (for more information see http://iridia.ulb.ac.be/~famino). The work of J. Abonyi was supported by the Hungarian Ministry of Education under Grants FKFP-0073/2001 and 0063/2000, and by the Hungarian Research Fund under Grant OTKA T037600. S. Mollov is with FCS Control Systems B.V., 1117 ZJ Schiphol, The Netherlands (e-mail:
[email protected]). R. Babuˇska and H. B. Verbruggen are with the Delft Center for Systems and Control, Delft University of Technology, 2628 CD Delft, The Netherlands (e-mail:
[email protected]). J. Abonyi is with the Department of Process Engineering, the University of Veszprém, Veszprém H-8201, Hungary (e-mail:
[email protected]). Digital Object Identifier 10.1109/TFUZZ.2004.834812
of their ability to accurately approximate complex nonlinear systems by using data combined with prior knowledge [2]–[4]. Many successful applications of MPC using fuzzy models have been reported [5]–[10] and recently several papers appeared in which different fuzzy MPC algorithms are analyzed and compared; see [11]–[13]. The methods discussed in these papers can generally be classified into two groups: 1) methods using directly the fuzzy model in the optimization procedure [7]–[9], [12], [13], and 2) methods using a linearized model instead of the fuzzy one [5], [6], [10], [12]. For example, in [6], a linear step response model is extracted from the fuzzy model. The authors of [10] applied Jacobian linearization. Other possibilities are to compute the control signals for the different fuzzy rules separately and to weigh them, or to use only the rule with the largest membership degree [5], [12]. The main problem in the real-time application of fuzzy model predictive control is that a nonconvex optimization problem must be solved at each sampling period. This hampers the application to fast processes where iterative optimization techniques cannot be properly used due to short sampling times. In this paper, methods are presented that avoid nonconvex optimization by employing a single local linear model or a set of local linear models to approximate the fuzzy model along the predicted trajectory. The control signal is obtained by solving a constrained quadratic program (QP). To account for errors introduced by the linearization, an iterative optimization scheme is proposed. In such a setting, the QP solution provides a search direction toward the minimum of the optimization problem. Convergence is guaranteed through a line search mechanism that considers reduction both in the cost function and in the constraints. The proposed method belongs to the general class of sequential quadratic programming methods [14], [15]. However, a specific feature of our approach is the way we define (and update) the Hessian and the gradient, taking advantage of the linear time-varying (LTV) interpretation of the TS fuzzy model. Recently, it was proven that even a suboptimal MPC solution is sufficient to guarantee stability [16]. Although we briefly discuss stability in this paper, it has not been the aim of this research (for details on stability of fuzzy predictive control, see [17]). The main topic of this article is to study the structure of the underlying optimization problem and to provide effective ways to obtain suboptimal solutions, as close as possible to the optimum in a limited amount of time. This makes nonlinear MPC suitable also for fast processes. Another contribution is a generalized formulation of the cost function used in the optimization problem. It penalizes not only the deviation of the model output from the output reference and the change in the input signal, but
1063-6706/04$20.00 © 2004 IEEE
662
IEEE TRANSACTIONS ON FUZZY SYSTEMS, VOL. 12, NO. 5, OCTOBER 2004
also the variation in the predicted output and the deviation of the control input from an input reference. The paper is organized as follows. Section II introduces the necessary background material, namely: 1) the multivariable Takagi–Sugeno (TS) fuzzy model, 2) the extraction of a linear state-space model in the controllable canonical form from the TS model, 3) the formulation of the optimization problem in the MPC based on LTV state-space models, and 4) the internal model control scheme. The methods for obtaining local linear models from the fuzzy model are introduced in Section III. To ensure convergence of the iterative optimization methods, a line search mechanism is given in Section IV. Sections V and VI present two simulation benchmarks: pH control in a continuous stirred tank reactor and purity control in a binary distillation column. Section VII concludes this paper. Detailed derivations of the Hessian and gradient of the Lagrange function based on linear time-varying models are given in the Appendix.
is the product where the degree of fulfillment for the th rule of the membership degrees of the antecedent variables (states and inputs) in that rule (4)
B. Fuzzy Model Linearization for Predictive Control The TS model (2) can be locally represented by a state-space LTV model in the controllable canonical form
(5) To arrive at this representation, we express the model output (3) in the from (6)
II. FUZZY MODEL PREDICTIVE CONTROL A. Multivariable TS Fuzzy Model inputs: Consider a MIMO system with and outputs: . This system is approximated by a collection of coupled multiple-input–single-output discretetime fuzzy models of the input–output NARX type
The input vector the regression vector outputs and inputs:
contains the current inputs, and includes current and lagged
Comparing this expression with the LTV description (5), one contains the regression vectors can see that the state for the individual outputs. The elements of are ordered come such that the lagged outputs from all , first and then come the lagged inputs. We construct the matrices , and by freezing the parameters of the fuzzy model at a certain operating point and as follows. acFirst, calculate the degrees of fulfillment cording to (4) and compute the aggregated parameters , , and
(1) with (7)
where and specify the number of lagged values for the th output and the th input, respectively. are rule-based fuzzy models of the TS type [1] If
is is
and and
and and
is is
and
The state matrix contains the parameters and and the input matrix the parameters in the order reflecting . Additional columns are inthe structure of the state vector serted in in order to account for the lagged outputs and inputs. The last column of contains the offset for the corresponding output
then (2) are the antecedent fuzzy sets of the th rule, and Here, are vectors containing the consequent parameters, and is the offset. is the number of rules for the th output. The model output is computed as the weighted average of the linear consequents in the individual rules (3)
.. .
.. .
.. .
.. . .. .
.. .
.. .
.. .
..
.. .
.. .
.. .
.. .
.. .
.. .
. ..
.
.. .
(8a)
MOLLOV et al.: EFFECTIVE OPTIMIZATION FOR FUZZY MPC
663
and the .. . .. .
.. .
,
, and
matrices are
.. . ..
..
.
..
.
.
(8b)
.. .
..
.. .
.
(8c)
Example: A 2 2 fuzzy model is given as an example to illustrate this procedure. The considered rules for the two outputs are If
is
and
is
and
is
and
is
and
is
and
is
then C. Relation to Jacobian Linearization Note that the aforementioned linearization method differs from the standard Jacobian linearization.1 Recall the input–output representation of the TS fuzzy model (3)
If
is
and
is
and
is
and
is
and
is
and
is
then (9) where
For a given operating point , are first computed by using (4) and the degrees of fulfillment the parameters , and by using (7). The model outputs are then
is the normalized degree of fulfillment and
is the linear model of the th fuzzy rule. Applying the Jacobian linearization to (9), we have
The state, input, and output vectors for the state-space description are
1The application of Jacobian linearization to TS fuzzy models is discussed, among others, in [18].
664
IEEE TRANSACTIONS ON FUZZY SYSTEMS, VOL. 12, NO. 5, OCTOBER 2004
Comparing this result with (6) and (7), one can see that the terms containing the derivatives of the membership functions (degrees of fulfillment) are missing in these expressions. Thus, we can conclude that rather than a variant of the standard linearization, our approach is parameter scheduling that relies on the assumption that the individual rules of the TS model are good local linear models of the system. The linear parameter-varying model obtained at each operating condition then “tracks” the nonlinear process dynamics in a way similar to using a linear adaptive model to track nonlinear dynamics. This is in contrast with the “global approach,” where the fuzzy rules typically do not have any local interpretation and the emphasis is on the global approximation accuracy. For the global approach, the standard Jacobian linearization would be more appropriate. For more details, see [18] and [19]. A clear advantage of our approach is that the (possibly time-consuming) computation of the membership function derivatives is avoided.
the control signal [20], hence, the aforementioned constraints can be written as (11) where is the total number of constraints. The exact form of will be given in the sequel. Given the optimization problem (10) and (11), and seeking , the idea is to formulate a QP the optimal control, sub-problem based on a second-order approximation of the Lagrangian function (12) If the optimization problem is a convex programming problem, i.e., and , are convex functions, then the Kuhn–Tucker equations (13)
D. Optimization in Predictive Control The considered predictive controller computes an optimal control sequence with respect to the following cost function:
(10) Here, is the output predicted by the fuzzy model, is the output increment, and are the output and input references, and are the control signal and its increment, respectively, represents the inner-product norm. The parameters and , and are the prediction, control and minimum cost horizon, respectively, over which the optimization is carried out. , , and determine the relative imThe weights , portance of the different terms in the cost function. Note that in addition to the standard terms, this cost function also includes the variation in the predicted output and the deviation of the control input from an input reference (the second and third terms). By limiting the variation in the predicted output by penalizing it in the cost function rather than by hard constraints, one can avoid infeasibility of the optimization problem. Similarly, the weighting of the deviation of the control input from an input reference provides a certain flexibility of the control signal as opposed to the use of hard constraints. The inputs and outputs are subject to (time-varying) level and rate constraints
where and . The output constraints can be transformed into constraints on
are the necessary and sufficient conditions for the attainment of a global optimum [21]. The previous equation describes the cancellation of the gradients between the cost function and the at the solution point . For the gradiactive constraints ents to be canceled, the Lagrange multipliers are necessary to balance the deviations of the gradients in magnitude. Since only active constraints are included in this canceling operation, the remaining Lagrange multipliers are zero. If we use the nonlinear TS model, however, the cost function is nonconvex with respect to the control signal. For the resulting optimization problem, the KT equations are then only necessary but not sufficient to guarantee that a global minimum is attained. With the method we propose, the optimization problem is approached in a different manner. Instead of linearly approximating the gradient and the Hessian of the Lagrangian function, we approximate the original fuzzy model through the LTV model (8). The gradient and the Hessian of (12), are updated at each iteration through a quasi-Newton approximation, and are used in a QP sub-problem whose solution forms the search direction. Using the LTV model (8), we can apply the results from linear MPC [22] to get a direct (not approximated) expression for the gradient and the Hessian of (12). The convergence of the optimized control sequences to the optimal one is guaranteed through the line search routine considering reduction both in the cost function and in the constraints [23]. This line-search routine is presented in Section IV. Let the fuzzy model be locally represented by the LTV model (5). To ensure offset-free reference tracking, the optimization problem is defined with respect to the increment in the control , rather than the control signal . The state-space signal, description is extended correspondingly
(14)
MOLLOV et al.: EFFECTIVE OPTIMIZATION FOR FUZZY MPC
665
(15) For the sake of simplicity, in the sequel we drop the bars from this extended state-space description. Assuming that at time instant , the state vector and the future control sequence are known, the future process outputs can be predicted through successive substitution. The complete output sequence over the pre) is given by diction horizon (for
.. .
.. .
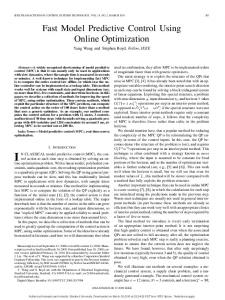
Fig. 1. Fuzzy model predictive control scheme.
(16) where
.. .
The advantage of the such posed optimization problem is that now the and can be derived in a straightforward way, as it is shown in Appendix A, where all the remaining matrices in (19) are also defined. E. Internal Model Control Scheme
and is given at the bottom of the page. Given the LTV model (15), the constrained linear MPC (10), (11) is solved as the following QP: (17) subject to input and output constraints transformed into constraints on the input increment
To compensate for the disturbances acting on the process, measurement noise and model-plant mismatch, the internal model control (IMC) scheme [24] is applied (Fig. 1). This scheme guarantees nominal stability when the model-plant mismatch can be neglected. For a significant model-plant mismatch, stability can be guaranteed by imposing additional constraints on the control signal [17]. III. METHODS FOR OBTAINING LINEAR MODELS
(18) The Hessian and the gradient of the Lagrangian function (12), are expressed in terms of the LTV model parameters
The basic idea is to use the fuzzy model to predict the future process behavior. LTV models are then derived around the obtained input and output trajectories. Fig. 1 presents the flow diagram of the fuzzy model predictive controller. Denote by and some general input and output and the model trajectories, and by specific trajectories computed by the linear predictive controller. th Further denote the LTV model (5) obtained at the , and the set step by extracted along the trajectories and by of models . Depending on the way is obtained, several approaches can be distinguished. Generally, they can be classified into two groups: noniterative and iterative methods. A. Noniterative Methods
(19)
.. .
..
.
In the noniterative methods, a single local model or a set of local models, obtained at the current time instant , is used in
.. .
666
the quadratic program (15)–(18) and the obtained QP solution is directly applied to the controlled process. 1) Single-Model (SM) Method: The model set contains a single linear model , extracted at the operating point . This model is used throughout the entire prediction horizon. Even if this model is very accurate at the linearization point, its accuracy decreases over the prediction horizon. As a consequence, there may be a significant predic. To reduce the error, a set of local linear tion error at models can be extracted from the fuzzy model along the trajec. This is the basis tories found at the previous time instant of the multimodel (MM) method. 2) Multiple Models Based on the Trajectory Computed at the and be Previous Sampling Instant: Let the input and output sequences obtained by optimization at time and by subsequent simulation of the nonlinear fuzzy step model
We use this information to approximate the yet unknown input and output sequences at time by shifting the elements one step forward and replicating the last element
The local linear models, extracted from the fuzzy model along are then used to construct the quadratic programme and to compute . In this way, the prediction error is reduced. Note, however, that this method is superior to the SM method only if the fuzzy model is accurate enough. B. Iterative Methods With the noniterative methods, the performance still may be suboptimal due to the fact that the control sequence, along which the fuzzy model is linearized, is from the previous time step. To improve the performance, iterative methods can be introduced, in which the optimized control sequence is not directly applied to the process, but it is first used to simulate the fuzzy model. The resulting model outputs (and the control inputs) then provide more accurate trajectories along which a new set of local models are obtained and the whole procedure is iteratively repeated. 1) Iterative Version of the SM Method: In the first iteration, is obtained at . This a linear model . Thereafter, in the following model is used to compute iterations, is used as the linearization point (see Fig. 2). To further reduce the error, a set of local linear models can be extracted from the fuzzy model along the trajectories in an iterative manner. This is the basis of the following iterative MM method. 2) MM Method: Rather than using a single model over the whole prediction horizon, separate models are employed for
IEEE TRANSACTIONS ON FUZZY SYSTEMS, VOL. 12, NO. 5, OCTOBER 2004
Fig. 2.
Linearization points within the prediction horizon.
each step within the prediction horizon. The algorithm is summarized as follows. 1) Use the already obtained linear model and compute for the whole prediction horizon. the control sequence 2) Simulate the fuzzy model over the prediction horizon. 3) Linearize the fuzzy model along the predicted trajectory and obtain . to compute a new control sequence for the 4) Use whole prediction horizon. Again, this method should be used only if the fuzzy model is accurate enough, otherwise the iterative version of the SM method generally gives better results. Although, according to the receding horizon principle, only the first control action is applied to the process, the complete sequence is available. This can be used to initialize this iterative routine at the next sampling instant, starting from a point close to the optimum. Table I summarizes how the linear models are obtained from the fuzzy model by the different methods. IV. LINE SEARCH The iterative optimization methods account for errors introduced by the linearization. In such an iterative optimization, the QP solution provides a search direction toward the minimum of the optimization problem. To guarantee convergence, the following line search mechanism is used that considers reduction both in the cost function and in the constraints. In the following, index denotes the th element of a vector and index the th iteration. be the QP solution (Section II-D) in th iteration at Let time instant . To provide a convergence mechanism, we use for for
(20)
where is the step length, chosen by a line search routine to give a reduction in the merit function proposed in [23]
(21)
MOLLOV et al.: EFFECTIVE OPTIMIZATION FOR FUZZY MPC
667
TABLE I METHODS FOR OBTAINING LOCAL LINEAR MODELS. IN THE ITERATIVE METHODS THESE LOCAL LINEAR MODELS ARE OBTAINED FROM THE FUZZY MODEL IN EACH ITERATION ALONG THE CORRESPONDING SEQUENCES Y (k ) AND U (k )
where cording to
is a vector of positive parameters, updated ac-
(22) with being the Lagrangian multipliers for the current QP solution. This allows positive contributions from constraints that are inactive in the QP solution, but were recently active. The penalty parameter is initially set to (23) where represents the Euclidean norm. This results in larger contributions to the penalty parameter from constraints with smaller gradients, which would be the case for active constraints at the solution point. be the first element in a monotonically deLet creasing sequence . Then, it can be proven [23] that the line-search method generates a sequence whose limit is the Kuhn–Tucker point of the optimization problem (15)–(18). The line search routine is summarized as follows. 1) In the first iteration, is initialized according to (23), otherwise, it is modified according to (22). and the constraints 2) The cost function , are calculated. The merit is split into two parts, looking for function , and the conimprovements in the cost function, straints
Fig. 3.
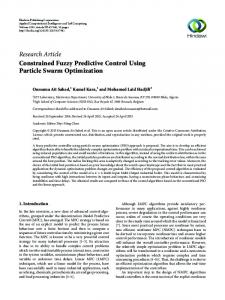
Continuous stirred tank reactor.
while and and NOT maxiterations update the step length update the solution update the cost function update the constraints and take max
update if elseif else
and then then
end loop The introduction of the line search routine, however, as reported by [23] may decrease the convergence rate. The situawhich gives superlinear convergence in (20) is not tion always allowed by the merit function (21). V. APPLICATION TO A pH PROCESS A. Process Description
3) The step length
is set to , and . 4) Loop wherein the step length is reduced until improveor is achieved or the maximum ment in either number of iterations is reached.
The control of the pH (the concentration of hydrogen ions) in a continuous stirred tank reactor (CSTR) is a well-known benchmark problem that presents difficulties due to the nonlinearity of the process dynamics [25]. The CSTR, given in Fig. 3, has two input streams, one containing sodium hydroxide and the other one acetic acid. The acid neutralizes sodium hywhich flows into the reactor at a droxide of concentration
668
IEEE TRANSACTIONS ON FUZZY SYSTEMS, VOL. 12, NO. 5, OCTOBER 2004
TABLE II PARAMETERS USED IN THE CSTR SIMULATION STUDY
rate . The volume of the reactor is constant and equal to . The variable of interest is the concentration of hydrogen ions, of the outlet stream, which can be pH, expressed by (24), as shown at the bottom of the page. The parameters used in the simulation are given in Table II. For simplicity the acetic acid stream, , is considered to be constant at its nominal value. Thus, we end up with a singleinput–single-output process with the sodium hydroxide stream as input and the pH as output.
Fig. 4.
CSTR: Membership functions.
B. Fuzzy Modeling A TS fuzzy model is obtained from simulated input-output data through fuzzy clustering-based identification [26]. A samis used. A first-order fuzzy model with pling time one sample time delay in the input appeared to give satisfactorily results. Three fuzzy IF–THEN rules are used 1) If then 2) If then 3) If then
is LOW and is is
is LOW and
and
Fig. 5. CSTR: Validation of the fuzzy model (solid line: process output, dashed line: model prediction).
is is (25)
with piecewise exponential membership functions if
indices are used: The root mean square (rms) error and the variance accounted for (VAF), in %. For the validation data, the oband . For a tained measures are comparison, a linear model has correspondingly , on the same validation data set, thus the fuzzy model is significantly more accurate than the linear one. C. Controller Configurations
if otherwise. The values of the left and right shoulders ( , ) and the left and right widths ( , ) can be seen in Fig. 4. The performance of the model for an validation data set is shown in Fig. 5. To give a quantitative measure of the model accuracy, two performance
Four different controller configurations are used to illustrate the performance of the optimization methods. 1) Linear MPC using a model obtained by Jacobian linearization of the nonlinear process model at ( and ). 2) SM method (Section III-A.1). 3) MM method (Section III-B.2).
(24)
MOLLOV et al.: EFFECTIVE OPTIMIZATION FOR FUZZY MPC
669
4) A nonlinear optimization method, referred to as Nlinear, that directly uses the fuzzy model. The MATLAB implementation of sequential quadratic programming (SQP) [27] is used. , All the methods use identical control settings: and . The acetic acid flow rate is kept at its nominal value, . The sodium hydroxide flow rate, , is subject to input level and rate constraints and , respectively. The and nonzero weights in the cost function (10) are ; the latter is used to prevent aggressive actions. D. State-Space Model Extraction To illustrate the extraction of a local linear state-space model from the fuzzy one, the first iteration in the MM controller (Section III-B.2) is outlined. The initial process input and output are and , respectively. The fuzzy . To obtain an initial linear model for model state is , the vector of the degrees of fulfillment is calculated according to (4):
Fig. 6.
CSTR: Convergence of the control sequence.
TABLE III CSTR: DIFFERENCES AMONG ON THE CONTROL SEQUENCES THROUGH THE ITERATIONS
These degrees of fulfillment are then combined then with the and by using (7) rules’ consequents in (25), to get ,
for which the local state-space models are
The corresponding matrices
and
for
and
are (14)
and . The obtained matrices are used in the quadratic program (17) and (18). The optimized control seis then applied to simulate quence the fuzzy model, in order to provide new linearizations points. The degrees of fulfillment, ’s, for the individual rules at these points are
This set of linear models again forms the quadratic program (17) and (18). Now, the . optimized control sequence is After three more iterations, the final control sequence is . The convergence of the optimized control sequence is shown in Fig. 6. The absolute differences among the control sequences computed in the individual iterations are rather small, but note that the range of is very narrow: . Therefore, the relative differences amount up to 40% (see Table III).
670
IEEE TRANSACTIONS ON FUZZY SYSTEMS, VOL. 12, NO. 5, OCTOBER 2004
TABLE IV RELATIVE PERFORMANCE OF THE DIFFERENT CONTROLLERS. THE LINEAR MPC IS TAKEN AS 100%
E. Performance Comparison For performance evaluation, two criteria are used to calculate the output and input variations. The output variation criterion , gives a quantitative measure how close the process output, , according to is to the reference
(26)
where is the length of the simulation experiment. The input variation criterion gives a measure of the energy in the process input
(27) The values of these performance indexes for the considered controllers are given in Table IV, taking the linear MPC as 100%. Note that a lower percentage means better performance. To asses the influence of the line search, the SM and MM performance is compared with and without the line search. As expected, the initial guess for the nonlinear optimization (Nlinear) turned out to be of crucial importance for the performance. A good initial guess can be obtained with the SM method (III-A.1); see “Nlinear and SM.” One can also use the linear MPC to provide such an initial guess; see “Nlinear and SM.” One can see that the SM and MM methods lead to a significant improvement in the performance criteria over the values achieved through the linear MPC. This improvement is, however, achieved at the expense of a higher computational load (FLOPS, floating point operations). The introduction of the line search slightly improves the controller performance. When the nonlinear fuzzy model is used in the optimization routine, the computational load is approximately four times higher than with the linear MPC and the performance is poor. However, if the control sequence, obtained through a single iteration with SM or linear MPC is used as an initial guess to the nonlinear optimization, a superior performance is achieved. Comparing this performance to the one obtained with MM, the improvement of about 10% is paid for with nearly 2.5 times as many FLOPS, which correspondingly increases the computing time. Fig. 7 depicts the process behavior for a part of the considered trajectory. When linear MPC is used, the process behavior is
Fig. 7. CSTR: Performance of the different controllers. Top: Linear MPC. Middle: Single-model MPC. Bottom: Nlin and SM MPC.
fairly oscillatory, while both SM and ; see Nlinear and SM. provide satisfactory performance with only a marginal superiority of the latter (achieved at the expense of a computational load approximately three times higher than with the SM method).
VI. DISTILLATION COLUMN A high-purity binary distillation column is used as a second benchmark example. The column has 39 trays, a reboiler and a condenser. The simulation model, developed by Skogestad [28] under the assumptions: 1) equilibrium on all trays, 2) total condenser, 3) no vapor holdup, and 4) linearized liquid dynamics, captures the most important dynamics of a real distillation column. The column operates in the LV configuration with being the manipulated the reflux and reboiler flows and variables and the top and bottom composition impurities and being the controlled variables.
MOLLOV et al.: EFFECTIVE OPTIMIZATION FOR FUZZY MPC
671
TABLE V CONSEQUENT PARAMETERS FOR THE FUZZY MODEL OUTPUT “TOP COMPOSITION IMPURITY” (y )
TABLE VI CONSEQUENT PARAMETERS FOR THE FUZZY MODEL OUTPUT “BOTTOM COMPOSITION IMPURITY” (x )
TABLE VII PI CONTROLLERS PARAMETERS
Fig. 8.
Membership functions for y
and x .
A. Fuzzy Modeling A fuzzy model was constructed through fuzzy clustering [26] using 8000 input–output data pairs sampled with the sampling time of 120 s. Since the process gain is related to the concentrations, the rule antecedents are defined on the domain of the product impurities. The order of the local models is set to . The rules for both outputs are given in (28), with the trapezoidal membership functions shown in Fig. 8, and the consequent parameters given in Tables V and VI, respectively. of the Each output is described by four fuzzy rules following form: If
is
and
is
then
Fig. 9. Fuzzy model validation. Solid line: validation data. Dashed line: model prediction.
The model performance on a validation data set is illustrated in Fig. 9. To give a quantitative measure of the model accuracy, the rms error and the variance accounted for (VAF) are com, for the top composition puted: and , for the bottom impurity . composition impurity B. Comparison of Controllers
If
is
and
is
Four different controllers are compared: two PI controllers (Table II), used in [29] and [30], respectively, and two predictive controllers using fuzzy models. Both predictive controllers , use the SM method (Section III-B.1). The horizons are , and the weighting matrices are , , , and . The following constraints on the inputs are used:
then
(28)
672
IEEE TRANSACTIONS ON FUZZY SYSTEMS, VOL. 12, NO. 5, OCTOBER 2004
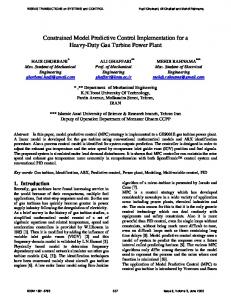
Fig. 10. Distillation column: control performance for varying feed rate and feed composition. Top: PI2 controller. Middle: Fuzzy predictive controller. Bottom: Fuzzy predictive controller with fuzzy model including the feed composition z . Left: Top composition impurity y . Right: Bottom composition impurity x .
TABLE VIII RELATIVE PERFORMANCE OF THE DIFFERENT CONTROLLERS. SKOGESTAD’S PI CONTROLLER PERFORMANCE IS TAKEN AS 100%
To make the control problem more realistic, both feed rate and feed composition are randomly varied as disturbances: and . The process behavior for the different controllers is presented in Fig. 10. PI1 (not shown in the figure) and PI2 have a similar performance, compared to which both predictive controllers are superior (Table VIII). To show how the quality of the model prediction influences the control performance, the second MPC uses a fuzzy model which has as (usually not measurable an input also the feed composition variable). Obviously, this leads to an improvement in the performance (Fig. 10).
VII. CONCLUDING REMARKS In this paper, we have proposed and compared methods for effective optimization in fuzzy model predictive control. A linearization approach is followed to construct a quadratic optimization problem, as opposed to other approaches from the literature that use a nonlinear process model directly in the optimization and an approximation is made of the cost function gradient and Hessian. Four methods for extracting single or multiple models along the predicted trajectory based upon the fuzzy model trajectory have been introduced. Two simulation benchmark examples were presented to illustrate the advantages and the drawbacks of the methods. For the first benchmark, a detailed comparison of the proposed MPC methods has been done, including a comparison with linear and nonlinear predictive control. The performance achieved by the proposed methods is comparable to the performance attained through properly initialized nonlinear optimization, for which, however, the computational load is considerably higher. The second benchmark shows an application to a multivariable system and a comparison with alternative controllers.
MOLLOV et al.: EFFECTIVE OPTIMIZATION FOR FUZZY MPC
673
APPENDIX DERIVATION OF THE HESSIAN AND GRADIENT OF THE LAGRANGE FUNCTION BASED ON LTV MODELS
The input sequence for the input level constraints (11) can be defined as
Assuming that at time instant both the state vector and the future control sequence are known, the future process outputs can be predicted through successive substitution
.. .
.. .
.. .
where gives
is an
.. .
..
.. .
.
.. .
(30)
identity matrix. Inserting (30) in (11)
The input rate constraints (11) are, respectively
where . The predicted output follows directly:
where is an identity matrix. The output level constraints (11) can be derived through the prediction (16)
(29)
.. .
(31)
.. .
..
.. .
.. .
.
(32)
..
.
.. .
(33)
674
IEEE TRANSACTIONS ON FUZZY SYSTEMS, VOL. 12, NO. 5, OCTOBER 2004
The output rate constraints (11) are also derived through (16), is not prealthough the expression is more involved. Since we have dicted but measured, for the prediction of
where the matrices and predicted outputs
and
are defined as . The constraints for the are
where and are given by (31) and (32), respectively. used in (19) is defined in (33) and , , The matrix and in (19) are block-diagonal matrices of suitable dimensions, where the diagonal blocks are respectively the weights , , and in the cost function (10); see (31)–(33), as shown at the bottom of the previous page.
REFERENCES [1] T. Takagi and M. Sugeno, “Fuzzy identification of systems and its application to modeling and control,” IEEE Trans. Syst., Man, Cybern., vol. SMC-15, pp. 116–132, Jan. 1985. [2] R. R. Yager and D. P. Filev, Essentials of Fuzzy Modeling and Control. New York: Wiley, 1994. [3] J. Zhao, V. Wertz, and R. Gorez, “A fuzzy clustering method for the identification of fuzzy models for dynamical systems,” in Proc. 1994 IEEE Int. Symp. Intelligent Control, Columbus, OH, Aug. 1994, pp. 172–177. [4] R. Babuˇska, J. A. Roubos, and H. B. Verbruggen, “Identification of mimo systems by input-output TS fuzzy models,” in Proc. FUZZ-IEEE’98, Anchorage, AK, 1998, pp. 657–662. [5] D. Saez and A. Cipriano, “Design of fuzzy model based predictive controllers and its application to an inverted pendulum,” in Proc. 6th IEEE Int. Conf. Fuzzy Systems, vol. 2, Barcelona, Spain, 1997, pp. 915–919. [6] B. K. Kavsek, I. Skrjanc, and D. Matko, “Fuzzy predictive control of a highly nonlinear pH process,” Comput. Chem. Eng., vol. 21, pp. S613–S618, 1997. [7] M. Fischer, O. Nelles, and R. Isermann, “Adaptive predictive control of a heat exchanger based on a fuzzy model,” Control Eng. Practice, vol. 6, no. 2, pp. 259–269, 1998. [8] , “Predictive control based on local linear fuzzy models,” Int. J. Syst. Sci., vol. 29, no. 7, pp. 679–697, 1998. [9] J. Q. Hu and T. Rose, “Generalized predictive control using a neurofuzzy model,” Int. J. Syst. Sci., vol. 30, no. 1, pp. 117–122, 1999. [10] J. Abonyi, L. Nagy, and F. Szeifert, “Fuzzy model based predictive control by instantaneous linearization,” Fuzzy Sets Syst., vol. 120, no. 1, pp. 109–122, 2001. [11] J. J. Espinosa, M. L. Hadjili, V. Wertz, and J. Vandewalle, “Predictive control using fuzzy models—comparative study,” in Proc. Eur. Control Conf., 1999, p. F0547. [12] H. N. Nounou and K. M. Passino, “Fuzzy model predictive control: techniques, stability issues, and examples,” in Proc. 1999 IEEE Int. Symp. Intelligent Control Intelligent Systems and Semiotics, 1999, pp. 423–428. [13] V. J. de Oliveira and J. M. Lemos, “A comparison of some adaptivepredictive fuzzy-control strategies,” IEEE Trans. Syst., Man, Cybern. C, vol. 30, pp. 138–145, Feb. 2000. [14] M. J. D. Powell, “A fast algorithm for nonlinearly constrained optimization calculations,” in Numerical Analysis, G. A. Watson, Ed. New York: Springer-Verlag, 1978, vol. 630, Lecture Notes in Mathematics, pp. 144–157. [15] B. N. Pshenichnyj, The Linearization Method for Constrained Optimization. Berlin, Germany: Springer-Verlag, 1994.
[16] O. M. Scokaert, D. Q. Mayne, and J. B. Rawlings, “Suboptimal model predictive controller (feasibility implies stability),” IEEE Trans. Automat. Contr., vol. 44, pp. 648–654, Mar. 1999. [17] S. Mollov, T. J. J. van den Boom, F. Cuesta, A. Ollero, and R. Babuˇska, “Robust stability constraints for fuzzy model predictive control,” IEEE Trans. Fuzzy Syst., vol. 10, pp. 50–64, Feb. 2002. [18] T. A. Johansen, R. Shorten, and R. Murray-Smith, “On the interpretation and identification of dynamic Takagi-Sugeno fuzzy models,” IEEE Trans. Fuzzy Syst., vol. 8, pp. 297–313, June 2000. [19] J. Abonyi and R. Babuˇska, “Local and global identification and interpretation of parameters in Takagi-Sugeno fuzzy models,” in Proc. FUZZIEEE, San Antonio, TX, 2000, pp. 835–840. [20] S. P. Boyd, C. Crusius, and A. Hansson, “Control applications of nonlinear convex programming,” J. Process Control, vol. 8, no. 5–6, pp. 313–324, 1998. [21] H. Kuhn and A. W. Tucker, “Nonlinear programming,” presented at the 2nd Berkeley Symp. Mathematical Statistics and Probability, Berkeley, CA, 1951. [22] C. E. García, D. M. Prett, and M. Morari, “Model predictive control: Theory and practice—a survey,” Automatica, vol. 25, no. 3, pp. 335–348, 1989. [23] M. J. D. Powell, “Variable metric methods for constrained optimization,” in Mathematical Programming: The State of the Art, A. Bachem, M. Grotschel, and B. Korte, Eds. New York: Springer-Verlag, 1983, pp. 288–311. [24] C. G. Economou, M. Morari, and B. O. Palsson, “Internal model control: extension to nonlinear systems,” Ind. Eng. Chem. Process Des. Dev., vol. 25, pp. 403–411, 1986. [25] T. J. McAvoy, E. Hsu, and S. Lowenthal, “Dynamics of pH in controlled stirred tank reactor,” Ind. Eng. Chem Process Des. Develop., vol. 11, no. 1, pp. 68–70, 1972. [26] R. Babuˇska, Fuzzy Modeling for Control. Norwell, MA: Kluwer, 1998. [27] T. Coleman, M. A. Branch, and A. Grace, Optimization Toolbox for Use With MATLAB. Natick, MA: The MathWorks, Inc., 1999. [28] S. Skogestad, “Dynamics and control of distillation columns. A tutorial introduction,” Chem. Eng. Res. Des. (Trans. IChemE), vol. 75, pp. 539–562, 1997. [29] S. Skogestad and I. Postlethwaite, Multivariable Feedback Control. Chichester, U.K.: Wiley, 1996. [30] C. T. Chou and M. Verhaegen, “An indirect approach to closed-loop identification of Wiener models,” in Proc. Amer. Control Conf., San Diego, CA, 1999, pp. 3456–2461.
Stanimir Mollov received the M.Sc. degree in control engineering from the Technical University of Sofia, Sofia, Bulgaria, in 1990, and the Ph.D. degree from the Delft University of Technology, Delft, The Netherlands, in 2002. Currently, he is with FCS Control Systems B.V., Schiphol, The Netherlands. His main research interests include multivariable (fuzzy) process identification and control.
Robert Babuˇska received the M.Sc. degree in control engineering from the Czech Technical University (CTU), Prague, Czech Republic, in 1990 and the Ph.D. degree from the Delft University of Technology, Delft, The Netherlands, in 1997. Currently, he is a Professor with the Delft Center for Systems and Control, Faculty of Mechanical Engineering, Delft University of Technology. He has coauthored more than 50 journal papers and chapters in books, and has published a research monograph Fuzzy Modeling for Control (Norwell, MA: Kluwer, 1998). His research interests include the use of fuzzy set techniques and neural networks in nonlinear system identification and control. Dr. Babuˇska is serving as an Associate Editor for the IEEE TRANSACTIONS ON FUZZY SYSTEMS and Engineering Applications of Artificial Intelligence, and as an Area Editor of Fuzzy Sets and Systems.
MOLLOV et al.: EFFECTIVE OPTIMIZATION FOR FUZZY MPC
Janos Abonyi received the M.Eng. and Ph.D. degrees in chemical engineering from the University of Veszprem, Veszprem, Hungary, in 1997 and 2000, respectively. Currently, he is an Assistant Professor with the Department of Process Engineering of the University of Veszprem. From 1999 to 2000, he was a Research Fellow at the Control Laboratory at Delft University of Technology, Delft, The Netherlands. His research interests include the applications of fuzzy systems, genetic algorithms, and neural networks in process engineering and data-mining. He has authored or coauthored the research monograph Fuzzy Model Identification for Control (Boston, MA: Birkhäuser, 2003), and more than 30 journal papers and chapters in books in these areas.
675
Henk B. Verbruggen received the M.Sc. degree in electrical engineering from the Delft University of Technology, Delft, The Netherlands, in 1963. Since 1963, he has been a Staff Member with the Control Engineering Laboratory at the Electrical Engineering Department, Delft University of Technology. In 1980, he was appointed a Full Professor. His research interests include model-based predictive control, fuzzy logic and neural networks for modeling, control, fault detection, and controller reconfiguration. He is the author and coauthor of more than 200 publications. He has served as Chairman of the Coordinating Committee on Computer Control of IFAC, as an Associate Editor of the IFAC journal Engineering Applications of AI, and as Area Editor of Fuzzy Sets and Systems. He has been involved in a number of EC-sponsored research projects and working groups.