Sep 1, 2010 - a user's guide ...... environmental impacts from proposed operation. ..... measurements from at least one site in each catchment will provide ...
A framework for predicting and managing water quality impacts of mining on streams: a user’s guide
JE Cavanagh1, J Pope2, JS Harding3, D Trumm2, D Craw4, R Rait2 H Greig3, D Niyogi3, R Buxton1, O Champeau1, A Clemens2
1
Landcare Research
2
CRL Energy
3
School of Biological Sciences, University of Canterbury
4
School of Geological Sciences, University of Otago
Version 2 October 2010
© Landcare Research New Zealand Ltd 2010
ii
Acknowledgements The framework has been developed by the research team (Landcare Research [as Contract Report LC0910/114], CRL Energy [CRL Report 10-41100], Universities of Canterbury and Otago) in conjunction with end-users including the Department of Conservation, the West Coast Regional Council, Environment Southland, Solid Energy, OceanaGold, Pike River Coal, Francis Mining and a number of consultants. During formulation of this framework the research team held several workshops and we thank the participants at Mine Drainage workshops held in Invercargill (2009), Greymouth (2008), and Westport (2006) for helping shape the framework. Paul Webber (Solid Energy), Ivan Liddell (Pike River Coal), Matthew Morgan (Solid Energy), Tim Mulliner (URS), Kris Hemlein (Golder Associates), Collin Dall (West Coast Regional Council), Jo Stratford and Craig Jones (Department of Conservation) and Amanda Black (Lincoln University) provided comments on earlier drafts.
iii
Executive summary Coal and gold mining are important economic activities in New Zealand, and the West Coast of the South Island and Southland, for example, have long histories of mining. The process of mineral extraction inevitably results in environmental impacts, but few tools exist to help mining companies and regulators assess and predict environmental impacts of mining operations. This framework has been developed as part of a collaborative research programme with key mining partners to assist with planning of future mine developments on the West Coast and in Southland. This framework focuses on water quality issues associated with coal and gold mining, specifically pH, metals and, to a limited extent, suspended solids. It draws together research on rock geochemistry, aquatic chemistry, freshwater ecology, aquatic toxicity, and management and treatment techniques for mining to provide a process for data collection and decision making. The main body of the document outlines the process, including data required, methods of collection and interpretation of those data. A series of appendices provide the more-technical and scientific results that underpin the processes and decision trees used in the document. Specifically the framework provides information on collection of the water, rock and biological information used to (a) predict water quality prior to mining, (b) monitor discharges from mines, and (c) identify mining-related impacts. In addition, the framework includes information on state of the art techniques for prevention of poor water quality in mine drainages and optimal strategies for management of mine waste or overburden and treatment of mine drainages if necessary. The appendices also include information on the management of suspended solids (an issue common to all mining operations) and discussion on the impact of extreme events on mining operations. The framework is written for a wide audience – regulators, mining companies, landholders, and the community – with a focus on assisting with regulatory processes – such as access arrangements with the Department of Conservation, assessment of environmental effects (AEE) for resource consenting and setting resource consent conditions – as well as for internal decision-making by mining companies.
iv
v
Table of contents 1
Introduction ............................................................................. 13 1.1 Mining on the West Coast and in Southland ................................. 14 1.1.1 Coal mining .............................................................. 14 1.1.2 Gold mining .............................................................. 15 1.2 Potential environmental effects of mining .................................. 15 1.2.1 Mine drainage chemistry ............................................... 15 1.2.2 Biological effects........................................................ 17 1.2.3 Reducing impacts – management and treatment .................. 18 1.3 Development of a framework to assess mining impacts on streams ..... 20 1.3.1 Regulation of the mining industry.................................... 20 1.3.2 The Framework.......................................................... 21 1.4 Document structure ............................................................. 23
2
Predicting potential ecological impacts on streams .............................. 25 2.1 Introduction....................................................................... 25 2.2 Historical data.................................................................... 25 2.3 Baseline information ............................................................ 26 2.3.1 Site hydrogeology ....................................................... 26 2.3.2 Baseline chemical water quality...................................... 27 2.3.3 Baseline biological monitoring ........................................ 29 2.4 Checklist........................................................................... 32
3
Mine drainage and downstream water chemistry ................................. 33 3.1 Introduction....................................................................... 33 3.1.1 Commodity and region ................................................. 33 3.2 Analysis of rocks from the proposed mine site .............................. 35 3.2.1 Important minerals and field observations ......................... 35 3.2.2 Sampling strategies for geochemical characterisation of rocks . 36 3.2.3 Acid–base accounting (ABA) ........................................... 38 3.2.4 Geochemical testing to assess the trace element content of rocks ............................................................................. 42 3.2.5 Assessing the reactivity of rocks – kinetic tests .................... 42 3.3 Prediction of water quality downstream of a mine ........................ 42 3.3.1 Site hydrogeology ....................................................... 43 3.4 Checklist........................................................................... 44
4
Coal - potentially acid-forming ...................................................... 45 4.1 Introduction....................................................................... 45
vi
4.2 Predicted water quality......................................................... 45 4.2.1 Mine drainage............................................................ 45 4.2.2 Downstream water quality ............................................ 47 4.3 Predicted ecological impact ................................................... 47 4.4 Operational management and treatment .................................... 50 4.4.1 Operational management.............................................. 50 4.4.2 Treatment................................................................ 56 4.4.3 AMD from historical mining activities – additional considerations for treatment ..................................................................... 67 4.5 Checklist........................................................................... 68 5
Coal – non-acid-forming ............................................................... 70 5.1 Introduction....................................................................... 70 5.2 Predicted water quality......................................................... 70 5.2.1 Downstream water quality ............................................ 70 5.3 Predicted ecological impact ................................................... 71 5.4 Operational management and treatment .................................... 72 5.5 Checklist........................................................................... 72
6
Gold – hard rock ........................................................................ 74 6.1 Introduction....................................................................... 74 6.2 Predicted water quality......................................................... 75 6.2.1 Downstream water quality ............................................ 76 6.3 Predicted ecological impact ................................................... 77 6.4 Operational management and treatment .................................... 78 6.4.1 Prevention and mitigation ............................................. 79 6.4.2 Treatment................................................................ 80 6.5 Checklist........................................................................... 84
7
Gold – alluvial ........................................................................... 85 7.1 Introduction....................................................................... 85 7.2 Predicted water quality......................................................... 85 7.3 Predicted ecological impact ................................................... 86 7.4 Operational management and treatment .................................... 88 7.5 Checklist........................................................................... 88
8
Decision making and monitoring ..................................................... 89 8.1 Decision-making steps........................................................... 89 8.2 Ongoing monitoring.............................................................. 90 8.2.1 Monitoring of rock geochemistry ..................................... 90 8.2.2 Leachate monitoring ................................................... 90
vii
8.2.3 Treatment system monitoring ........................................ 91 8.2.4 Water quality ............................................................ 94 8.2.5 Biological monitoring ................................................... 96 8.3 Checklist........................................................................... 97 9
Worked example and service providers............................................. 98 9.1 Worked example ................................................................. 98 9.1.1 Overview ................................................................. 98 9.1.2 Step 1: Collate background and baseline information ...........104 9.1.3 Step 2: Collect rock samples .........................................105 9.1.4 Step 3: Geochemical testing to determine acid-forming status 106 9.1.5 Step 4: Predict mine drainage chemistry ..........................106 9.1.6 Step 5: Predict stream water chemistry ...........................107 9.1.7 Step 6: Determine the ecological impact ..........................108 9.1.8 Step 7: Consider whether impacts are acceptable ...............108 9.1.9 Step 7a: Decide on management and treatment .................109 9.1.10 Step 8: Design ongoing monitoring ..................................112 9.2 Service providers................................................................114
10
References .............................................................................115
11
Additional reading.....................................................................122 11.1 Further reading..................................................................122 11.1.1 General ..................................................................122 11.1.2 Geochemistry ...........................................................123 11.1.3 Biological effects.......................................................123 11.1.4 Operational management and treatment ..........................123 11.2 Publications arising from the research programme .......................124 11.3 New Zealand case studies authored or co-authored by the research team 128 11.3.1 Hard rock gold ..........................................................128 11.3.2 Alluvial gold.............................................................129 11.3.3 Treatment options for mine drainage ..............................130
List of Figures Figure 1 Unimpacted tributary (left) mixes with AMD-contaminated water, Cascade Creek (Denniston). ............................................................................ 16 Figure 2 Simplified food web of a stream ecosystem. Effects of mine drainage on fish can be direct, such as toxicity from low pH, or indirect, such as effects on algae which affect invertebrates and, in turn, fish...................................... 17 Figure 3 General framework and detailed step-by-step guide for predicting and managing water quality (pH and metal) impacts from mining on streams........... 22 Figure 4 Outline of document structure. .................................................. 24 viii
Figure 5 Examples of macroinvertebrates that commonly live in streams and rivers throughout New Zealand. Top left: the spiral-cased caddisfly Helicopsyche. Top right: the stonefly Zelandoperla. Bottom left: ubiquitous mayfly, Deleatidium. Bottom right: the common stonefly Zelandobius. ....................................... 29 Figure 6 Before-after-control-impact (BACI) sampling designs for assessing the environmental effects of human impacts on stream ecosystems. Each circle represents a sampling site. A rigorous BACI design includes multiple sampling sites in impacted reaches, and upstream and additional stream controls, both before and after an impact........................................................................... 31 Figure 7 Formations that could be disturbed by coal and gold mining on the West Coast and in Southland. ...................................................................... 34 Figure 8 NAG pH vs NAPP graph. Samples that are acidic according to both NAG and NAPP tests plot in the PAF field, while those that are non-acidic by both tests plot in the NAF field. Samples where one of the analyses indicates acidic and the other indicates non-acidic plot in the uncertain field and require further investigation. 41 Figure 9 NAG pH vs MPA/ANC. This plot is interpreted in the same manner as Fig. 8. ................................................................................................... 41 Figure 10 Basic process for determining water quality downstream of a mine. .... 43 Figure 11 Potential water chemistry from PAF coal measures. ........................ 46 Figure 12 Potential ecological outcomes arising from a PAF coal mine on the West Coast. Metal limits are dissolved metals and refer to the sum of Fe and Al concentrations. ................................................................................ 48 Figure 13 Options and effectiveness with time (TEAM NT 2004, in INAP 2009). .... 51 Figure 14 Prioritisation for consideration of applicability of different waste-rock management strategies. Refer to above text for details on different techniques . 55 Figure 15 Flow chart to guide selection between active and passive treatment for AMD (modified from Waters et al. 2003). ................................................. 58 Figure 16 Flow chart to design a site-specific active treatment system for AMD (modified from Rajaram et al. 2001). The generic treatment step is shown on the side of the diagram. Note for treatment of suspended solids see also Appendix B. 59 Figure 17 Summary of the key benefits of the five most commonly used chemicals for the dosing-with-alkali step. ............................................................. 60 Figure 18 Comparison of potential costs for active treatment of two hypothetical AMDs over 5 and 20 years using the five most commonly used chemicals. These costs were determined using AMDTreat (Means et al. 2003) and are based on cost of chemicals in New Zealand in 2010 and default parameters for labour and construction costs provided in AMDTreat. A low-flow, low-acidity (30 L/s, 500 mg/L) option is compared with a high-flow, high-acidity (80 L/s, 1000 mg/L) option over 5- and 20-year treatment periods. ................................................... 62 Figure 19 Flow chart to select among AMD passive treatment systems based on water chemistry (high Fe), topography, and available land area (Trumm 2007). .. 64 Figure 20 Flow chart to select among AMD passive treatment systems based on water chemistry (low Fe), topography, and available land area (Trumm 2007). ... 65 Figure 21 Treatment system costs for a hypothetical AMD determined using AMDTreat (Means et al. 2003) using 2010 cost of limestone in New Zealand and default parameters for labour and construction costs provided in AMDTreat. Aew, aerobic wetland; Anw, anaerobic wetland; OLC, open limestone channel; ALD, ix
anoxic limestone drain; RAPS, reducing and alkalinity producing system; SLB, slag leaching bed; LLB, limestone leaching bed; DW, diversion well; Bio, bioreactor. Hatched area indicates the non-chemical costs. Note: the costs shown in this figure cannot be directly compared with those shown in Figure 18 as the hypothetical AMDs considered in these two examples are markedly different (Appendix F). .... 67 Figure 22 Potential ecological impacts arising from drainage from coal mining in non-acid-forming regions. ................................................................... 71 Figure 23 Predicted water quality associated with a hard-rock gold mine on the West Coast, depending on mineralogy of mineralised rock (ore), mine processing system, and topography of the site where waste is deposited. ....................... 76 Figure 24 Ecological impact outcomes arising from hard-rock mine drainage based on predicted water chemistries............................................................. 77 Figure 25 Summary of mitigation strategies for environmental issues at a West Coast gold mine. The principal strategy is to remove As and Sb from discharge waters via adsorption to Fe oxyhydroxide. If insufficient natural Fe oxyhydroxide formation occurs, a treatment system is required....................................... 80 Figure 26 Selection of passive or active treatment for As removal. .................. 82 Figure 27 Flow chart of the potential aquatic impacts arising from an alluvial gold mine, bolding indicates most likely outcome............................................. 87 Figure 28 Framework for predicting and managing water quality impacts on streams from mining. ................................................................................... 89 Figure 29 Topographic map showing mine and waste dump footprint................ 99 Figure 30 Map showing drill-hole location and cross-section line from geological report. .........................................................................................100 Figure 31 Cross section A-A’. ...............................................................101 Figure 32 Cross section B-B’. ...............................................................101 Figure 33 Cross section C-C’. ...............................................................102 Figure 34 Cross section D-D’. ...............................................................102 Figure 35 Cross section E-E’. ...............................................................103 Figure 36 Cross section F-F’. ...............................................................103 Figure 37 Modifed Figure 11 to illustrate the path followed to predict generic water chemistry for the proposed mine. .........................................................107 Figure 38 Modified Figure 12 showing the pathway to determine the potential ecological outcome for the proposed mine. .............................................108 Figure 39. Modified Figure B1 showing the pathway for determining treatment of total suspended solids for the hypothetical example mine. ..........................110 Figure 40 Modified Figure 16, showing the decision pathway for the selection of a treatment system for the hypothetical example mine. ................................111 Figure 41 Location of treatment system and monitoring points. .....................113 List of Tables Table 1 Summary to interpreting acid–base accounting results ....................... 40 Table 2 Active treatment systems to remove As ......................................... 83
x
Table 3 Hypothetical ABA results of samples collected during exploratory drilling ..................................................................................................106 Table 4 Companies providing services relevant to mining impact assessment .....114 Appendices: Appendix A Regulatory requirements Appendix B Suspended solids Appendix C Geochemistry Appendix D Biological impacts Appendix E Operational management Appendix F Reducing impacts – treatment techniques Appendix G Extreme events
xi
12
1 Introduction Mining is an important part of the New Zealand economy, valued at $1.5 billion per annum (Crown Minerals 2007), and predictions are that this could reach $2.0 billion by 2010 and $3.0 billion by 2015 (Statistics New Zealand 2007). New Zealand has a long history of mining, with European settlers extracting coal and gold since the 1860s. Most residential, commercial and industrial products use minerals during their production and thus mining will remain an important industry into the future. However, the removal of minerals from the ground inevitably results in significant negative impacts on the environment. Increasingly, miners are being required to reduce and minimise these impacts. The West Coast of the South Island and Southland are key mining areas, with potential for increased mining activity. This document describes a framework to assist with planning of future mine developments on the West Coast and in Southland. The framework results from a collaborative research programme between CRL Energy, the University of Canterbury, University of Otago and Landcare Research, and it has been developed in conjunction with end-users including the Department of Conservation, the West Coast Regional Council, Environment Southland, Solid Energy, OceanaGold, Pike River Coal, Francis Mining and consultants. It is intended to provide consistency and transparency in decision making for proposed mining operations, specifically around preventing or minimising impacts on streams. The framework is intended for use in internal decision-making by mining companies and to assist with certain regulatory requirements, such as access arrangements with the Department of Conservation, and in the resource consenting process, such as during consultation, assessment of environmental effects (AEE), and setting resource consent conditions. The framework may also be useful in developing future regional plans for water quality. This framework focuses on water quality issues associated with coal and gold mining, specifically pH, metals and turbidity, and does not address other water quality measures such as temperature, or environmental issues that also may need to be considered during mine planning and consenting such as stream diversions, water quantity, noise, traffic, visual, dust, and subsidence issues. Commencing with a general introduction to mining on the West Coast and Southland and water quality impacts associated with mining, this document outlines a process for determining environmental impacts on aquatic systems. The framework draws together research undertaken by the research team on rock geochemistry, aquatic chemistry, freshwater ecology, aquatic toxicity, and management and treatment techniques for mining, and provides guidance on: •
Interpretation of regional trends in rock geochemistry and prediction of mine drainage chemistry
•
Sampling strategies and analysis methods for mine drainage prediction and management
•
Effects-based ecological impact thresholds
•
Sampling strategies and methods for water quality and biological impact assessment and monitoring
•
Management strategies for waste rock and mine tailings
•
Optimal selection of active and passive treatment systems
13
1.1 Mining on the West Coast and in Southland1 Coal and gold mining have a rich history on the West Coast of the South Island and in Southland, with mining commencing around the mid-1860s. Today, the West Coast and Southland are the main coal mining areas in the South Island, and the third largest hard-rock gold mine in New Zealand is at Reefton on the West Coast. Active gold mining and exploration occur on the West Coast, but there is less such activity in Southland. The scale and number of mining operations have expanded and declined several times over the years as demand for commodities changes. Mining of deposits that have marginal profitability can stop and restart depending on commodity prices. Up until the 1970s mining was conducted with little regulation of the impact on downstream water quality or ecosystems. Several historical mine workings occur throughout the landscape, particularly on the West Coast, with numerous historical mining workings causing significant impacts on downstream water quality.
1.1.1 Coal mining On the West Coast mining occurs in 13 coalfields of various sizes mostly between Greymouth and Seddonville (c. 40 km north of Westport). The most productive of these are the Buller, Greymouth, Pike River, Reefton and Garvey Creek coalfields. Of the 983 million tonnes (megatonnes; Mt) of in-ground coal in the region, over three-quarters of recoverable reserves are in the Greymouth (mostly underground) and Buller (mostly opencast) coalfields. Rocks mined for coal belong primarily to either the Brunner or Paparoa sedimentary sequences and these sequences are found in most of the coalfields. Both Paparoa and Brunner sedimentary sequences contain coal seams up to 20 m thick. This coal is primarily bituminous and as a result almost all of the coal mined on the West Coast is exported for steel production. Currently about 2 Mt are mined on the West Coast each year, which accounts for about half of New Zealand’s annual coal production. However, there is scope for this to grow over the next few years as new mines start to produce. In Southland, coal and lignite are currently mined from the Ohai coalfield and the Eastern Southland lignite deposits, respectively. The Ohai coalfield has relatively small recoverable resources of about 50 Mt. In contrast, the eastern Southland lignite fields are New Zealand’s biggest fossil fuel energy resource and contain over six billion tonnes (gigatonnes, Gt) of lignite, most of which could be opencast mined. Current annual production from Southland is about 300 000 t and this coal and lignite is mostly used for domestic industry. However, there is potential for lignite mining in Southland to grow by more than an order of magnitude if economic conditions are favourable.
1
This information was primarily sourced from Te Ara - the Encyclopedia of New Zealand, updated 4 Dec 2008: Sherwood and Phillips, 'Coal and coal mining', http://www.TeAra.govt.nz/EarthSeaAndSky/MineralResources/CoalAndCoalMining/en; and Carl Walrond, 'Gold and gold mining', http://www.TeAra.govt.nz/EarthSeaAndSky/MineralResources/GoldAndGoldMining
14
1.1.2 Gold mining Alluvial gold mining on the West Coast commenced around 1864 with the discovery of payable gold in Greenstone Creek, a tributary of the Taramakau River. Payable alluvial gold was also dug from Coal Island in Preservation Inlet, Fiordland, in the 1880s, although by 1904 few miners remained. In Southland, by the 1860s black sand on the beach at Orepuki, near Riverton, was found to yield very fine gold and platinum. Sluice mining soon recovered gold from the coastal terraces. Other finds at nearby Round Hill proved even richer, and extensive sluicing operations continued until the 1950s. Gold in Southland was also found in the Waiau catchment at Blackmount and the Mataura catchment around Waimumu, Waikaia and Nokomai. On the West Coast, hard-rock gold mining commenced in 1867 with underground mining of quartz at Reefton. Between 1870 and 1951, 84 Reefton mines produced 67 t of gold. Underground gold mining on the West Coast ceased with the closure of the Waiuta mine (south of Reefton) in 1951. Mining at Reefton recommenced in 2007 with the opening of a major opencast gold mine (Globe-Progress).
1.2 Potential environmental effects of mining Mining can have diverse environmental effects. These can categorised according to whether the effect is restricted to the mine site or occurs at some distance from the mining activity. For example, environmental effects that are restricted to the mine site include those arising from clearing of vegetation and habitat modification, modification of soil profiles, changes to topography and slope, or subsidence. Environmental effects that occur away from the mine site include increased noise, dust deposition, and impacts on downstream water quality and ecosystems. Current expectations of mining operations are that environmental effects, whether on or off site, will be mitigated or minimised (e.g. Environment Canada 2009). With some exceptions, such as subsidence or mine fires, environmental effects that occur on the mine site are relatively predictable and more easily managed compared with those that affect areas away from the mine. Effects on downstream aquatic systems arising from mine drainage are among the most difficult mining-related environmental impacts to predict, mitigate, manage or remediate. Often these effects can be severe. The presence or absence, severity and extent of chemical impacts on downstream ecosystems depend on a complex variety of local, regional, natural and anthropogenic factors. This framework focuses on the prediction of water chemistry downstream of mine operations, the potential ecological impacts caused by mine drainage, as well as management and mitigation of mine drainages on the West Coast and in Southland.
1.2.1 Mine drainage chemistry New Zealand’s geology, climate and topography vary considerably so both natural and mine drainage have different water quality and environmental implications according to location. Groundwater, surface water runoff, and mine process water at a mine site (collectively ‘mine drainage’) all have potential to chemically interact with mineralised rocks. On the West Coast and in Southland, where coal and gold are the principal commodities mined, mine drainage waters can develop
15
distinctly different compositions from natural background waters. Therefore the chemistry of mine drainages associated with coal and gold mines is highly variable. Coal mines may produce mine drainage ranging from neutral pH (neutral mine drainage, NMD) with low metal concentrations, to acid mine drainage (AMD) with pH5 different rock types present in any 20 m of core) at least one drill hole should be sampled for every block of 250 × 250 m. Where geology is simple (200).
•
ANC analyses are commonly combined with MPA analyses for interpretation.
•
Rocks with less than 1 kgH2SO4/t should not be relied on for ANC.
Net acid production potential (NAPP) •
Net acid production potential (NAPP) is the calculated difference between MPA and ANC, i.e. NAPP = MPA − ANC, and is reported in units of kg H2SO4 per tonne of rock (kgH2SO4/t).
•
Positive NAPP values are acid producing, while negative NAPP values are acid neutralising (see also Table 1).
Net acid generation (NAG) •
NAG testing assesses net acid production during weathering. Specifically, a crushed rock sample is oxidised to release acid that reacts with the neutralising minerals in the rock.
•
Titrations (for acidity and pH measurements of the NAG solution are used to quantify the acid-producing potential).
•
Net acid generation potential is measured in kgH2SO4/t and the end pH of the NAG solution is also measured.
•
Samples with more than 10 kgH2SO4/t or a pH of less than 4.5 are significantly acid forming.
•
Samples with 1–10 kgH2SO4/t and pH less than 4.5 are moderately acid forming.
•
Samples with less than 1 kgH2SO4/t and pH less than 4.5 are weakly acid forming.
•
Samples with pH greater than 4.5 are non-acid-forming.
There are some important limitations in the applicability of NAG analysis, and potential for false-positive interpretations. These are discussed in further detail in Appendix C.6).
Paste pH •
Paste pH is a field-based analysis that determines the readily soluble acidity in crushed rock and is commonly used as a qualitative tool to identify and manage acid areas.
•
This analysis is carried out by mixing a crushed rock sample in a 1:5 volume ratio with deionised water and measuring the pH immediately.
•
A sample with a pH less than 4.5 indicates the rock has high stored acidity and will contribute acid rapidly during weathering.
39
•
Paste pH is not an indicator of long-term acid contributions from rock because it does not analyse those components that require long-term exposure to air and water to release acid.
Carbonate bomb •
The carbonate bomb field test combines a powdered rock sample with concentrated acid to release carbon dioxide (CO2) gas. The pressure of gas in the bomb is used to estimate the carbonate mineral content of the sample (Appendix C.6).
•
The carbonate bomb can be used as a field method to assess the distribution of rocks that contain carbonate minerals and ANC of rocks.
Interpretation of acid–base accounting analyses MPA, ANC and NAG analyses are the primary analyses that are useful in determining the acid-forming status of rock samples. Table 1 provides a generalised guide for the interpretation of acid–base accounting results in relation to the acidity of the collected rock samples. Table 1 Summary to interpreting acid–base accounting results NAPP (MPA-ANC)
NAG
> 10 kgH2SO4/t
Highly acid producing
Highly acid producing
1-10 kgH2SO4/t
Moderately acid producing
Moderately acid producing
0-1 kgH2SO4/t
Low – no acid producing
Low – no acid producing
-1-0 kgH2SO4/t
Low – no acid neutralising
-10-10 kgH2SO4/t
Moderately acid neutralising
200 mg/L)
•
Enriched trace elements (1-3 orders of magnitude above background)
However, the chemistry of AMD from specific seeps and how it interacts with the wider catchment is variable and subsequently will result in different levels of environmental impact. In addition, selection of optimal treatment or management
45
techniques (section 4.4) will depend on a detailed understanding of the mine drainage chemistry. Based on investigation of AMD from mines located in the Brunner Coal Measures on the West Coast, several parameters that influence AMD chemistry have been identified (Pope et al. 2006, in press). In particular, the following parameters were identified as being important: •
Mine type (opencast or underground)
•
Hydrogeology (above water table or below water table)
•
Local variations in rock type (mudstone rich or sandstone rich).
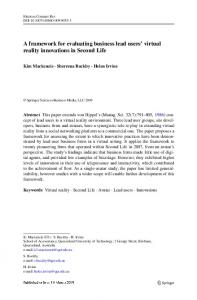
Using these parameters, the likely mine drainage chemistry associated with specific mine types within Brunner Coal Measures in different locations can be estimated (Figure 11). There are insufficient data to construct a hazard model of PAF rocks in other areas; however, similar relationships are likely and these water quality predictions can be considered to be broadly applicable to other PAF rocks. Therefore chemical compositions for AMD arising from other sequences of PAF rocks could be based on the AMD produced by the Brunner Coal Measures as a guide (Figure 11). The type of proposed mine (opencast or underground) influences the dissolved Al to Fe ratio in mine drainage, which in turn influences the likely downstream water chemistry. If rocks disturbed by mining are kept below the water table then AMD chemistry is much less acidic because reactions that involve oxygen proceed more slowly. This interpretation is speculative for opencast mines. Mine in PAF rocks
Mine type
Hydrogeology
Mine drainage chemistry
Opencast
Underground
Al : Fe > 2
Al : Fe < 4
Mine waste above water
Mine waste below water table
Mine waste above water table
Mine waste below water table
pH 2–3
pH 2.5–3.5
pH 3–5
Fe 10–50 mg/L
Fe 5–100 mg/L
Fe 1–10 mg/L
Al 20–200 mg/L
Al 5–50 mg/L
Al 1–20 mg/L
Figure 11 Potential water chemistry from PAF coal measures.
46
Where AMD is likely to form, the oxidation state (form of the chemical) and level of oxygenation (dissolved oxygen concentration) in mine drainage are important because these determine the types of treatment activities that can be undertaken (section 4.4.2). These parameters can only be broadly predicted. In general, the concentration of dissolved oxygen (DO) and ratio of Fe3+ to Fe2+ dissolved in mine drainage from opencast mines is higher than in underground mine drainage because the availability of atmospheric oxygen is greater at opencast mines. However, sitespecific factors such as presence of small waterfalls, thickness of waste-rock sequence, and reaction time for AMD formation influence the oxidation and oxygenation state substantially. In general further analysis (e.g. kinetic testing) and consideration of site-specific factors will be required to quantitatively predict the DO concentration and the ratio of Fe3+ to Fe2+. All predictions of AMD composition relate to the chemistry that can be found at mine drainage seeps. There are several limitations to the level of detail that can be predicted because mine drainage chemistry varies due to site-specific factors and evolves with time as reactive components within the rocks are consumed. Kinetic testing of rocks from specific mine sites can be useful to refine predictions of mine drainage chemistry and mine drainage evolution (section 3.2.5; Appendix C.7). Total suspended sediment is generally expected to be elevated at mine sites, and management of TSS is routinely undertaken at all mine sites. The amount of TSS is site specific and varies with climate-controlled factors such as rainfall and the presence of areas that can generate dust and geotechnical properties of the rock; also, the efficacy of TSS management options in place may be variable. Coal fines may form a high proportion of TSS, and pose particular management challenges as they are less dense than sediment and can be difficult to remove when suspended. As there is limited predictive capability, TSS concentrations should be mitigated where possible and managed as mining operations commence. Further detail on the mitigation and management of TSS is provided in Appendix B.
4.2.2 Downstream water quality Prediction of water quality downstream from a PAF mine site requires integration of data on the chemistry of the AMD, site hydrogeology and water quality of any potential receiving environment as outlined in Figure 10 (section 3.3). The likely mine drainage chemistry can be determined from Figure 11, while collection of relevant site hydrological and background water quality is outlined in section 2.3.
4.3 Predicted ecological impact Once water quality has been predicted, the ecological impact associated with that water quality can also be estimated. Coal mines with untreated AMD will have the most severe impact on streams. High acid production from mining areas leads to water characterised by low pH and elevated concentrations of metals. The impact of acidic conditions on stream biota may be influenced by the natural water chemistry. For example, on the West Coast there are numerous brown-water streams where dissolved humic and fulvic acids have been known to reduce pH to less than 4.0. These naturally acidic streams contain diverse macroinvertebrate and fish communities, indicating some taxa pre-adapted to tolerate low pH. Moreover, toxicological experiments indicated mayfly populations from naturally acidic streams were more tolerant of low pH than those from circum-neutral streams. However, pre-adaptation to low pH does not necessarily preclude impact 47
from mine drainage as streams impacted by AMD typically contain high concentrations of metals (See Appendix D for further discussion). The abundance of naturally acidic streams on the West Coast, and the consequent adaptation of endemic species, means that international water quality guidelines such as ANZECC and ARMCANZ (2000) may not be appropriate when identifying and setting water quality targets for mining impacts for such regions. We have used a combination of biological survey data (from the West Coast) and toxicity experiments using West Coast invertebrates to establish the potential impacts outlined below (Figure 12). Six general outcomes are illustrated and described briefly below. The pH limits described are reasonably well defined, while the metal limits are based on Fe and Al concentrations only and are qualitative. Further details about these outcomes, and the toxicological effects of selected metals, are provided in Appendix D. Predictions for a PAF Coal Mine Predicted chemistry of receiving waters
Very low pH (pH < 4)
Low pH (pH 4 – 6)
Circum-neutral pH (pH > 6)
High metals (>2 mg/l of any metal)
Low metals (2 mg/l)
Minimal metals (0.2 mg/l)
Very low metals ( 50 L/s
Yes
Consider Active Treatment See Active Treatment Flow Chart
No
Acidity > 800 mg/L
Yes
No
Acid Load > 150 kg/day
Yes
(acidity (mg/L) x flow rate (L/s) x 0.0864)
No
Operational Mine
Yes
See Text
No
Consider Passive Treatment See Passive Treatment Flow Chart
Figure 15 Flow chart to guide selection between active and passive treatment for AMD (modified from Waters et al. 2003).
Selection of active treatment systems If it is determined that an active treatment system is most appropriate, the next decision is which system to choose. A range of factors will initially influence the selection of appropriate active treatment systems (Figure 16), while efficacy of treatment and particularly costs, primarily of chemicals required, will influence the final selection of treatment system (Appendix F.2). Once an active treatment system has been selected, a computer program such as AMDTreat (Means et al. 2003; Appendix F.4) can be used to design specific components of the system and to determine potential costs. Active treatment for AMD is largely based on industrial wastewater treatment technologies for which extensive research has previously been conducted (e.g. USEPA 2000, 2004). The main steps involved in active treatment of AMD are pretreatment, dosing with alkali, oxidation, and sedimentation (Younger et al. 2002).
58
Other active treatment technologies that are occasionally used for AMD internationally, but which are not covered in this document, include sulfidisation, biosedimentation, sorption and ion exchange, and membrane processes like filtration and reverse osmosis (Younger et al. 2002).
Figure 16 Flow chart to design a site-specific active treatment system for AMD (modified from Rajaram et al. 2001). The generic treatment step is shown on the side of the diagram. Note for treatment of suspended solids see also Appendix B.
59
Pretreatment Pretreatment is required where high suspended solids loads (TSS >100 mg/L) are present, which can affect treatment system performance through clogging piping and flumes, and damaging pumps. TSS concentrations are typically reduced through sedimentation techniques and details on active and passive treatment of TSS are presented in Appendix B.
Dosing with alkali (DA) Dosing with alkali raises the pH of the AMD, which helps to reduce dissolved metal concentrations through the formation of metal oxides. Various chemicals may be used in this step. From a treatment system perspective, the flow rate of the AMD and the concentration of dissolved Fe will influence selection of the chemicals used. However, in most cases a variety of chemicals could be used and other factors – such as costs, ease of use and health, safety and environmental considerations – will influence the final selection of chemical used. Figure 17 presents a summary of the key benefits, with more details provided in Appendix F.1. An illustration of the costs of active treatment using various chemicals is provided at the end of this section.
Figure 17 Summary of the key benefits of the five most commonly used chemicals for the dosing-with-alkali step.
Oxidation (O) The oxidation step ensures reduced metals such as Fe2+ and Mn2+ are oxidised to Fe3+ and Mn4+ so that they can form hydroxide and oxide precipitates and be removed from AMD (Skousen et al. 2000; Younger et al. 2002). This step may not be necessary if the metals are already highly oxidised through the previous treatment step. Bench-scale tests at the time of system design would be required to confirm this. Oxidation is typically undertaken using mechanical means, although sometimes chemical oxidation is used. Mechanical aeration techniques include stirring with rotating blades (most common), inline Venturi aeration, trickle filter aeration (water trickling through a tank filled with high-surface-area media and with air bubbled into the water), and cascade aeration (if sufficient land area is available). Appendix F.2 includes some pictures of different oxidation systems. Chemical oxidants commonly used include hydrogen peroxide (H2O2), sodium hypochlorite (NaClO), calcium hypochlorite (Ca(ClO)2), and potassium permanganate (KMnO4; Skousen et al. 1993, 2000). Another potential oxidant is calcium peroxide (CaO2), which can not only oxygenate AMD but also neutralise
60
acidity (Skousen et al. 2000). Cost, availability and effectiveness are typically used to decide among the various chemical oxidants.
Sedimentation (S) The final step in the process is sedimentation to remove the metal oxide precipitates formed during the earlier stages of treatment. The methods used include gravity-assisted separation with or without coagulants/flocculants followed by sludge dewatering and disposal. Depending on available land area, gravityassisted separation is accomplished either with clarification or by using settling ponds or sedimentation ponds (Rajaram et al. 2001). The use of coagulants/flocculants is reserved for higher flow rates (>5 L/s) when residence times in clarifiers or settling ponds can be insufficient for complete metal precipitation. These methods are also used for removal of TSS and are described in more detail in Appendix B. Examples of different sedimentation systems are shown in Appendix F.2. Disposal of the sludge produced during this step is an important consideration, particularly with regards to the potential leaching of trace elements from the sludge. Standard tests are available to determine potential leaching of trace elements (Appendix F.2). If there is insignificant leaching of trace elements, i.e. the sludge is stable, it may be able to be disposed of directly on site, or to landfill. If there is significant leaching of trace elements, stabilisation of the sludge (Appendix F) may be required. If disposed of to landfill, dewatering of sludge, which typically contains between 1 and 5% solids, will be required, although dewatering may not be required for on-site disposal. There are limited examples of active treatment available in New Zealand, although in the United States, sludge dewatering and disposal can be a significant cost of AMD treatment, sometimes exceeding chemical costs by several times (Skousen et al. 2000).
Active treatment system costs Chemical costs typically dominate the total costs for an active treatment system, and thus will be a significant factor influencing the selection of the chemicals used. Chemical cost will be dependent on the actual cost of the chemical used in addition to the amount required, which in turns depends on the efficacy for neutralisation of the chemical. Figure 18 illustrates the relative operational costs of active treatment using different chemicals. These costs were determined using AMDTreat (Means et al. 2003) and are based on cost of chemicals in New Zealand in 2010 and default parameters for labour and construction costs provided in AMDTreat, although in the examples provided the latter are typically less than 6% of the total costs over 20 years. Labour and construction costs represent a higher proportion of the total cost for treatment of low-acidity AMD.
61
Million NZD
Low Flow and Acidity 20
Sodium Carbonate
15
Ammonia Gas
10
Sodium Hydroxide Calcium Hydroxide
5
Calcium Oxide
0 5 years
20 years
Million NZD
High Flow and Acidity 120 100 80 60 40 20 0
Sodium Carbonate Ammonia Gas Sodium Hydroxide Calcium Hydroxide Calcium Oxide 5 years
20 years
Figure 18 Comparison of potential costs for active treatment of two hypothetical AMDs over 5 and 20 years using the five most commonly used chemicals. These costs were determined using AMDTreat (Means et al. 2003) and are based on cost of chemicals in New Zealand in 2010 and default parameters for labour and construction costs provided in AMDTreat. A low-flow, low-acidity (30 L/s, 500 mg/L) option is compared with a highflow, high-acidity (80 L/s, 1000 mg/L) option over 5- and 20-year treatment periods.
Selection of passive treatment systems In the long term, treatment of AMD using a passive treatment system is typically more economic than using an active treatment system; however, careful system choice and design are required to ensure that the treatment system does not fail (Skousen et al. 2000; Skousen and Ziemkiewicz 2005). Potential problems with passive systems include underdesign for flow and/or acidity, short-circuiting of flow, armouring of limestone, and plugging with precipitates. In contrast to active treatment systems, which can be designed to produce a specific water chemistry, there is little control over the final water chemistry from passive treatment systems. The longer residence times required in passive treatment systems for AMD result in a higher final pH, typically between 6 and 7, to ensure adequate removal of metals. Treatment of AMD using passive treatment technologies can be placed into two broad categories: oxidising and reducing strategies (Trumm et al. 2003, 2005). AMD is generated through an oxidation process that results in the dominant contaminant, Fe, being present in two states, ferrous (Fe2+) and ferric (Fe3+; Singer and Stumm 1970). Oxidising systems remove Fe from the AMD by continuing the oxidation process such that all ferrous Fe is oxidised to ferric Fe, and once the pH
62
has been raised sufficiently, precipitated out of the AMD as ferric hydroxide (Fe(OH)3). For reducing systems, the AMD oxidation process is reversed, such that Fe cations and sulphate are reduced, forming the compounds FeS2, FeS, and H2S, thus removing dissolved Fe and sulphate from the AMD. The choice between the two strategies is typically based on the water chemistry (largely dissolved oxygen (DO) content and ferrous:ferric (Fe2+:Fe3+) iron ratio). The DO content of mine drainage will be unknown for a new mine, although it is likely to be high for an opencast mine and either high or low for an underground mine. Similarly, the Fe2+:Fe3+ iron ratio will be unknown for a new mine, although it is likely to be low for an opencast mine and either high or low for an underground mine. Further analysis (e.g. kinetic testing) and good understanding of the sitespecific factors will be required to quantitatively predict the DO concentration and the ratio of Fe2+ to Fe3+. For highly oxidised AMD (saturated DO and Fe mostly as Fe3+), the oxidising strategy is most appropriate. Typical treatment systems that employ the oxidising strategy are open limestone channels (OLCs; Ziemkiewicz et al. 1994), open limestone drains (OLDs; Cravotta and Trahan 1999), limestone leaching beds (LLBs; Black et al. 1999), slag leaching beds (SLBs; Simmons et al. 2002), and diversion wells (DWs; Arnold 1991; Anonymous 2001). Open limestone channels and diversion wells typically require a steep topography in order to generate the necessary aeration and to prevent armouring of limestone by metal hydroxides, which can inhibit the dissolution of limestone (Ziemkiewicz et al. 1997). For reduced AMD (low DO and Fe mostly as Fe2+), the reducing strategy is usually recommended. Typical treatment systems that employ the reducing strategy are anaerobic wetlands (Skousen et al. 2000; Anonymous 2001; O’Sullivan 2005), anoxic limestone drains (ALDs; Hedin and Watzlaf 1994), sulphate-reducing bioreactors (SRBRs; Mattes et al. 2007), and successive alkalinity producing systems (SAPS; Kepler and McCleary 1994), also known as vertical flow wetlands (VFWs) or reducing and alkalinity producing systems (RAPS; Zipper and Jage 2001). However, site limitations, such as available land area and topography, may limit the use of certain systems. Figure 19 and Figure 20 provide guides for selecting passive treatment systems. Where multiple choices for passive treatment are suggested, a review of the potential cost, effectiveness, limitations, and risk of failure for each system should be completed before settling on a final choice (Appendix F.3). A comprehensive description of each of the common passive treatment systems is included in Appendix F.3.
63
Figure 19 Flow chart to select among AMD passive treatment systems based on water chemistry (high Fe), topography, and available land area (Trumm 2007).
64
Figure 20 Flow chart to select among AMD passive treatment systems based on water chemistry (low Fe), topography, and available land area (Trumm 2007).
65
Fe concentration Iron is the most difficult metal to remove from AMD using passive treatment technology, largely due to coating or armouring of limestone, the most commonly used neutralising agent, by Fe oxides and oxyhydroxides, as the AMD is neutralised by limestone (Hilton 2005). This armouring reduces the dissolution rate of the limestone and hence, neutralisation of the AMD (Ziemkiewicz et al. 1997; Watzlaf et al. 2000; Hammarstrom et al. 2003). Much of the current research into passive treatment continues to try to find ways to treat AMD without significant armouring occurring. Reduced AMD is a special case for AMD treatment as, under low DO conditions, armouring of the limestone will not occur because Fe2+ will remain in solution as the pH is raised to neutral (Stumm and Morgan 1996). The ability to raise the pH of the AMD without significant armouring of limestone improves the reliability of treatment. AMD with relatively low Fe concentrations (0.2 mg/L)
Very low metals ( 10. The dissolved cyanide is largely decomposed at the end of the process in a dedicated plant, before discharge to the tailings dam. Most remaining cyanide decomposes under the UV component of sunlight. Residues from the processing plant (tailings) are typically discharged as water-rich slurry, and are impounded behind a dam so that the solids will settle. The water forms a lake on the surface, and can be recycled through the plant or discharged. The tailings impoundment is a major feature of most modern hard-rock gold mines, and this impoundment can be up to 1 km across. Rain water, process water and groundwater discharges from beneath the tailings dam may have elevated levels of As and/or Sb. Hard-rock gold deposits involve mining of narrow mineralised zones in bedrock, either as large open cuts or in underground tunnels. Opencast gold mines produce very large amounts of waste rock, and waste-rock piles 1 km across and 50 m high are common. However, most of this waste rock is barren host rock, with negligible amounts of sulphide and trace minerals. Instead, the principal environmental issues for aquatic systems are discharge of neutral waters enriched in As and Sb (referred to as contaminated neutral mine drainage (CMD)) and high suspended solid loads
74
from tailings dams. The concentrations of As and Sb in mine drainage depend on the mining methods and waste disposal systems used.
6.2 Predicted water quality In any mine operation turbidity arising from high suspended solid loads will occur, due to the scale of earthworks involved. However, the extent to which this is likely to be a problem cannot be predicted and measures to mitigate high suspended solid loads should be routinely put in place (see Appendix B). As there is limited predictive capability of the likely extent of TSS, it is managed proactively (refer to Appendix B). When mining operations commence, suspended solid loads, in particular that present in the discharge from the treatment system, should be monitored to assess the effectiveness of treatment systems.
In addition to suspended solids, groundwater, surface water runoff, and mine process water at a gold mine site all have potential to chemically interact with mineralised rocks, and these mine waters develop distinctly different compositions from the natural background waters. Mine drainage pH is typically between 7 and 8 because of the natural carbonate minerals. The high pH (>10) of cyanidation water can contribute to alkaline pH of mine waters. Discharge waters can contain up to 1 mg/L cyanide, but this decomposes in UV light in the discharge stream, and impacts arising from the use of cyanide are unlikely. High concentrations of As and Sb in mine drainage, primarily arising from mine tailings and processing plant water, are the principal environmental issues associated with hard-rock gold mines. The levels of As and Sb in discharge waters depend on the composition of the ore, mining methods, and the waste disposal systems used (Figure 23). If no sulphide minerals are present in the ore, then there will be no issue with elevated trace metal concentrations downstream of the mining operation. If sulphide minerals are present, the method of processing becomes a critical factor influencing trace metal concentrations. If the process stream involves no deliberate oxidation of sulphide minerals (left side of Figure 23), the hydrology of the mine site controls discharge water composition. The key feature is the amount of oxygen that reaches the sulphide minerals: •
If the waste storage is fully saturated with water, limited oxygen will reach the sulphide minerals and As and Sb concentrations in discharge water will be more dependent on the water flow through the waste pile. If there is limited water flow through the repository, the repository will mimic natural groundwater systems, and As and Sb levels will be elevated above regional background water concentrations, but comparable with naturally high background groundwater in mineralised rocks. If there is rapid flow of water through the system, more significant dissolution of sulphide minerals will occur and As and Sb levels will rise above the naturally elevated background.
•
If the waste is allowed to become unsaturated, sulphide minerals will oxidise on a scale of 1-10 years and the As and Sb concentrations of discharge waters will rise substantially, possibly to theoretical limits of 50-100 mg/L.
75
Figure 23 Predicted water quality associated with a hard-rock gold mine on the West Coast, depending on mineralogy of mineralised rock (ore), mine processing system, and topography of the site where waste is deposited.
If the mine processing system involves oxidation of sulphides to liberate gold (righthand side of Figure 23), mine tailings will contain As and Sb oxide minerals (scorodite, valentinite). These oxide minerals are highly soluble, and As and Sb in discharge waters can rapidly rise to tens of milligrams per litre. It is important to note that both As and Sb are metalloids and have different chemical behaviour from most heavy metals (e.g. copper, lead, zinc, cadmium) (Appendix C.3). Arsenic and antimony become more soluble with increasing pH, so that they can have 100 times higher concentrations at pH 7 (mine waters) than at pH 5 (some natural West Coast waters). Addition of lime or other acid-neutralising agents to arsenic-bearing mine wastes can result in major increases in dissolved As discharges.
6.2.1 Downstream water quality Total suspended sediment is generally expected to be elevated at mine sites, although there are limited data with which to predict the extent of the issue and management for high suspended solid loads should be routinely planned for (see Appendix B). When mining operations commence, suspended solid loads, in particular that present in the discharge from the treatment system, should be monitored to assess the effectiveness of treatment systems. The regulatory point of discharge from a mine site is generally downstream from mining operations, and downstream from where the mine waters first enter the stream. Hard-rock gold mines are located in regions that have naturally elevated As and Sb background concentrations, and it may be more relevant to consider the flux of As and Sb to determine the contribution of mining operations to downstream water quality and provide practical targets for any mine-related water treatment facility (Appendix C.9). These elevated background concentrations will influence the regional flux of As and Sb, which may be large and overshadow most mine discharges a few kilometres downstream from a mine.
76
Other factors that influence downstream water quality for a proposed operation are the proximity and magnitude of large streams than can dilute As and Sb to low levels indistinguishable from the regional flux, and natural attenuation of As and Sb bearing waters by Fe oxyhydroxide. Both As and Sb are readily adsorbed onto Fe oxyhydroxide precipitates, which can adsorb 100 000 times as much As and Sb as there is dissolved in water. Iron oxyhydroxide forms naturally around gold mines, through oxidation of certain minerals (see also Appendix C.5) and, provided it is constantly renewed, this is an extremely effective mechanism to remove As and Sb from mine drainage.
6.3 Predicted ecological impact The non-suspended-solids impact of hard-rock gold mines on streams is usually related to the metal content of the mine drainage (Figure 23). In particular, As is of environmental concern and can be toxic to stream biota at relatively low concentrations. In other cases, metal precipitates may be present and coat the streambed, interfering with habitat and food webs. Low pH from acidity is very rarely a problem for hard-rock gold mines in New Zealand. The following flow chart (Figure 24) illustrates the main ecological impact outcomes that occur from hardrock gold mine drainage. Further details on the effects of As and Sb are provided in Appendix D.2. With the exception of toxicity studies on key taxa, there are few data on the effect of elevated As on stream communities in New Zealand. Therefore these outcomes are based, in part, on overseas studies.
Predicted chemistry of receiving waters
Oxidation processing at mine site
As is pH-dependent 20 mg/L at pH 7 0.2 mg/L at pH 5 Sb up to 50 mg/L
High to severe impact
Outcome 1
No oxidation processing at mine site
Metals present
Minimal Metals
Very low metals
Rapid dissolution As, Sb > 1 mg/L
Moderate dissolution As, Sb = 0.1 to 1 mg/L
Minor dissolution As, Sb = 0.01 to 0.1 mg/L
High impact
Outcome 2
Moderate impact
Outcome 3
Minor impact
Outcome 4
Figure 24 Ecological impact outcomes arising from hard-rock mine drainage based on predicted water chemistries.
Outcome 1 In general mine drainage containing low concentrations of As and Sb should support a full diversity and abundance of aquatic life for the area. Mining still could affect stream habitat if turbidity or sedimentation (from mining operations) were present. Otherwise, species and food webs should be comparable with those in pristine streams in the area.
77
Outcome 2 At moderate dissolution of As and Sb some effects arise, although at concentrations < 1 mg/L, Sb does not exert any visible toxicity (Duran et al. 2007). In particular reproductive effects in juvenile fish and mortality in amphibians and invertebrates have been observed at As concentrations as low as 0.2 mg/L. In addition, some impacts may be observed on algal and invertebrate species, although diversity is expected to be moderately high.
Outcome 3 At higher concentrations of As and Sb (> 1 mg/L) sub-lethal and lethal effects on algae, invertebrates and fish will be expected. As such, a lower diversity and abundance of these organisms would be likely.
Outcome 4 The most severe impact on stream ecosystems will occur when there are high concentrations of As and/or Sb. Fish are unlikely to be present and few macroinvertebrates of very limited diversity will be found in such streams. Algae and microbes, however, may be present, and even in high abundance in some cases. These communities tend to be dominated by a few taxa that are able to tolerate the stressful conditions.
6.4 Operational management and treatment At most sites management of mine tailings and waste rock and treatment of mine drainage is likely to be required to ensure that trace metals and suspended solid loads in discharge waters (or at a downstream point of interest) do not exceed acceptable levels. Naturally occurring Fe oxyhydroxide can provide an extremely effective mechanism of removing As and Sb from mine drainage, reducing the need for further treatment. Specifically, exposure of low-As waste rock to allow oxidation of Fe minerals will enhance the formation of Fe oxyhydroxide and increase the capacity of the overall site for As adsorption. The following Fe-bearing minerals are of most relevance in hard-rock gold mines: •
Pyrite. Minor acidification associated with pyrite oxidation is normally not an issue because of the high ANC of surrounding rocks. Pyrite typically accompanies most hard-rock gold, but some deposits are notably poor in pyrite. In this case, acidification is desirable as minor acidification can help to limit dissolving of As minerals.
•
Iron-bearing carbonates. Ankerite and/or siderite commonly occur in gold deposits and in the immediately adjacent waste rock. Oxidation of these carbonate minerals produces Fe oxyhydroxide. Ankerite (Fe-bearing dolomite) is the most soluble, so that Fe oxyhydroxide forms rapidly. Siderite is less soluble, and finer grain size may be needed for effective Fe oxyhydroxide formation for As and Sb attenuation.
•
Chlorite. Fe-bearing varieties of this silicate mineral are commonly present in host rocks, and will produce some Fe oxyhydroxide. The oxidation process is slow, and volumes are small, so the attenuation effects are minor only.
78
If Fe oxyhydroxide is required to reduce dissolved As discharge, the following information is required in the early stages of mine development: •
Confirmation of presence of pyrite (>2%) in waste rock and/or tailings.
•
Confirmation that pyrite oxidation precipitation of Fe oxyhydroxide.
•
Confirmation that sufficient Fe oxyhydroxide is being formed to reduce dissolved As by at least one order of magnitude (typically to 2
Mine waste above water table
pH 2–3 Fe 10–50 mg/L Al 20–200 mg/L
Mine waste below water table
Underground Predicts Al : Fe < 4
Mine waste above water table
pH 2.5–3.5 Fe 5–100 mg/L Al 5–50 mg/L
Mine waste below water table
pH 3–5 Fe 1–10 mg/L Al 1–20 mg/L
Figure 37 Modifed Figure 11 to illustrate the path followed to predict generic water chemistry for the proposed mine.
9.1.6 Step 5: Predict stream water chemistry Section 3.3 and Figure 10 provide an outline of the process for predicting water chemistry downstream of a mine drainage discharge. Information on mine drainage chemistry is integrated with information on site hydrogeology and background water quality using reactive transport modelling. Reactive transport modelling must be used because reactive components (both acid and neutral) are present in stream waters and mine drainage. For the proposed mine under typical conditions, dewatering and surface runoff from the pit are considered to produce a discharge of 100 L/s into the receiving environment (the river has a flow of 2000 L/s and pristine water quality). Based on the predicted chemistry (Section 9.1.5) and likely flow from the pit, mine drainage is likely to impact downstream water quality. However, reactive transport modelling undertaken by a qualified and experienced professional would provide more detailed information on the likely impact on water quality. In this case,
107
reactive transport modelling indicates that downstream water chemistry will be pH 3.4, Fe 9 mg/L, and Al 40 mg/L. A checklist for the steps involved in predicting downstream water chemistry is provided in section 3.4.
9.1.7 Step 6: Determine the ecological impact The ecological impact associated with the predicted downstream water chemistry is determined using Figure 12. The pathway to determine the potential impact associated with the hypothetical proposed mine using Figure 12 is shown in Figure 38. Predicted chemistry of receiving waters
Very low pH (pH < 4)
Low pH (pH 4 – 6)
Circum-neutral pH (pH > 6)
High metals (>2 mg/l of any metal)
Low metals (1 mg/l)
Minimal metals (0.2 mg/l)
Very low metals ( 10s of km2) and have similar characteristics such as age, composition, geological history and depositional environment.
Grazer
Organism primarily feeding on living algal tissue.
Hard rock gold
Gold in quartz veins and faults in basement rocks (greywacke, schist, granite, etc.).
Historical data
Environmental data that have been collected previously. This may include data from locations impacted by historical mine drainage or pristine sites.
HFO
Iron oxyhydroxides: A general name that includes a wide range of orange and brown iron oxide minerals (‘rust’), many of which are poorly crystalline. HFO forms naturally in the weathering environment, but can be enhanced by mining activity, and commonly accompanies AMD and CND. Also called ‘yellow boy’.
Hydrogeology
Physical and chemical movement in rocks.
Hydromining
Mining of coal using high pressure water jet to extract coal and gravity fluming to transport coal from the active mine face.
Iron oxyhydroxide
See HFO.
Kinetic test
Analysis method for released dissolved components from rock where the testing regime monitors changes in rock chemistry with time. Typically kinetic tests expose rocks to simulated weathering processes and analysis is completed on leachate.
Leaching
A chemical process for the extraction of valuable minerals from ore. Also, a natural process by which groundwaters dissolve minerals, thus leaving the rock with a smaller proportion of some of the minerals than it contained originally.
Macroinvertebrates
Organisms without backbones (e.g. worms, snails, insects and crustaceans) visible to the naked eye (generally > 500 µm in body length).
processes
of
water
135
Maximum potential acidity
A theoretical measure of the total amount of acid that can be released from a rock after complete oxidation. This is largely based on the amount of pyrite (iron sulphide) present in the rock. See section 2.3.2.
Mine drainage
Collective term for groundwater, surface water runoff, and mine process water at a mine site.
Mine waste
Collective term for mine tailings, mine water and mine waste rocks.
Macroinvertebrate Community Index A biotic index based on the relative abundance of specific aquatic macroinvertebrate genera. Non-acid forming (NAF)
See Acid mine drainage.
pH
A measure of the acidity or alkalinity of water, sediment or soil. The measure is based on the concentration of hydrogen ions and gives the negative logarithm of the hydrogen (H+) ion, corresponding to 10-7. A pH value of 7 is neutral. All values higher are considered alkaline, and all values lower are considered acidic.
Precipitation
The condensation of a solid from a solution.
Ore
A natural mineral deposit in which at least one mineral occurs in sufficient concentrations to make mining the mineral economically feasible.
Oxidation
A chemical reaction in which electrons are lost from an atom and the charge of the atom becomes more positive. Normally, oxidation involves the addition of atmospheric oxygen or water. Oxidation occurs concurrently with reduction.
Oxide minerals
A group of minerals whose fundamental unit is oxygen, O2-. The common cations in oxides include Cu2+, Mg2+, Al3+, Fe2+, Mn2+.
Oxides
See Oxide minerals.
Potentially acid forming (PAF)
See Acid mine drainage.
QMCI
Quantitative Macroinvertebrate Community Index, a biotic index based on the relative abundance of specific aquatic macroinvertebrate genera.
Reactive transport modelling
Chemical modelling to predict the partitioning of dissolved, solid, gaseous and adsorbed phases in aqueous environments. Commonly reactive transport modelling involves mixing water from different sources with different chemical compositions to assess the physiochemical conditions and concentrations in the downstream environment.
136
Residence time
Length of time mine water spends in a passive treatment system.
Shredder
Organisms that primarily feed on coarse particles (> 1 mm) of dead or decaying vegetation including both leaves and wood.
SQMCI
Semi-Quantitative Macroinvertebrate Community Index, a biotic index based on the relative abundance of specific aquatic macroinvertebrate genera.
Tailings
Unwanted rock residues discharged from a mine processing site, commonly stored on a mine site behind a dam.
Taxon
Short for taxonomic unit, and is a common unit of identification among similar individuals. Often used when different types of organisms are identified to different levels (e.g. some to species, some to genus). Plural taxa.
Toxicity
The extent to which a substance, typically a contaminant, can cause damage to an exposed organism.
Sulphate mineral
A mineral characterised by the bonding of a sulphate anion with a metal such as calcium, lead or copper. Sulphates may or may not include water in their structure. Common examples include gypsum (CaSO4·2H2O).
Sulphates
See Sulphate mineral.
Sulphide mineral
A metallic mineral characterised by the covalent bonding of sulphur with a metal or semi-metal, such as iron, copper, lead, or zinc. An example of a common sulphide mineral is pyrite, which has the chemical formula FeS2. Sulphide minerals occur in a wide range of geological environments.
Sulphides
See Sulphide mineral.
Suspended solids
A solid substance present in water in an undissolved state, usually contributing directly to turbidity
Total Suspended Solids (TSS)
The weight of material per volume of water and is reported in units of milligrams of suspended solids per litre of water (mg/L).
Toxicity
The inherent potential or capacity of a material to act on a group of selected organisms, under defined conditions. An aquatic toxicity test usually measures the proportion of organisms affected by their exposure to specific concentrations of chemical, effluent, elutriate, leachate, or receiving water.
Toxicity test:
The means by which the toxicity of a chemical
137
or other test material is determined. A toxicity test is used to measure the degree of response produced by exposure to a specific level of stimulus (or concentration of chemical). Trophic level
Functional classification of organisms according to their feeding relationships. The basal level consists the primary food resource (plants, algae, detritus), followed by herbivores, predators, etc.
Turbidity
Measure of the amount of light scattered by suspended particles in a sample, typically reported in units of nephelometric turbidity units (NTUs).
Unconformity
The boundary between a group of older rocks and a group of younger rocks – typically referred to in the context of alluvial gold. An unconformity normally represents a long time gap in the geological record, where uplift and erosion has occurred. Alluvial gold accumulates on unconformities during this erosion.
Waste rock
Rock that does not contain any minerals in sufficient concentration to be considered ore, but which must be removed in the mining process to provide access to the ore, but that has no immediate value itself and has to be stored on the mine site. Waste rock may be in situ, or excavated.
X-ray fluorescence
A common analytical method that determines the elemental composition of most substances to 1-10 ppm concentration level for most elements. XRF is mostly a laboratory-based analytical method, although field portable instruments are becoming more common. XRF does not analyse elements with lower atomic mass than fluorine.
138