run load balancing operations. This kind of scheme is often used in systems composed of workstations or servers where a global clock is not an inherent ...
Using a Diffusive Approach for Load Balancing in Peer-to-peer Systems Ying Qiao
Thesis submitted to the Faculty of Graduate and Postdoctoral Studies in partial fulfillment of the requirements for the PhD degree in name of program
Electrical and Computer Engineering Ottawa-Carleton Institute for Electrical and Computer Engineering School of Electrical Engineering and Computer Science Faculty of Engineering University of Ottawa © Ying Qiao, Ottawa, Canada, 2012
Abstract We developed a diffusive load balancing scheme that equalizes the available capacities of nodes in a peer-to-peer (P2P) system. These nodes may have different resource capacities, geographic locations, or availabilities (i.e., length of time being part of the peer-to-peer system). The services on these nodes may have different service times and arrival rates of requests. Using the diffusive scheme, the system is able to maintain similar response times for its services. Our scheme is a modification of the diffusive load balancing algorithms proposed for parallel computing systems. This scheme is able to handle services with heterogeneous resource requirements and P2P nodes with heterogeneous capacities. We also adapted the diffusive scheme to clustered peer-to-peer system, where a load balancing operation may move services or nodes between clusters. After a literature survey of this field, this thesis investigates the following issues using analytical reasoning and extensive simulation studies. The load balancing operations equalize the available capacities of the nodes in a neighborhood to their averages. As a result, the available capacities of all nodes in the P2P system converge to a global average. We found that this convergence is faster when the scheme uses neighborhoods defined by the structure of the structured P2P overlay network rather than using randomly selected neighbors. For a system with churn (i.e. nodes joining and leaving), the load balancing operations maintain the standard deviation of the available capacities of nodes within a bound. This bound depends on the amount of churn and the frequency of load balancing operations, as well as on the capacities of the nodes. However, the sizes of the services have little impact on this bound. In a clustered peer-to-
II
peer system, the size of the bound largely depends on the average cluster size. When nodes are moved among clusters for load balancing, the numbers of cluster splits and merges are reduced. This may reduce the maintenance cost of the overlay network.
III
Acknowledgement This is the place for me to formally express my gratitude to those who assisted me in this work. First, I give the greatest appreciation to my program supervisor at University of Ottawa: Professor Gregor von Bochmann. Since he decided to accept me in 2006, he had been stuck with me for so many years. He had to argue with me on my blurry thoughts. He had to read, comment, and modify my drafts that were vaguely written. Sometimes, he had to stay late in order to submit our papers before their deadlines at midnight. Now, he is free from all of these obligations. I also give my appreciation to Professor Shikharesh Majumdar at Carleton University. He was my supervisor when I studied in the master program at the Department of Systems and Computer Engineering at Carleton University. He encouraged me to continue doing research at that time. Now, I did it. During my study at the University of Ottawa, I met a lot of scholars. They were graduate students, post-doctors, or professors. Some of them I had lunch with, and some of them I worked for as a TA. Dr. Shah Asaduzzaman is the one with whom I worked on several papers. These people showed me the characters of a professional scholar. I give my appreciation to Mr. Brain Carroll, Dr. Ping Wu, Mrs. Suzanne Ruest, and Mr. Mike Jin. They were my supervisor, colleague, team leader or manager in Nortel. They are my role-models as an engineer. There were also other colleagues to whom I should be grateful.
IV
I give my appreciation to the University of Ottawa, Carleton University, and the City of Ottawa for the resources and facilities that I used during these years. I give my appreciation to my friends. They are Ms. Jiulin Yang, Ms. Hongyan Kuai, Dr. Libo Zhong, and Dr. Tao Zheng. I also give my appreciation to my friends in China: Ms. Zhao Liu, and Ms. Li Cheng. They kept me company during these years. I give my appreciation to my parents and sister and her family: Kuanyuan, Shengli, May and Dong. I always received support from them during these years. I promised my son Jeremy that I would give him some space in this thesis if he could stop sneaking his name on every page. He wrote the following piece of work only for this cause. “H2O means water. H is for Hydrogen and O is Oxygen. H2O is very important to the world. You could last 3 days without water. In dessert there is little water, so water is very, very, very precious.” Thanks to Hua and Jeremy.
V
Table of Contents 1.
2.
Introduction 1 1.1.
Motivation 1
1.2.
Objective 3
1.3.
Contribution 4
1.4.
Organization of the thesis 5
The structures and the characteristics of peer-to-peer systems 7 2.1.
Introduction 7
2.2. Unstructured peer-to-peer systems 10 2.2.1. Structures of overlay networks 10 2.2.2. Characteristics of P2P file sharing applications 12 2.3. Structured peer-to-peer systems 13 2.3.1. Organizations of overlay networks 13 2.3.2. Construction of overlay networks 17 2.4.
Cooperative File System (CFS) 21
2.5. Churn 23 2.5.1. What is churn? 23 2.5.2. Handling churn 25 2.5.2.1. 2.5.2.2.
3.
Overlay networks 25 Application data consistency 26
Load balancing techniques 28 3.1 Load balancing schemes 28 3.1.1 Different types of schemes 28 3.1.1.1. 3.1.1.2.
3.1.2. 3.1.2.1. 3.1.2.2. 3.1.2.3.
Static schemes 29 Dynamic schemes 30
Architecture 31 Centralized structure 32 Distributed structure 33 Topological structure 35
3.2. Diffusive load balancing schemes 38 3.2.2. Synchronous schemes 39 3.2.3. Asynchronous schemes 42 3.2.4. Characteristics 45 3.2.4.1. 3.2.4.2. 3.2.4.3.
Dealing with heterogeneous nodes 45 Working in dynamic systems 46 Comparison with other dynamic schemes 47
3.3. Techniques for peer-to-peer systems 49 3.3.2. Static techniques 50 3.3.3. Dynamic techniques 51 3.3.3.1.
Types of load placement 52
VI
3.3.3.2. 3.3.3.3. 3.3.3.4.
4.
Architecture 53 Load measure 55 Effectiveness 57
Diffusive load balancing for peer-to-peer systems 61 4.1.
Why choosing a diffusive load balancing scheme? 61
4.2. Design of the scheme 62 4.2.1. Load measure 62 4.2.1.1. 4.2.1.2.
4.2.2. 4.2.3. 4.2.3.1. 4.2.3.2. 4.2.3.3. 4.2.3.4.
Available capacity 62 Using available capacity as load measure 65
Load balancing operation 74 Decision algorithms 77 Proportional algorithm 78 Complete Balancing algorithm 79 Directory-Initiated algorithm 79 Sender-Initiated and Receiver-Initiated algorithms 80
4.3. Convergence and convergence speed 81 4.3.1. Analytical investigation 82 4.3.2. Simulation experiments 85 4.3.2.1. 4.3.2.2.
5.
A peer-to-peer system with a skip-list overlay network 86 Experiments and their results 88
Characteristics of the diffusive load balancing scheme 92 5.1. Using random neighborhoods 92 5.1.1. Random-graph structured overlay networks 93 5.1.2. Random walks 94 5.2.
Skewed workload distribution 96
5.3. Working in systems with churn 98 5.3.1. The bound of the standard deviation of available capacities 100 5.3.2. Varying churn rates 103 5.3.3. Nodes with heterogeneous capacities 105 5.4.
Scalability 106
5.5.
Comparison with other schemes for peer-to-peer systems 109
5.6. Dealing with large sized services 112 5.6.1. Homogeneous services 113 5.6.2. Heterogeneous services 117 5.6.3. The impact of the service sizes 119 5.7.
6.
Summary 123
Diffusive load balancing for clustered peer-to-peer systems 126 6.1.
Structure of a clustered peer-to-peer system 126
6.2.
Diffusive load balancing for clustered peer-to-peer system 130
6.3. Algorithms deciding load transfers 132 6.3.1. Decision algorithms 133 6.3.2. Effectiveness of the decision algorithms 136 6.3.2.1.
A clustered peer-to-peer system with a skip-list overlay network 136
VII
6.3.2.2. 6.3.2.3.
Convergence speed 138 The impact of cluster sizes 143
6.4. Load balancing through node migrations 148 6.4.1. Decision algorithms 149 6.4.1.1. 6.4.1.2.
6.4.2.
Handling homogeneous nodes 149 Handling heterogeneous nodes 154
Effectiveness of load balancing through node migration 158
6.4.2.1. 6.4.2.2.
6.5.
7.
The impact of cluster sizes 159 Nodes with heterogeneous capacities 162
Summary 166
Conclusion 168 7.1.
Summary 168
7.2.
Contributions 170
7.3.
Future work 171
Appendix A: Proof of convergence of asynchronous load balancing with local synchronism 174 A.1. Definition of load balancing 175 A.1.1. Partially asynchronous load balancing 176 A.1.2. Asynchronous load balancing with local synchronism 178 A.2. Proof of convergence 181 A.2.1. Assumptions A-1 and R-Bert-2 imply convergence 181 A.2.2. Assumptions A-1 and A-2 imply convergence 187
Appendix B 190 Reference: 192
VIII
List of Figures FIGURE 2.1 AN EXAMPLE OF A FILE DOWNLOADING PATH IN A FILE SHARING P2P APPLICATION 9 FIGURE 2.2 THE FINGER TABLE AT NODE 0 AND ITS CONNECTIONS IN RING TOPOLOGY 15 FIGURE 2.3 AN EXAMPLE OF THE FILE STRUCTURE AND BLOCK DISTRIBUTION OF A FILE IN CFS 22 FIGURE 4.1 THE STATE DIAGRAM OF THE LOAD BALANCING PROCEDURE 76 FIGURE 4.2 THE DECISION PROCEDURE OF THE DI ALGORITHM 80 FIGURE 4.3 THE DECISION PROCEDURE OF THE SI ALGORITHM 81 FIGURE 4.4 THE CONNECTIONS OF NODE0 IN THE OVERLAY WITH A SKIP-LIST STRUCTURE: (A) THE FINGERS OF NODE0, (B) THE ROUTING TABLE OF NODE0 87 FIGURE 4.5 THE PROGRESS OF THE DIFFUSIVE LOAD BALANCING WITH VARIOUS DECISION ALGORITHMS: (A) STANDARD DEVIATION OF NORMALIZED AVAILABLE CAPACITIES, (B) CONVERGENCE RATIO, AND (C) PROPORTION OF LOADS TRANSFERRED 89 FIGURE 5.1 THE CONVERGENCE RATIOS OF THE DIFFUSIVE LOAD BALANCING IN THE OVERLAY NETWORK WITH A RANDOM-GRAPH TOPOLOGY 94 FIGURE 5.2 THE CONVERGENCE RATIOS OF THE DIFFUSIVE LOAD BALANCING WITH RANDOM NEIGHBORS 96 FIGURE 5.3 COMPARISON OF THE DI AND SI ALGORITHMS IN SYSTEMS WITH HOT SPOTS 97 FIGURE 5.4 EFFECTIVENESS OF THE DIFFUSIVE LOAD BALANCING IN A SYSTEM WITH CHURN AT A RATE OF 0.1, (A) STANDARD DEVIATION OF NORMALIZED AVAILABLE CAPACITIES, AND (B) PROPORTION OF LOADS TRANSFERRED 103 FIGURE 5.5 THE BOUND OF THE STANDARD DEVIATION OF AVAILABLE CAPACITIES IN SYSTEMS WITH VARYING CHURN, (A) THE STANDARD DEVIATION OF NORMALIZED AVAILABLE CAPACITIES, AND (B) PROPORTION OF LOADS TRANSFERRED 103 FIGURE 5.6 EFFECTIVENESS OF THE DIFFUSIVE LOAD BALANCING IN THE HETEROGENEOUS NODE SYSTEM WITH CHURN AT A RATE OF 0.1 106 FIGURE 5.7 SCALABILITY OF THE DIFFUSIVE LOAD BALANCING IN SYSTEMS WITHOUT CHURN: (A) CONVERGENCE RATIOS (B) PROPORTION OF LOADS TRANSFERRED BETWEEN NODES 108 FIGURE 5.8 SCALABILITY OF THE DIFFUSIVE LOAD BALANCING IN SYSTEMS WITH A CHURN RATE OF 0.1 OR 0.9, (A) STANDARD DEVIATION OF NORMALIZED AVAILABLE CAPACITIES, (B) PROPORTION OF LOADS TRANSFERRED 108 FIGURE 5.9 THE CONVERGENCE RATIOS OF THE RANDOM PROBING SCHEME 112 FIGURE 5.10 THE DIHOMOSERVICE ALGORITHM: (A) THE DECISION PROCEDURE, (B) THE SELECTION FUNCTION 115 FIGURE 5.11 THE DIHETEROSERVICE ALGORITHM: (A) THE SELECTION FUNCTION, (B) THE SEGMENT REPLACING LINES 10 AND 11 OF THE DECISION PROCEDURE IN FIGURE 5.10(A). 118 FIGURE 5.12 LOAD BALANCING IN A SYSTEM WITH CHURN: (A) THE STANDARD DEVIATION OF AVAILABLE CAPACITIES WHEN CHURN RATE IS 0.1; (B) THE NUMBER OF LOAD TRANSFERS WHEN CHURN RATE IS 0.1; (C) THE STANDARD DEVIATION OF AVAILABLE CAPACITIES OF NODES WHEN CHURN RATE IS 0.9; (D) THE NUMBER OF LOAD TRANSFERS WHEN CHURN RATE IS 0.9. (NOTE: “HOMO” IS FOR HOMOGENEOUS SERVICES, “HETERO” IS FOR HETEROGENEOUS SERVICES, “SMALL” IS FOR SERVICES WITH SMALL RESOURCE USAGE, AND “LARGE” IS FOR SERVICES WITH LARGE RESOURCE USAGE) 122 FIGURE 6.1 THE DECISION PROCEDURE OF THE DICLUSTSERVICE ALGORITHM 135 FIGURE 6.2 AN EXAMPLE OF A CLUSTERED PEER-TO-PEER SYSTEM: (A) THE SKIP-LIST OVERLAY NETWORK CONSTRUCTED BY INTER-CLUSTER CONNECTIONS, (B) THE ROUTING TABLE OF A NODE IN CLUSTER0 137 FIGURE 6.3 THE EFFECTIVENESS OF THE SCHEME ON NODES OR CLUSTERS IN A CLUSTERED SYSTEM WITH D=8, AND C=512: (A) STANDARD DEVIATION OF AVAILABLE CAPACITY AND (B) CONVERGENCE RATIO IN THE SYSTEM WITHOUT CHURN, (C) THE STANDARD DEVIATION OF AVAILABLE CAPACITIES OF THE SYSTEM WITH CHURN RATE=0.1 OR 0.9 142 FIGURE 6.4 THE EFFECTIVENESS OF THE SCHEME IN SYSTEMS WITH DIFFERENT NUMBERS OF CLUSTERS: (A) CONVERGENCE RATIO AND (B) PROPORTION OF SERVICES MOVED IN SYSTEMS WITHOUT CHURN, (C) STANDARD DEVIATION OF REMAINING AVAILABLE CAPACITY AND (D) PROPORTION OF LOADS TRANSFERRED IN SYSTEMS WITH CHURN RATE OF 0.1 AND 0.9, RESPECTIVELY 144 FIGURE 6.5 THE EFFECTIVENESS OF THE SCHEME IN SYSTEMS WITH THE SAME NUMBER OF CLUSTERS (E.G. C=512) AND DIFFERENT CLUSTER-SIZE PARAMETERS: (A) CONVERGENCE RATIO AND (B) PROPORTION
IX
OF LOADS TRANSFERRED IN SYSTEMS WITHOUT CHURN, (C) STANDARD DEVIATION OF AVAILABLE CAPACITIES AND (D) PROPORTION OF LOADS TRANSFERRED IN SYSTEMS WITH CHURN RATE OF 0.1 OR
0.9 145 FIGURE 6.6 THE DECISION PROCEDURE AND THE SELECTION FUNCTION OF THE DICLUSTHOMONODE ALGORITHM (A) THE DECISION PROCEDURE, (B) THE SELECTION FUNCTION 151 FIGURE 6.7 THE DECISION PROCEDURE AND THE SELECTION FUNCTION OF THE DICLUSTHETERONODE ALGORITHM (A) THE DECISION PROCEDURE, AND (B) THE SELECTION FUNCTION 157 FIGURE 6.8 THE STANDARD DEVIATION OF AVAILABLE CAPACITIES OF THE SYSTEMS USING VIRTUAL NODES OR WITHOUT (A) CHURN RATE EQUAL TO 0.1 AND (B) CHURN RATE EQUAL TO 0.9 164 FIGURE A. 1 THE TIMES WHEN ACTIONS OF LOAD BALANCING ARE CONDUCTED FIGURE A. 2 THE ACTIONS FOR LOAD BALANCING DEFINED BY ASSUMPTION BERT-1 FIGURE A. 3 THE LOCAL SYNCHRONISM DEFINED BY ASSUMPTION A-1
176 177 180
X
List of Tables TABLE 5.1 TYPICAL LOAD BALANCING SCHEMES IN P2P SYSTEMS 110 TABLE 5.2 RESULTS FOR THE DIHOMOSERVICE AND DIHETEROSERVICE DECISION ALGORITHMS WITH SKIPLIST OVERLAY NEIGHBORHOOD 121 TABLE 6.1 EFFECTIVENESS OF THE DIFFUSIVE LOAD BALANCING IN SYSTEMS WITH VARIOUS CLUSTER SIZES (C=512) 160 TABLE 6.2 COSTS CAUSED BY LOAD BALANCING IN THE HETEROGENEOUS SYSTEMS 165 TABLE B. 1 THE EFFECTIVENESS OF THE SCHEME IN SYSTEMS WITH VARIOUS NUMBERS OF CLUSTERS WHEN 190 MOVING NODES WITH HOMOGENEOUS CAPACITY, SYSTEMS WITHOUT CHURN, AND D=8 TABLE B. 2 THE LOAD VARIANCE AND THE NORMALIZE LOAD VARIANCE OF THE SYSTEMS WITH DIFFERENT WORKLOAD FACTORS 190 TABLE B. 3 THE EFFECTIVENESS OF THE DIFFUSIVE LOAD BALANCING IN SYSTEMS WITH NODE CAPACITIES EQUAL TO 10 AND 20 REQUESTS/SECOND, RESPECTIVELY, C=1024, D=8 191 TABLE B. 4 THE CONVERGENCE OF THE SCHEME IN THE SYSTEMS WHERE NODE CAPACITIES FOLLOW A PARETO DISTRIBUTION 191
XI
1. Introduction 1.1. Motivation We study a diffusive load balancing technique that improves the performance of peerto-peer systems. A peer-to-peer (P2P) system is a distributed computing system. The nodes in the system are called P2P nodes, and they are computers that run the software programs realizing the functions of the P2P systems. These functions allow end-users to access their shared objects (e.g. data, audio or video files) or resources (computing power, network bandwidth) in the form of services. While using these services, end-users expect that their requests should have short response times. However, in a P2P system, the response times of services are not guaranteed. A load balancing technique that unifies the performance of services would therefore be useful for P2P systems. It is not easy for a P2P system to provide services with a uniform response time. The difficulty comes from three points. First, the services on the nodes have diverse service times and request rates. The shared objects in a P2P system differ in their sizes. For example, normally, audio files are smaller than 10 Mbytes, and video files are larger than 100 Mbytes [Gummadi2003]. Services used for accessing these shared objects on a P2P node have different service times. These shared objects also have different numbers of requests. For example, the majority of requests (e.g. 91%) are for downloading audio files. Because of these diversities, the workloads on nodes are largely heterogeneous. Second, P2P systems are composed of computers connected to the Internet. These computers are largely diverse. Some of these computers are low-capacity personal 1
computers with small CPU processing powers, slow network speeds, and small storage spaces. Some of them are high-capacity server computers. These computers are also different in their geographic locations and the durations of being on line. For example, the measurements from some P2P systems (e.g. P2P file sharing applications like Gnutella) showed that the on-line duration of P2P nodes follows a Pareto distribution with a heavy tail [Saroiu2003]. Third, P2P systems do not have any component dealing with the heterogeneity of their nodes or services. The nodes in a P2P system construct an overlay network. These nodes select their neighbors either randomly (e.g. those neighbors in an unstructured overlay network) or according to the associations between their data (e.g. those neighbors in a structured overlay network). They also provide a distributed lookup service that locates the shared objects for the end-users. Measurements showed that an overlay network can include up to millions of nodes. However, according to Castro et al., the general overlay network does not consider the heterogeneity of resources while constructing the overlay network or routing lookup messages [Castro2005]. Therefore, the requests of the end-users of a P2P system could have largely diverse response times. For example, the requests of some services experience long delays since these services are on heavily loaded nodes. Meanwhile, the requests of some other services are answered quickly by nodes that are close to idle. Also, the mean response time of a service could vary from time to time. One challenge of a P2P system is to effectively guarantee the service quality it provides. Our research aims at improving the performance of P2P systems by using a load balancing technique. Therefore, the shared objects of a P2P system can always be located
2
at nodes with enough resources for them, and the requests for accessing these objects can have a uniform response time.
1.2. Objective We study a diffusive load balancing technique in this thesis. For a P2P system using this technique, the performance of its nodes, that is, the mean response time of its services, would become similar. Load balancing schemes, such as [Zhu2005, Surana2006, Shen2007 and Vu2009], are proposed to dynamically reallocate nodes or shared objects in P2P systems so that these systems could serve more service requests during a time unit. The services accessing shared objects could have their mean response times reduced. Using distributed approaches, these schemes are scalable to the sizes of P2P systems. Some schemes use a specific structure of the overlay network for load balancing (for example, the tree structure). These schemes can not be deployed in an overlay network with another kind of structure. Some schemes construct a structure based on the P2P overlay networks for load balancing (e.g. the schemes in [Zhu2005 and Vu2009]). These schemes require P2P nodes to maintain extra connections only for load balancing. Or, some schemes use random walks (e.g. in [Shen2007]) to select neighbors for their load balancing operations. However, this kind of random walks adds extra messages to a P2P system. Diffusive load balancing techniques, originally proposed for parallel computing systems that have a massive number of processors, are a good candidate for P2P systems. This kind of technique uses the connections between nodes for its operations. Compared with other techniques proposed for P2P systems, such a technique neither sets up extra
3
connections between nodes nor spends a large number of messages on random walkers in a system. However, in order to work in a P2P system, a diffusive scheme has to be redesigned. Our research deals with the following four issues. First, the diffusive scheme should improve the response times of services instead of speeding up parallel computing programs. Second, its load balancing operations should be effective in an environment where nodes may suddenly join or leave. Third, it has to deal with nodes whose capacities are heterogeneous and services whose resource requirements are diverse. Fourth, the diffusive scheme is also expected to work in a clustered P2P system. Because of these issues, the diffusive scheme developed in this thesis is different from those for parallel computing systems.
1.3. Contribution This study provides the following contributions: 1) We proposed a load balancing scheme for P2P systems. The scheme realizes a diffusive load balancing algorithm, which is a modification of those used for parallel computing systems. We call it asynchronous algorithm with local synchronism for load balancing. We demonstrate that, using this scheme, a P2P system has the performance of its node approaching the average. We say that this scheme converges. 2) We studied the convergence speeds of this scheme when using different decision algorithms. These algorithms decide load transfers between nodes. The scheme
4
converges most quickly when a node uses a directory-initiated algorithm which works as a local directory for a neighborhood. 3) We extended the directory-initiated algorithm with extra features to handle services with heterogeneous resource requirements. We observed that the effectiveness of the scheme depends on whether the system hosts services with homogeneous
resource
requirements
or
with
heterogeneous
resource
requirements. 4) We further extended the directory-initiated algorithm such that it could perform load balancing for clustered peer-to-peer (clustered P2P) systems. Two types of directory-initiated algorithm are designed for this purpose. In one case, services are moved between clusters. In another case, nodes are moved between clusters.
1.4. Organization of the thesis In Chapter 2, we review the possible architectures and characteristics of workloads of P2P systems. In Chapter 3, we survey load balancing techniques proposed for distributed computing systems, diffusive load balancing techniques for parallel computing systems, and load balancing techniques for P2P systems. In Chapter 4, we describe the proposed diffusive load balancing scheme and its algorithms; we also evaluate the effectiveness of the diffusive load balancing scheme by simulation experiments. In Chapter 5, we investigate the effectiveness of the diffusive load balancing in a system with various characteristics such as random neighborhoods, churn (i.e. node joining or leaving in a P2P systems), and services with heterogeneous resource requirements. In Chapter 6, we
5
extend the diffusive load balancing scheme to clustered P2P systems. We conclude in Chapter 7.
6
2. The
structures
and
the
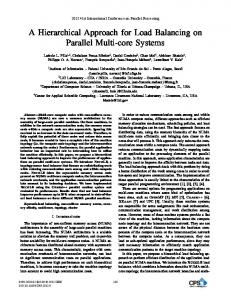
characteristics of peer-to-peer systems 2.1. Introduction We present the kinds of architectures and the characteristics of P2P systems in this chapter. Our research is based on this knowledge. Peer-to-peer (P2P) systems are composed of computer nodes connected to the Internet. These computers are either low-capacity personal computers of end-users, or high-capacity computers of service providers in the Internet. A computer becomes a “peer-to-peer node” or “node” in a P2P system by a joining procedure. A P2P node locally stores the IP addresses of its neighbors and communicates with them through messages over the transport layer of the Internet. For example, Pastry nodes communicate with TCP (Transmission Control Protocol) messages, and Chord nodes use RPC (Remote Procedure Call) messages. The connections for transmitting these messages between two nodes are called “peer-to-peer connections”, or simply “connections”. A P2P system has a platform and applications. Its platform is called P2P overlay network; it is constructed by the P2P nodes using the connections between these nodes. An application on this platform is called a P2P application. Such an application, like file downloading (e.g. eDonkey [Tutschku2004]), video streaming (e.g. PPLive [Vu2007]), 7
or distributed databases, contains the running processes of software programs for users to access the shared objects, such as files, network links, or storage spaces, on P2P nodes. These running processes provide two kinds of services. One kind is for users to access shared objects, and they are called application service. Another kind of processes are used to locate the nodes that store shared objects; their service is called lookup service. Figure 2.1 demonstrates a typical scenario where a user downloads a file by using a file sharing application. At the beginning, a user invokes a running process of this application by running its software program on his computer (shown at the bottom level of the figure). At the beginning, this computer joins the overlay network and becomes P2P node A (shown at the middle level). The user looks for a file by issuing a request to the running process of the P2P application on node A. In response to this searching request, node A uses the lookup service of the P2P application to send a file lookup message to its neighbors: nodes B and C; then, node B forwards the message to D. Node D locates the file in its local file system and sends a replying message to A. At the end, node A uses the file downloading service provided by the P2P application to download the file from D to A (shown at the top level). P2P systems are large-scale distributed computing systems. In this chapter, we discuss two types of decentralized P2P systems. One type is called unstructured P2P system, and another type is called structured P2P system [Lv2002]. We review them from the perspectives of the structures of their overlay networks and the characteristics of their applications. First, unstructured P2P systems are presented. Then, we discuss some typical structured P2P systems, and a file storage system deployed on such a structured P2P system. Churn represents the dynamics changes in the overlay network where nodes
8
join and leave frequently. Churn is a major factor in P2P systems. At the end of this chapter, we present the notations and definitions of churn, and the characteristics that have been discovered from real systems. We also discuss the techniques used by P2P systems to handle churn.
Figure 2.1 An example of a file downloading path in a file sharing P2P application
9
2.2. Unstructured peer-to-peer systems Unstructured P2P systems are deployed for file sharing applications in the Internet, including Gnutella, and KaZaa. These applications provide file sharing services like file searching or downloading. File searching services are also called distributed lookup services which locate shared objects on nodes. File downloading services are used by users to access these shared objects. According to Lv [Lv2002], in systems of this kind, the placements of shared objects (i.e. files for these file sharing applications) are “not based on the knowledge of topology” of the overlay networks. The performance of their services, including file downloading services and lookup services, largely depends on the characteristics of their structures and of their shared objects (e.g. the sizes or the numbers of requests of these objects).
2.2.1. Structures of overlay networks The overlay network of a P2P file sharing application has a flat or a hierarchical structure. In a flat overlay network, a node connects to its neighbors that are chosen at random. For example, the original Gnutella uses this kind of overlay network. The file discovery service (i.e. lookup service) on a Gnutella node broadcasts file lookup messages to all its neighbors. FastTrack [Liang2006] adopts a hierarchical structure with two tiers. Peers are classified as Super Nodes (SN) or Normal Nodes (NN). An NN only connects to one SN, and it publishes the metadata of its shared files at that SN. SNs in a FastTrack system are connected into a network, and they resolve lookup messages among themselves.
10
It was questioned whether an unstructured P2P system is able to maintain a network in the case that there is a large number of nodes joining or leaving (i.e. the resilience and robustness of an overlay network). Measurements showed that an unstructured file sharing application like Gnutella is resilient and robust. For instance, in the case that a peer is allowed to have at most 20 neighbors, a flat Gnutella could be partitioned only when more than half of the peers (e.g. 60%) are removed [Saroiu2002]. Research also showed that the systems using hierarchy architecture could have their resilience and robustness improved. For example, in a FastTrack, in the case that an SN periodically exchanges the information of 200 SNs with around 40 other SN neighbors, the SN could be always connected to the network [Liang2005]. Furthermore, Stutzbach et al. [Stutzbach2005] show that, in a hierarchical Gnutella, super peers with long online durations tend to build connections among themselves. Therefore, the core network composed of these super peers is highly stable and resilient, and it experiences little partitions even when the network is highly dynamic. Similar to Gnutella, BitTorrent systems are unstructured P2P systems that have a flat architecture. Their applications, for example, PPlive, allow nodes to exchange blocks of video files rather than to forward messages for searching shared files through the connections in their overlay networks. Several techniques are used in these systems to improve their performance. For example, among its 40 neighbors, an active node uses the “rarest first” policy to download the rarest block and the “tit-for-tat” strategy to choose up to 5 nodes for uploading its own blocks. These techniques increase the chance of a node to upload file blocks while preventing the “free-riding” scenario. Through these
11
techniques, the fairness of the file downloading service and the utilization of the connections are increased. However, a BitTorrent system has central components, and the reliability of the downloading services for its shared files highly relies on these central components. One of these components is a centralized directory (normally a Web server) that stores a list of shared files and their “.torrent” files. The users of the system search this server for shared files, and they download the “.torrent” files for their peer nodes to find the addresses of trackers. The tracker of a shared file records all of peer nodes that are downloading the shared file in the same overlay network. A peer node finds its neighbors there. For a BitTorrent system, when its directory has failed, no new peer node could find an overlay network to join. For a shared file, when its tracker fails, no new peer node could find neighbors. Furthermore, a tracker requires large bandwidth (e.g. up to the order of GBytes each day). When these large bandwidths can not be guaranteed in the Internet, the performance of the downloading services for shared files is impacted.
2.2.2. Characteristics of P2P file sharing applications The characteristics of P2P file sharing applications have been studied in terms of the types, numbers of requests (i.e., file popularity), and localities of shared files. Most shared files in Kazaa and Gnutella are multimedia files, such as audio or video files ([Chu2002] and [Fessant2004]). According to [Gummadi2003], the majority of the requests (e.g. 91%) are for downloading small sized audio files (e.g. with sizes less than
12
10 Mbytes); however, more than half of the network bandwidth (e.g. 65%) is spent on the transferring of the video files with sizes usually larger than 100 Mbytes. Also, the popularity of the files in a hierarchical Gnutella follows a distribution with a large variance (e.g. a Zipf distribution), where 80% requests ask for 10% of the files [Zhao2006]. Zhao further indicated that the popularity of files varies 5% at different times of the day. Meanwhile, Lloret observed that the popularities of files are varied in a cosine waveform function with the time of the day [Lloret2006]. Furthermore, the location of files is correlated to the geographic places. For example, in Europe, if two peers in the same country have a small number of common files, the probability for them to have another common file is as large as 80% [Fessant2004].
2.3. Structured peer-to-peer systems A structured peer-to-peer (structured P2P) system is a “decentralized object location and routing infrastructure” for locating shared objects in a distributed manner [Kubiatowics2003]. The placements of shared objects are “not at random nodes but at specified locations that will make subsequent queries easier to satisfy” [Lv2002]. In this section, we describe some typical systems of this kind in terms of the organizations and construction of their structures.
2.3.1. Organizations of overlay networks A structured P2P system is defined by three components: the associations between shared objects and nodes, the overlay network constructed by the connections or associations between nodes, and a lookup procedure that locates the shared objects (i.e. a 13
lookup service). These components work together. We present the structures of these systems in terms of these components as follows. Some structured systems implement a Distributed Hash Table (DHT). Like an element in a hash table, a shared object in a DHT has an object key and an object value. The object key is hashed into a hashed key in a numerical space by a function (e.g. the SHA-1 used in Chord [Stoica2001], Pastry [Rowstron2001] or Tapestry [Zhao2004]). Like a bucket in a hash table, a node in a DHT stores shared objects. A node is assigned a unique ID in the same space where the hashed keys are; this ID is generated by the same function that hashes the node’s IP address. Then, a DHT defines an association between the keys of objects and the IDs of nodes; based on this association, the lookup service can locate nodes while searching shared objects. For example, Chord positions nodes in a ring by the ascending order of their node IDs. A node is responsible for the objects whose hashed keys locate in the range between its predecessor’s ID and its own ID. Accordingly, an object is stored on the first node whose ID is following its hashed key in the clockwise direction. Pastry stores an object on the node whose ID is closest to its hashed key, and Tapestry stores an object on the node whose ID has the longest common prefix with its hashed key. In a DHT system, a node connects to some other nodes (called neighbors) according to the associations of their node IDs. Each node has a routing table storing the IP addresses of its neighbors. DHT systems define their routing tables differently. A node in Chord has a one-column table, and its neighbor at row i is the first node whose ID is larger than 2i +1 . Figure 2.2 is a modified version of Figure 3 in [Stoica2001]. The figure shows the fingers (i.e., connections) and the finger table (i.e., the routing table) of node 0
14
on an 8-node ring network. Node 0, 1, 3 are the nodes that currently exist in the overlay network. For example, the routing table of node 0 has the IP address of node 3 in row 2 since node 3 is the first node whose ID is larger than 21 . In Pastry, a node has a l × d routing table, where l is the number of digits in a node ID and d is the numerical
base used for node IDs. The entry of < i, j > of a routing table is the IP address of a neighbor node whose ID shares the same i -digit prefix with the ID of the current node, and has a value j at the digit i + 1 . A Tapestry node has a routing table similar to that of a Pastry node. However, nodes at the same row of a routing table are at the same level in the tree topology.
20 [ 21 ,22 ) [ 2 2 ,2 3 )
Figure 2.2 The finger table at node 0 and its connections in ring topology
Nodes in a DHT system use a lookup service to locate nodes that store shared objects. For a user’s query request for a shared object, a lookup message is created, and the message contains the hashed key of the object. The lookup message is forwarded or routed by the nodes of a DHT system. The lookup service on a node is invoked first right after the node receives a lookup message. The hashed key of the shared object is examined. Then, the node decides whether to forward the message to the next hop or not. For example, in Chord, in the case that the hashed key is between its own ID and the ID of its successor, a node locates its successor as the object’s host node. The node replies
15
the lookup message with the ID of its successor. Otherwise, the node chooses a node from its routing table to be the next hop of the lookup message. The chosen node has the largest ID among the nodes whose IDs are smaller than the hashed key. After a forwarding step, the distance between the positions of the lookup message and of the host node is reduced at most by half. Therefore, it takes O (log N ) steps on average for the
lookup service of a Chord to locate the node that stores a shared object. Pastry and Tapestry have lookup services similar to that of Chord. In addition to a routing table, a Pastry node maintains a leaf set that stores the nodes whose IDs are in a numerical range around its own. While performing the lookup service for a lookup message, a Pastry node directly forwards the message to the host node, in the case that the hashed key of a lookup message is in the scope of the nodes in its leaf set. Otherwise, the node picks from its routing table the next hop whose node ID has one more digit that matches the key. Matching one digit of a hashed key at a hop, Pastry’s lookup service resolves lookup messages in O (log b N ) hops (where b is the base used for representing the hash keys and node IDs) on average. The Content-Addressable Network (CAN) [Ratnasamy2001] is a structured P2P system without implementing a DHT. A CAN system has a torus topology in d dimensional Cartesian space. The object key of a shared object is mapped into a point in this space. The d -dimensional space is partitioned into zones, and each zone can be identified by a vector with d -dimensional coordinates. A node takes charge of a zone and stores the shared objects whose key points are located in that zone. A node has a routing table with 2 d neighbors whose coordinates are only different from its own at one dimension. When a node receives a lookup message, its lookup service examines the
16
contained key point of the searched object. In the case that the key point is in its own zone, it returns itself as the host node. Otherwise, from its routing table, the node forwards the lookup message to the next hop whose coordinate is the closest to the point. With a d torus topology, CAN requires O (dN
1
d
) steps for one lookup message on
average. Some non-DHT structured P2P systems are proposed to support range queries. For example, Mercury orders nodes in a ring according to the ascending order of their names, and objects are stored on these nodes according to the order of their values. A node can build associations with other nodes in different positions on the ring. These systems can support range query functions, where shared objects can be found through locating the two ends of the range specified in a lookup message. The structures of structured P2P systems are often similar to the data structures that store data elements and support the access to these elements; for example, Chord is similar to a skip-list, Tapestry and Pastry implement a tree, or CAN implements a ddimensional torus. Structures other than those described above are also proposed in literature; for example, a butterfly network is used by Viceroy [Malkhi2001], a skip list by GosSkip [Guerraoui2006], and a de Bruijn graph by Koorde [Kaashoek2003]. Bochmann et al. [Bochmann2007] presented and analyzed the architectures of several structured P2P systems in detail.
2.3.2. Construction of overlay networks The previous subsection reveals that the overlay network of a structured P2P system is constructed according to the associations of nodes (e.g. the associations of their node
17
IDs or associations of their shared objects). Since nodes frequently join or leave a peerto-peer system, theses associations are frequently changed. Therefore, an overlay network has to be updated to reflect these changes from time to time. There are two issues a structured P2P system should deal with for a newly joined node. The first issue is that the new node should locate its position in the overlay network and find its neighbors. In Chord, a new node locates its position in the ring by looking up its own ID in the system. The new node regards the node that hosts (i.e. takes charge of) the key equal to its own ID as its successor, and takes over the predecessor from the successor. Then, the new node looks up its neighbors that take charge of the beginning point of each entry of its routing table. In a Pastry, a new node issues a “join” message that contains the new node’s ID first. The “join” message is routed in the overlay network. When the message arrives to a node, the visited node will let the new node copy one row from its own routing table. For example, Row r is copied in the case that the ID of the new node shares the r-digit prefix with the ID of the visited node. Using the “join” message, the new node locates itself besides the host node that takes charge of its ID. At the end, the new node composes its own leaf set table through referring the leaf set of the host node. Tapestry has a node joining procedure similar to that of Pastry; however, it selects its routing table entries at row i from all of the nodes that should be at that row. The second issue is that a new node has to be included into the routing tables of some other nodes. In Chord, a new node notifies other nodes to update the associations in their routing tables. A new Pastry or Tapestry node notifies its presence to nodes it knows so that they could update their tables. In the case that there are multiple nodes that could be filled in an entry of its routing table, a node in Pastry or Tapestry chooses the closest one.
18
The proximity is decided according to a metric measurement, either the geographic distance, or the Internet distance measured in number of hops. A new node in a CAN system uses simpler ways to deal with the above issues. A new node picks a point P as its ID at random and searches the ID through a bootstrapping node in the overlay network first. After the host node hosting of this ID is located, the host node transfers the responsibility of half of its zone to the new node. Then, the new node selects its own neighbors from the host node’s routing table and notifies these neighbors of its presence. A structured P2P system should also update its overlay network when nodes leave. Nodes periodically exchange maintenance messages between them. A node detects a node leaving in the case that several consecutive messages are lost, and invokes a repairing procedure to find a replacement. For example, a Pastry node sends heart-beat messages to its neighbors. While finding a replacement for a leaving neighbor, a node asks its other neighbors to report their own neighbors and selects a suitable node from them. In Tapestry, when a node detects that an entry at a level is empty, the node will find a replacement from all nodes at that level. A CAN node sends soft-state messages to its neighbors, including the coordinates of its own zone, a list of its neighbors, and their coordinates. A CAN node will select a node whose zone has the smallest volume to take over the pointes of a leaving node, and the node will notify all of its neighbors after the takeover. A Chord node also periodically checks the status of its neighbors. In the case that a neighbor is leaving, the node locates its replacement by issuing a lookup message. A structured system should be able to maintain the overlay network when nodes join and leave frequently. Nodes in some structured systems have redundant neighbors. In
19
Chord, a node keeps the states of its k consecutive successors in the ring. A node also periodically runs a stabilization procedure that checks the on-line state of its immediate successor. In the case that the immediate successor leaves, a node would take the next as its immediate successor without any extra cost. Research indicates that, when k is set to O (log N ) , the Chord ring is able to be connected even when half of the nodes are
leaving, and the number of nodes a lookup message travels is still kept to O (log N ) on average. In Tapestry, there are multiple nodes for an entry of a routing table. Any one of these nodes could be chosen as the next hop of a lookup message. Also, a structured P2P system has to deal with the missing of the shared objects on leaving nodes. In some cases, a node leaves an overlay network by a leaving procedure. The node notifies its neighbors of its leaving, and hands over the responsibility of its shared objects to its immediate successor. In other cases, a node leaves without notice (e.g. in the case that of a node failure or just a leaving). After detecting a neighbor’s leaving of this kind, a node notifies the applications on the top and lets them recover the lost objects. Pastry allows applications to replicate shared objects on the nodes in the leaf sets of their host nodes. In the case that one replica is lost due to its node’s failure, the application recovers the replica on a replaced node. Tapestry and CAN systems let an application periodically publish the index items of their shared objects. Moreover, Tapestry replicates an index item on the nodes in its publishing path. The republishing of the index items guarantees that the information of these shared objects is always available in a system whose nodes change frequently.
20
2.4. Cooperative File System (CFS) The Cooperative File System (CFS) is a P2P read-only file storage system [Dabek2001]. The system demonstrates the integration of a P2P application with a structured overlay network. It adopts several techniques to improve the reliability and performance of its file downloading services. A CFS has a file structure similar to that of the UNIX V7 file system; but the blocks of its files are distributed in storage spaces at peers rather than in a local disk of a computer. It is composed of two layered components: DHash and Chord. DHash is the application that organizes files and calls the interfaces of Chord to manage the file blocks on the nodes. Chord manages the DHT overlay network and provides the interfaces that implement the distributed object lookup services, for instance, put(key, block) for storing a block, and get(key,block) for retrieving a block. A key is the hashed key generated by a function according to the content of a block. Figure 2.3 shows the file structure of a CFS and the distribution of the blocks of a file in the Chord network. In this example, each file block is replicated on the next 3 consecutive successors of its host node. In the case that a node storing a block leaves the overlay network, Chord notifies DHash of the loss of the replica. Then, DHash places a new replica on the next consecutive successor. A client may download a block from any of its replicas. Using replicas, CFS provides reliable file downloading services to its clients.
21
Chord ring B2 B2
CFS file structure inode block
B2
Dhash data block B1
B2
B2 ... B1
...
B1 B1 B1
Figure 2.3 An example of the file structure and block distribution of a file in CFS
CFS improves the file downloading speed by the techniques described as follows. First, a client may choose the best among the replicas for file downloading. Second, DHash divides a file with a large size into multiple blocks and stores these blocks on different host nodes. In this way, the blocks of a file can be downloaded at the same time. Third, CFS adopts a simple load balancing technique. CFS allows a physical node to host multiple virtual servers, and a virtual server contains multiple file blocks. Each virtual server has a unique ID, and virtual servers are connected into Chord according to their IDs. In the case that a physical node is overloaded, it deletes some of its virtual servers, and let the DHash recover them on other nodes. Using the simple load balancing technique, the variation of file downloading speeds is reduced. This variation is caused by the heterogeneity of the storage disks or network links on nodes. Fourth, similar to the techniques that use Web-cache to improve the performance of a Web-server, DHash copies the blocks of popular files on the nodes along the lookup paths of these files. A lookup message for a block may find a hit earlier before it reaches its destination node. Experiments showed that a CFS system is scalable to thousands of nodes. Also, its operations are efficient, and its file downloading services are competitive. The experiments use computer nodes in the Internet. The CFS can achieve a file downloading
22
speed better than that of the file downloading using TCP. Also, the variance of download speed in the CFS is smaller, which gives users a consistent performance during file downloading. For example, in the experiment using nodes in a local computer lab, the number of RPC messages for a lookup is close to 1 O (log 2 N ) on average. After the 2 CFS uses the caching technique, the number of RPC messages used for resolving a query is reduced from 5.7 to 3.2 hops along with the progress of experiments in a 1000-server system. One experiment testified that there is no lookup failure when fewer than 20% of the nodes fail, and as low as 0.005 fraction of the lookups failure when 35% of the nodes fail.
2.5. Churn 2.5.1. What is churn? When nodes join or leave the overlay network of a P2P system, the system is said to be experiencing churn. Churn occurs from time to time, and it can be described by the inter-arrival time of node joining and the durations that the nodes remain in the network [Stutzbach2006]. For a system, the inter-arrival time is the average interval time between two consecutive times of node-joining. Researchers widely adopted a Poisson process arrival model in analysis and experimentation of DHT overlay network designs [Li2004] and [Liben-Nowell2002], where the inter-arrival time of node joining is modeled with an exponential distribution. However, from the observations of real file sharing applications, the inter-arrival time appears to have a Weibull distribution with k around 0.6
23
[Stuzbach2006] along the time of the day. Since the exponential distribution is a special Weibull distribution with k = 1 , an inter-arrival model with Poisson process will appear to be more bursty than that in reality. Except for the time of the day effect, there are few correlations between node joining and leaving in the network [Bhagwan2002]. The session time is a continuous period that a node remains in the network, and the time starts from the node’s joining and ends with the node’s leaving. Although the session time of nodes in a network is usually modeled as an exponential distribution [Liben-Nowell2002], the measurements from file sharing applications show that the session time has a Pareto-distribution with a heavy tail [Saroiu2003]. Measured more accurately with a shorter duration at each measuring snapshot, the session time was fit to a Weibull distribution or a log-normal distribution, where a large portion of sessions are short timed, and a small portion of sessions have distinct long durations [Stutzbach2006]. Godfrey et al. [Godfrey2006] defines churn as the number of state changes of a P2P system per unit of time. A state of a network is the number of nodes at time t . A state change is caused by the event of one node-joining or leaving, and it is measured as the absolute difference of two states, which describes the total number of changes occurring in the system between these two states. Hence, churn is the average number of changes that occur in the system per unit of time. The churn of a system can be determined when the inter-arrival times of node-joining and the session times of node-living in the overlay network are determined.
24
2.5.2. Handling churn Because of churn, the information of connections stored on nodes might not be consistent within the overlay network. This kind of inconsistency may cause lookup messages to be dropped during the forwarding procedures. When a structured P2P system is exposed to churn, the availability of its services, including the services for routing lookup messages and the services of applications on the top of the overlay network, are affected. Therefore, extra efforts have to be spent on maintaining a consistent network and recovering lost data. P2P systems handle churn by the mechanisms that belong to overlay networks or applications.
2.5.2.1. Overlay networks As a DHT overlay system has considered node joining and leaving in its primary protocol, one way to improve the routing capability of the DHT is to adjust the system parameters that control the routing of lookup messages. Li et. al. analyzed the trade-off between the maintenance costs and performance benefits of DHTs under churn [Li2004]. In the case that a systems is allowed to use any amount of bandwidth to maintain its overlay network, all four examined DHTs (i.e. Chord, Tapestry, Kelips, and Kademlia) can provide similar lookup latency; otherwise, Chord is superior to others by using its stabilization procedure to maintain the correctness of its routing tables. However, increasing the frequency of Chord’s stabilization too much is not recommended since it does not further improve performance but costs excess bandwidth.
25
DHTs also can be improved through augmenting fault tolerant mechanisms. One solution in [Flocchini2007] is to construct redundant Chord rings in a system. A node uses different IDs to join these redundant rings, and maintains a routing table for the neighbors in each ring. The node may select the healthiest among the neighbors in these rings to be the next hop of a lookup message. This structure is more robust to node failures than a single Chord ring. Differently, Zhao et al. proposed to configure multiple backup nodes in an entry of Tapestry’s routing tables [Zhao2003]. These backup nodes are maintained according to the estimation of their link qualities; therefore, redirecting a lookup request can be completed faster than in the case without this estimation. Rather than improving existing DHTs, new structures that connect nodes into graphs with minimum diameter and maximum connectivity are proposed. These new structures better forward lookup messages in a DHT. For example, the DHT in [Aspnes2001] constructs an overlay network with a random-graph topology. A node associates with its neighbors that are randomly distributed in their ID space. The authors of the paper proved that a DHT overlay network having this kind of random-graph topology will experience few partitions upon node’s leavings, and also, the system can route lookup messages in a bounded number of hops.
2.5.2.2. Application data consistency In order to tolerate the changes of a network caused by churn, P2P applications always replicate a shared object on multiple nodes. These replicas prevent the loss of the object when some of these nodes leave. However, these applications must maintain data consistency among replicas. In some applications, replicas are located at the nodes
26
neighboring the master node that contains the primary copy, and the master node is responsible for propagating updates to replicas (i.e. CFS and OceanStore). Or, in some other applications, pull and push techniques that are used in Web cache systems to keep data up to date throughout the Internet are also adopted recently. For example, SCOPE [Chen2005] pushes updates to replicas in the Chord ring. Each key corresponds to a propagation tree with its destination node as the root and replicas as the leaves of the tree. The space of the ring is partitioned recursively, and a partition corresponds to an inner node of the tree. The information of replicas in one partition is aggregated into the representative node of the partition, and this aggregation procedure is performed from the leaves to the root. The propagation of an update will start from the root and pass along the nodes in the tree till it arrives at all leaves. Li et al. [Li2008] proposed a dynamic propagation tree similar to SCOPE. This system allows updates to occur at any node; upon an update, a propagation tree will be built, and the tree will be torn down when the propagation is finished. Liu et al. [Liu2006] proposed a data consistency protocol which combines a regular push technique and an adaptive pull technique for P2P applications. Update is allowed on the primary copy of an object only, and the update is propagated to replicas by a push action initiated by the primary copy. A replica missing a push message will start a pull action to refresh its copy. The time intervals between two consecutive pull actions for an object depend on the update frequency of the object and the stability of the overlay network. A replica uses a short pull interval for an object in the case that the object is frequently updated, or the routing table of this replica is frequently changed.
27
3. Load balancing techniques In this chapter, we survey the load balancing techniques for distributed computing systems and the diffusive load balancing schemes for parallel computing systems. The load balancing techniques proposed for P2P systems in literature are surveyed at the end.
3.1 Load balancing schemes Using load balancing techniques, distributed computing systems are able to better allocate their computing resources to their programs and improve their overall performance. For example, for the purpose of reducing the running time of programs or services, the programs or server processes may be migrated from heavily loaded nodes to lightly loaded nodes. This kind of migration is called load migration. The heavily loaded node is called a load sender or sender, and the lightly loaded node a receiver node or receiver. Load balancing techniques for distributed computing systems always have load balancing schemes that specify load balancing policies (i.e. how to decide which node is a sender or a receiver for a load migration) and architecture (i.e. how nodes are organized for load balancing). We review the schemes in terms of these two sides.
3.1.1 Different types of schemes Load balancing schemes are combinations of policies (e.g. the Information, Transfer, Location, or Selection policies). The combination that was described in [Eager1986a] and
28
used by [Zhou1988, Kremien1992 and Dandamudi1997] includes the Information, Transfer, and Location policies. The combination in [Shivaratri1992] is an extension of the previous one, and has been widely adopted in papers published recently [Cao2004, Leinberger2000 and Cardellini2003]. We present the extended combination of load balancing policies as follows.
•
Information policy: specifies when and how to collect system state information.
•
Transfer policy: decides whether a node is suitable to initiate a load migration;
either as a sender or as a receiver.
•
Location policy: determines another participant in the load migration after the
migration was decided by the Transfer policy.
•
Selection policy: specifies which load should be transferred in a load migration.
The policies of a load balancing scheme are realized by software programs. By running these programs, the nodes in a system perform the load balancing operations. The load balancing schemes for distributed computing systems can be classified into static and dynamic schemes. We review these two kinds of scheme here.
3.1.1.1. Static schemes The operations of a static load balancing scheme decide load arrangements for systems based on the average behaviors of the systems [Eager1986a]. In one implementation, an operation distributes loads from a sender to receivers through deterministic distribution in a random portion or cyclic manner. For example, a node always distributes certain programs to other nodes in the system, each program to one particular node. This kind of scheme does not require nodes to collect the system status
29
from time to time. Therefore, these schemes are simple to implement and easy to achieve with little overhead. However, they work perfectly only in systems where the characteristics of tasks or programs, for example, their arrival or resource requirements, does not change. The workloads on the nodes in a distributed computing system are usually dynamic (or frequently changed). Without implementing an Information policy, the operations of a static scheme distribute the load on nodes with little dependency on current system status [Wang1984]. Therefore, this scheme can hardly catch up and react to the dynamics of workload in a distributed computing system.
3.1.1.2. Dynamic schemes The operations of dynamic load balancing schemes make decisions of load arrangements among nodes based on their load statuses at the current time or recent past. In order to indicate the load statuses of nodes, a dynamic scheme defines how to measure the “load”; this is called load measure or load index. It has been reported that the effectiveness of a load balancing scheme largely depend on the load measure the scheme uses [Kunz1991]. Dynamic load balancing schemes generally use the queue-lengths of CPUs as a load measure [Ferrari1986, Zhou1988, and Kunz1991]. Researched showed that the CPU queue length of a node has a strong correlation with the mean response time of the tasks. In the case that the nodes are load-balanced according to their CPU queue length, the tasks could have similar mean response times. The Information policy of a dynamic scheme specifies a method to dynamically attain the knowledge of the load statuses of nodes in the system. There are three types of
30
Information policy used by dynamical schemes. They are listed in the following
[Shivaratri1992]:
•
Probing: a node collects the load measure of the other nodes through a probing
procedure.
•
Periodic reporting: a node reports its load measure to others periodically.
•
State-change-driven: a node reports its load measure to others when its state has
changed. In addition to an Information policy, a dynamic scheme also specifies the transfer, location, and selection policies. We present dynamic schemes according to the types of
their architecture in the following subsection.
3.1.2. Architecture In addition to policies, a dynamic scheme also specifies the structure of the organization of nodes in the system. Its operations use this organization to collect the load statuses of the nodes and decide load migrations. We call this structure the architecture of the load balancing scheme. A static load balancing scheme uses a structure with a complete graph topology where a node knows all other nodes. A dynamic scheme may use a centralized, distributed, or topological architecture. This subsection reviews these types of architecture and discusses the effectiveness of the dynamic schemes that use them.
31
3.1.2.1. Centralized structure This kind of scheme has a central directory storing the load information of all nodes in a system, and requires the nodes to periodically report their load statuses to the directory. For example, the load sharing scheme proposed in [Zhou1988] assigns the role of a Load Information Center (LIC) to a node in the system. The other nodes in the system report their load measures to the center by using a periodic information policy. A node identifies itself to be a sender according to a static threshold, and the center is accessed by the sender for locating a receiver. Simulation experiments show that a system with a small number of nodes could perform best with a centralized scheme, and tasks could obtain the lowest mean response time within a narrow range. However, since nodes need to update their load measures at the central directory, the number of messages for this kind of updating increases along with the increase of the system size. Also, a central directory could become a performance bottleneck and it is a single point of failure. Researchers showed that the period of information reporting has a strong influence on the effectiveness of the scheme. Using a shorter period, the scheme might use more messages for updating the load information; using and with a longer period, the scheme might use stale load information in its operations. The effectiveness of the scheme is degraded in both cases.
32
3.1.2.2. Distributed structure The schemes using a distributed structure allow nodes to know the load statuses of other nodes and locally make decisions. We describe these schemes in terms of their information policies.
a) Schemes using a periodic broadcast Information policy This kind of scheme lets each node periodically broadcast its latest load status information to other nodes. A node stores the received status information in a vector, and when it becomes a candidate for load transfer, it chooses a peer for load migration based on the information in its own vector. As indicated by [Zhou1988 and Livny1982], this kind of information policy generates a large number of messages for broadcasting. Also, similar to the centralized scheme, the effectiveness of a distributed scheme largely depends on the length of the information reporting period. In the case that a scheme uses a long reporting period, the status information stored on nodes may quickly become stale. Kremien et al. [Kremien1992] suggested that a distributed scheme could use a requestreply acceptance policy instead of a single-request policy to avoid the occurrence of
incorrect load migrations in such a case. An acceptance policy specifies whether a sender should transfer the load to a receiver directly (i.e. the single-request policy), or waits for a reply from the receiver according to an acceptance agreement (i.e. the request-reply policy).
b) Schemes using a state-change-driven Information policy This kind of scheme lets a node report its information only when its state has changed. For example, Livny et al. [Livny1982] proposed a scheme where an idle node
33
broadcasts a message and announces it being a receiver; a node which has tasks waiting in its queue could transfer some load to the receiver through a reservation process (like a request-reply acceptance policy does). Livny further indicates that this scheme spends
less bandwidth compared to the schemes with a periodic broadcast information policy; hence, it is more effective in a system that has a large size. However, this scheme uses more messages then a scheme with a probing Information policy.
c) Schemes using a probing Information policy This type of scheme lets a node know the load status information of some other nodes through probing them. Adaptive load sharing schemes are typical examples of this kind of scheme. According to the role of an initiator of a load migration, a scheme of this kind can be classified as sender-initiated or receiver-initiated.
•
Sender-initiated: A node decides to be a sender according to a static threshold and initiates a load migration. The sender selects a receiver from the nodes probed at random. Simulations in [Zhou1988] show that the scheme is more effective in the case that a sender is allowed to probe multiple nodes. However, it is also reported that the effectiveness of the scheme does not increase much when the number of probes increases.
•
Receiver-initiated: Unlike the sender-initiated policy, the receiver-initiated policy specifies that a receiver initiates the probing in the case that a node becomes a receiver. Livny et al. [Livny1982] and Eager et al. [Eager1986b] individually proposed some schemes using this policy.
Simulation experiments also indicate that the workloads on nodes affect the effectiveness of the schemes using these policies. Eager et al. [Eager1986b] showed that
34
when a system is lightly loaded, a sender-initiative policy will perform slightly better than a receiver-initiative policy, where a sender could find a receiver in a small number of probing; however, when a system is heavily loaded, a receiver-initiative policy is recommended since a receiver can have more chance to hit a sender in a probing procedure. A symmetrically-initiative scheme is proposed to combine sender-initiative and receiver-initiative into one scheme [Shivaratri1990]. Kremien suggested combining a periodic policy with a slow reporting time and a probing policy together in
[Kremien1992]. The experimental results in that paper indicate that the scheme can periodically adjust a system to perform at an optimal state while keeping a fast response to load changes.
3.1.2.3. Topological structure Topological architectures are proposed for systems with a large number of nodes. The basic idea behind this kind of architecture is to organize nodes into groups and apply load balancing schemes both at the intra-group and inter-group levels. The structures of flat group partitioning, hierarchical, and domain overlapping, are the three main forms proposed in research. a) Flat group partitioning structure
This kind of structure partitions the nodes into groups. A group could use a centralized scheme or a periodic broadcasting distributed scheme to load balance its nodes. For example, the scheme for UTOPIA system [Zhou1993] uses central information centers to manage the load for the groups, one center for each group. The scheme for a web server system [Mohamed-Salem2003] uses the head nodes of groups to
35
distribute web server requests to nodes inside of groups, one head node for each group. These two schemes allow the heads or centers of groups to exchange load status information so that tasks could be transferred between nodes in different groups. The “Local Strategy” scheme proposed in [Zaki1996] lets nodes periodically broadcast their load statuses to the other nodes in the same group. Without exchanging load status information between groups, this scheme does not allow tasks to be transferred between nodes in different groups. The results of experiments for the above schemes indicate that these schemes perform better than a scheme using a centralized or fully distributed structure. Zaki [Zaki1996] shows that, in the case that a system has a large size, the system with the partitioning scheme has better performance than with a non-partitioning scheme. However, in the case that no task is transferred between groups, load balancing is limited inside a group only, and the performance of nodes in different groups is still diverse. The experiment results from UTOPIA system showed that allowing tasks to be transferred between nodes in different groups could further speed up tasks by a factor of ten. Mohamed-Salem’s experiment [Mohamed-Salem2003] indicates that, when a scheme uses a dynamic threshold to identify a sender or a receiver, the balanced system could have the mean response time of their requests tightly bounded to the system average. The bound is not seen when the scheme uses a static threshold. b) Hierarchical structure
This kind of structure organizes nodes into a hierarchy. For example, the scheme proposed in [Dandamudi1997] organized the nodes of a system into a balanced tree. In this multi-level tree, the leaf-nodes are the computing nodes. A child node reports its load
36
status to its parent-node by using a state-change-driven policy, and a parent node aggregates the status information of its children. Ideally, the difference between the loads of its two children is zero. In the case that a leaf-node becomes a sender according to a static threshold, the sender asks its immediate parent for a receiver. The parent locally searches its other sub-tree if receivers are indicated in its aggregated load information. A receiver is returned to the sender when it is found. Otherwise, the parent forwards the request to its parent, and the searching procedure will be continued along the links of the parents until a receiver is located or the forwarding limit is reached. Experimental results showed that the performance of a system using the hierarchical structure scheme is close to that using the centralized structure scheme. But, using the hierarchical structure scheme, the system spends fewer messages on load balancing, especially, for the cases that the nodes in the system have largely diverse capacities [Lo1996]. Moreover, this kind of scheme is better tolerant to the single-point failure than a centralized structure scheme. However, when the function of an internal node or the root fails, the tree is partitioned, and the scheme becomes a scheme with a flat group partitioning structure. c) Domain Overlapping structure
Kremien et al. [Kremien1993] proposed a domain overlapping structure. In this kind of structure, each node belongs to a domain and performs load balancing operations for the nodes only in its domain. A sender (receiver) node selects receivers (senders) to be members of its domain. A sender uses a sender-initiated transfer policy to locate a receiver in its own domain, and a request-reply acceptance policy to avoid incorrect load movements. Domain membership is refreshed periodically or upon node status change. Experiments showed that the scheme using this kind of structure outperforms a
37
distributed scheme that uses a periodic broadcasting information policy, or a combination of the probing information and random location policies.
3.2. Diffusive load balancing schemes Research has also studied load balancing schemes for parallel computing systems. Some parallel computing systems are composed of processors tightly coupled together by internal fast connections. Others are composed of multiple workstations connected by a network. We call a computing component (e.g. a processor or a workstation) a node in such a computing system. In a parallel computing system, a program is divided into small pieces of sub-programs so that the nodes could simultaneously run them. A load balancing scheme better relocates resources of the nodes in a parallel computing system for these sub-programs. Therefore, the running time of the program could be further reduced. Diffusive load balancing schemes are one kind of scheme that has been intensively studied for this purpose. Diffusive load balancing schemes are dynamic load balancing schemes. These schemes also specify policies. Load balancing operations realize these policies. We call a node that is running a load balancing operation the operating node of the operation. We call the domain of an operation, which includes the nodes for which the load balancing is performed, the neighborhood of the operation. Normally, for a diffusive load balancing scheme, the neighborhood of an operation is the neighborhood of the operating node in the P2P system. In this subsection, we first review two major kinds of diffusive load balancing scheme: synchronous schemes and asynchronous schemes. Then, we review the
38
effectiveness of diffusive load balancing in a system where the workloads o nodes or the locations of nodes change from time to time. The diffusive schemes that handle the nodes with heterogeneous capacities are also reviewed. At the end of this subsection, we review the papers that compared diffusive schemes and other dynamic schemes using experiments with real systems.
3.2.2. Synchronous schemes Most of synchronous schemes are studied for parallel computers where a global clock is provided in hardware. The nodes of this kind of system can conduct load balancing operations in a synchronous manner. A load balancing operation has three sequential stages. During the information stage, a node reports its load status to all its neighbors. During a decision stage, a node decides the loads that would be transferred to its neighbors. During a load migration stage, the loads are transferred between nodes according to the decisions. The operations of synchronous diffusive schemes (also known as diffusion schemes in literature) use decision algorithms that implement diffusion equations during their decision stages. These equations are similar to heat diffusion in physics. For example, the algorithm in [Boillat1990] implements a Poisson diffusion equation:
∆w = −∆CG wt with ∆t
iterative equations run at each node of a system. The network of the system could be described by an undirected graph: G = ( N , E ) where N is the set of its vertices (nodes),
E is the set of edges, and vi is the degree (or the number of links) of vertex i . In the Poisson diffusion equation, wt = ( w1t , w2t , K wnt )T is the vector of workload of the nodes at
39
time t , and ∆CG = (cij ) is a Laplacian operator of a valuated graph of the network with
0 1 edges in E , where the element cij = − max(v , v ) + 1 i j
cii =
(i, j ) ∉ E , and i ≠ j , (i, j ) ∈ E
1 . The equation could be iteratively solved by the equation ( i . j )∈E max(vi , v j ) + 1
∑
wt = ( I − ∆CG ) wt −1 where I is the identity matrix. Hence, only knowing the workloads of its neighbors at time t − 1 , a node could have its workload at time t equal to the calculated value. Similar to Boillat’s work, Cybenko also used an iterative algorithm to describe a diffusion scheme [Cybenko1987]. The function below describes how the loads of nodes are calculated in one operation. The workload of a node wit is updated at time t as follows: wit = wit −1 + ∑ α ij ( wtj−1 − wit −1 ) . This can be rewritten as below to show that the j
workloads are redistributed among nodes according to the predefined coefficients: wit = (1 − ∑ α ij ) wit −1 + ∑ α ij wtj−1 j
.
Or,
wt = Mwt −1 ,
where
wt
is
a
vector
j
wt = ( w1t , w2t , K wnt )T for a system of n nodes, and M is a transformation matrix with
α ij (i ≠ j ) coefficients mij = . We have 1 − ∑ α ij (i = j ) k
∑m
ij
= 1 and mij = m ji .
j
Both of these two diffusion schemes are represented by linear equations. By iteratively solving these linear equations, the load balancing operations drive the workloads of the nodes to approach their average in the case that the workload of the system is static. This kind of load balancing progress is called convergence. When a
40
system has a static workload, no task is created or finished in the system. The convergence of these schemes is proved by the geometrical convergence of their linear equations. Since the coefficient matrix of a diffusion scheme is a non-negative, symmetric and doubly-stochastic matrix, the convergence factor of the diffusion scheme
γ could be selected from its eigenvalues λn ≤ λn−1 ≤ K ≤ λ2 ≤ λ1 = 1 as γ = max i>1 λi . Then, at each iteration, wt − wt
2
= Mwt −1 − wt
2
≤ γ 2 wt −1 − wt
2
where wt is the n × 1
n
∑w
t i
vector of the average workload with all elements equal to workload,
average 2
workload
M t w − w ≤ γ 2 wt −1 − w ≤ γ 2t w0 − w
does 2
not
i =1
n
change
. For a system with static with
time,
hence,
. This indicates that the Euclidean distance
between wt and w monotonically decreases along with the iteration of the decision algorithm. The workload vector wt geometrically converges to w : lim wt = w with a t − >∞
convergence factor γ . A small factor indicates that the variance of loads of the system has a large reduction and the scheme converges at a fast speed. Research further studied the factors affecting the convergence factor or convergence speed of a diffusion scheme. The convergence factor of a diffusion scheme is one of the eigenvalues of a transformation matrix. Since the matrix of a diffusion scheme is constructed based on the network structure of a system that uses the scheme, the network structure is one of the factors to the convergence speed. For example, the convergence factor of Boillat’s scheme is related to the maximum node degree and the number of nodes in the system. In a complete graph, the scheme can take one run of the algorithm to
41
reach a global balanced state. In a linear network or a circle, the scheme takes long time to converge with a larger convergence factor; in a d − dimensional hypercube, the convergence factor of the scheme is 1 −
2 . The factor for Cybenko’s scheme is the d +1
coefficients α . When Cybenko chose the coefficients α equal to
1 for a d +1
d − dimensional hypercube, he attained the same convergence factor [Cybenko1989]. Xu
further studied the choice of coefficients α according to the system structure for optimal convergence rates [Xu1997]. Using Matlab simulations, Diekmann et. al. solved optimization functions with a constraint on minimizing the convergence time to find the diffusion matrix with the optimal convergence rate for systems with a hypercube, linear array or star structure [Diekmann1997]. The coefficients of the optimized diffusion matrixes obtained by the above two researchers are consistent.
3.2.3. Asynchronous schemes An asynchronous scheme, such as the partially asynchronous schemes proposed in [Bertsekas1997, Song1994, Cortes2002, and Cedo2007], allows nodes to asynchronously run load balancing operations. This kind of scheme is often used in systems composed of workstations or servers where a global clock is not an inherent component. But, this kind of scheme still requires a system to have a delay-bounded message passing mechanism (or “partial asynchronism” [Bertsekas1997]) where a message or a task sent from a node would be received by its neighbor in a maximum of B time units. Like a synchronous scheme, a partially asynchronous scheme is a combination of policies. Also, the scheme has three phases. During the information phase, a node 42
broadcasts its load status to all its neighbors when its load status has changed. This phase guarantees that a load balancing operation uses up-to-date load status information of its neighborhood. During the decision phase, if a sender-initiated transfer policy is used, the operating node is the sender and the receivers are some neighbors that have lower loads. The decision phase chooses receivers from those neighbors that have smaller workloads. Two kinds of asynchronous scheme are proposed in the literature. Bertsekas proposed a scheme with a decision algorithm that handles fine grain tasks in Section 7.4 of [Bertsekas1997]. The Selection policy of the scheme allows a sender to transfer portions of its workload to multiple receivers. Especially, the portion migrated from the sender to a lightest loaded receiver is a proportion of the difference between their workloads. The policy also specifies that a sender must still have a load larger than the lighter-loaded nodes in the neighborhood right after the load transfer. Bertsekas also showed that the workloads on nodes, including the maximum, the minimum, and wit of node i geometrically converge to
L where the system has n nodes with total workload of L . n
Asynchronous schemes were also proposed for systems having integer workload, e.g. determined by the number of tasks running. Schemes proposed in [Song1994 and Cortes2002] work on reducing the differences between the numbers of tasks on the nodes. Song’s and Cortes’ schemes implemented Bersekas’ scheme differently. In an operation of Song’s scheme, a node stores a list of load statuses of its neighbors. These load statuses are arranged in ascending order. After a sender transfers load out, the position of the sender in the sender’s list does not change. Cortes’ scheme implements the case that a node identifies itself as a sender if its workload is larger than the average workload of its neighborhood and distributes its exceeding workload to the receivers with 43
workload less than the average. With Cortes’ scheme, the sender reaches the neighborhood average in one load transfer. It might take several load transfers for a sender to reach the neighborhood average with Song’s scheme. Both schemes are able to control the difference between the workloads of neighbors within the limit of one unit. [Song1994] further derived the maximum global imbalance at the globally balanced state
dia (G ) equal to where dia (G ) is the diameter of the graph G representing the 2 system’s network. The convergence speed of a partial asynchronous scheme is studied with simulation experiments in [Hui1996]. The convergence speed is lower when the system has a larger number of nodes or a larger network diameter. Hui further showed that the topology of the network of a system largely affects the effectiveness of the scheme. For a graph like a ring or a linear path, this kind of scheme would take a long time to balance the load, especially when an overloaded node is at one end of the path and an under-loaded node at the other end. The scheme converges faster in a network with hypercube or torus topology, where the network has a smaller diameter (for the same amount of works). Although a star or a balanced tree network has a smaller diameter, the experiment showed degraded convergence rates. This is because the central node or the root receives more balancing messages than the other nodes do, and dealing with these messages at one node leads to control overload and increases the convergence time.
44
3.2.4. Characteristics 3.2.4.1. Dealing with heterogeneous nodes Diffusive schemes are also able to balance the load for nodes with heterogeneous capacity, i.e. heterogeneous nodes. These nodes have processors with different computing speeds, different sizes of memories, or different bandwidth over their network links. Working in a system with heterogeneous nodes, a diffusive load balancing scheme reduces the differences between the values of
w w of these nodes, where is the ratio of C C
the workload to the processing power of the node. This is based on the understanding that, if two nodes i and j with capacity Ci and C j , respectively, have the same workload per unit of processing power, that is
wi w j = , they would use the same length of time to Ci C j
finish their works. For example, the synchronous diffusion scheme proposed in [Elsasser2002] uses the following iterative algorithm to calculate the workloads on the nodes at time t : wit = wit −1 − ∑ j
α wit −1 f ij
(
Ci
−
wtj−1 Cj
) where α is a coefficient, and f ij is the
weight of the network link connecting i and j . When the system approaches the balanced n
wt state, lim i = t −>∞ C i
∑w
t0 i
i =1 n
∑C
where wit0 is the initial workload distributed on node i , and n is i
i =1
the number of nodes in the system.
45
The impact of the heterogeneity of the capacity on the convergence speed of an asynchronous scheme is studied in [Hui1996]. Hui proposed a partial asynchronous load balancing scheme similar to Bertsekas’s scheme with
w ratio replacing w . A global C
balanced state is achieved when all nodes have the same ratio. The convergence proof in the paper indicates that, in addition to the factors of network structure, the diversity of the node capacities has an impact on the convergence speed of the diffusive scheme. In the case that a system has nodes with largely diverse capacities, the convergence speed is slow. The convergence speed of a heterogeneous system could be improved when the system uses nodes with similar capacities.
3.2.4.2. Working in dynamic systems Being a dynamic scheme, a diffusive load balancing scheme is able to handle the dynamics of a system. The dynamics comes from two sources: 1) from time to time, new tasks are created or some existing tasks are finished (dynamic workload), 2) the existing nodes or links may fail or recover (dynamic nodes or dynamic network). Although a diffusive scheme does not use an extra mechanism for the dynamic, the effectiveness of load balancing changes. Cybenko investigated the effectiveness of his (synchronous) diffusion scheme in a system with a dynamic workload [Cybenko1989]. Along with the progression of the load balancing, the mean of the variance of the workloads on a node is smaller than
σ2 , where γ is the convergence factor of the diffusion scheme. This 1− γ 2
result indicates that the nodes of the system will not have the same load in the case that the workloads of the nodes are dynamically changing (which can be the expected
46
situation); however, the variance of the workloads is bounded. Also, for a scheme with a convergence factor closer to 1, or for a system whose workloads have strong changes, the variance of the workloads on the nodes would be larger. Elsasser considered the effectiveness of load balancing in a system whose network links frequently fail and recover [Elsasser2004]. A (synchronous) diffusion scheme could be described by: wt = Mwt −1 . Since, M is the coefficient matrix derived from the system’s network structure, in the case that a link between node i and j fails, the coefficients mij and m ji = 0 become zero. The coefficients are restored when the link recovers. Therefore, the diffusion scheme could be described as wt = M t wt −1 where the coefficient matrix corresponding to the network at time t . Let γ t be the convergence factor of the M t , the Euclidean distance between workload distribution and the average
λt2
t
t
∑D
satisfies: wt − w ≤ ∏ γ t w0 − w ≤ ( i=1 i =1
t max
t
t ) t w0 − w , where Dmax is the maximum
node degree of the network at time t , and λt2 is the second smallest eigenvalue of the unweighted Laplacian of the network.
3.2.4.3. Comparison with other dynamic schemes Researchers also compared diffusive schemes with other dynamic schemes by experiments using real system. They measured the speed-ups of parallel programs in a cluster of workstations. The measurement of speed-up combines all of the factors
47
affecting the effectiveness of load balancing; these factors include the effect of load distribution and effect of the costs of load balancing (e.g., processing power and network bandwidth). There are three comparisons discussed here; each of them reflects a certain aspect of dynamic schemes. Saletore’s experiments [Saletore1990] showed that the system had the highest speedup in the case that an asynchronous diffusive scheme uses the sender-initiated (transfer policy) and the neighborhood averaging information policy. This asynchronous scheme is similar to the asynchronous scheme introduced at Subsection 3.2.2. The other two schemes use the same transfer policy and different location policy. One scheme uses a
random location policy where a sender could choose a receiver at random. Another scheme allows a node to identify its state using the estimated global information. However, the results in the experiments are not enough to show that the deficiencies of the effectiveness of these two schemes are caused by the load imbalance remaining in the system or the delay induced by load migrations. Willebeek-leMair’s experiments [Willebeek-leMair1993] indicates that the diffusive scheme using receiver-initiated (RID) policy is more effective than the other dynamic schemes, such as
gradient-model (GM), dimension exchange method (DEM) and
hierarchical balancing method (HBM). The RID scheme evenly distributes tasks, and it transfers fewer loads between nodes than other schemes. The SID scheme using the same
information policy results in a smaller speed-up since the migration decision adds extra workload to senders and degrades the speed-up. The HBM scheme is based on a hierarchical tree; a tree node (i.e., an inner node or the root) takes charge of load balancing of its two sub-trees. Compared to the RID scheme, the HBM scheme induces
48
more load transfer, especially in the case that the load granularity (the size of tasks) is small. The GM scheme which depends on global information takes the last position in this comparison: it has the smallest speed-up and a large number of tasks transferred. This is because the global information is easily aged, and a resulting load migration decision might not be correct, thus worsening the system’s load unbalance situation. Another reason is that resources are consumed by the load migration on the path from an overloaded node to an under-loaded node; this degrades the speed-up as well. The DEM could have a comparable effectiveness with the RID scheme; however, its load balancing operations are globally synchronized. The effectiveness of diffusive schemes in a dynamic system was studied in [Corradi1999]. The workloads on the nodes are changed frequently. The studied diffusive schemes use various kinds of neighborhood in their operations. Corradi’s experiments indicated that, when the workloads of nodes are highly dynamic, a diffusive scheme that uses the immediate neighborhoods of a network performs better than the other schemes. Their research also showed that a scheme relying on global information like the GM scheme described above can not deal well with a system that has fast changing workload.
3.3. Techniques for peer-to-peer systems Load balancing techniques have been proposed for improving the performance of P2P systems. We are not interested in the technique that evenly dispatches the requests to multiple replicas of a shared object, such as the scheme proposed in [Roussopoulos2006]. This kind of technique has been intensively studied for distributed computing systems such as web servers. We are interested in the techniques that achieve load balancing by
49
placing or moving objects or nodes in P2P systems. These techniques can be classified into static technique and dynamic technique. They are designed specifically for P2P systems according to their structures and characteristics.
3.3.2. Static techniques This kind of technique statically maps shared objects to nodes when these objects are inserted into a P2P system. For example, the consistent hashing function [Karger1997] implemented in DHT systems is a static technique. A hash function used by a classic centralized hash table is able to generate the hashed keys uniformly distributed in a data space according to the number of buckets of the table. But, the hash function does not allow the number of buckets to change dynamically. A consistent hashing function solves this issue and also maintains the consistency properties. That is, in a DHT system such as the Chord or Pastry, with a high probability, the number of hashed keys at each node are bounded, and, when a node is moving in (out) the network, only a portion of keys are moved from (to) immediately neighboring nodes. However, even with the static load balancing function of a DHT system, Chord still has a load imbalance factor as large as O (log N ) . That is, for an N-node Chord, the number of objects on the highest loaded node is of the order of O (log N ) times the average number of objects per node. To solve this problem, Stoica et al. proposed an approach that builds a Chord using virtual servers [Stoica2001]. According to the approach, a node can create multiple virtual servers, and randomly choose an ID for each server. A virtual server has a unique ID in the system. The virtual servers of nodes construct a Chord ring. A virtual server takes over its objects from its predecessor virtual
50
server when it is created, or hands over its objects to its successor when it is deleted. Each virtual server has a routing table whose entries point to its neighbor virtual servers in the Chord. In the case that the number of virtual servers in a system with N nodes is as large as NO (log N ) , a node can host O (log N ) virtual servers with IDs that are uniformly distributed in the ID space. Therefore, the differences of number of objects between nodes are reduced. The corporative file system CFS [Dabek2001] is another example of using static load balancing technique. CFS generates hashed keys by hashing contents of the individual blocks of a file and stores the blocks to different nodes according to their hashed keys. This prevents a single node from becoming overloaded in the case that the file has a large number of requests. However, the number of nodes on which a file is stored depends on the number of blocks of the file instead of the number of requests of the file. CFS does not assign more nodes to files that have more requests. These static techniques place objects evenly on nodes based on the assumption that both of the hash keys of the objects and IDs of the nodes are uniformly distributed in their spaces, and all nodes have homogeneous resource capacities. These techniques do not consider the characteristics of P2P systems (e.g. the dynamics and heterogeneity).
3.3.3. Dynamic techniques Dynamic techniques consider dynamics and heterogeneity existing in P2P systems (reviewed in Chapter 2). These techniques are different in their ways of placing loads on nodes or moving loads between them and the architectural organization of node for load balancing.
51
3.3.3.1. Types of load placement a) Object placement Some techniques place a newly inserted object on a node that has a lighter load. We call this kind of load placement object placement. The Simple Load Balancing Scheme proposed in [Byers2003] is a technique of this kind. When an object is inserted in a P2P system, multiple hashed keys are generated for the object by the system using multiple hash functions, one function for one key. These hashed keys are looked up in the system. After the nodes that are in charge of these keys are located, the loads of these nodes are compared. The object is stored on the node that has the lightest load among them.
b) Virtual server placement The k-Choices scheme [Ledlie2005] is a technique using virtual server placement. In a P2P overlay network constructed by virtual servers, a newly joined node picks up multiple IDs at random. The nodes that are in charge of these IDs are located, and their loads are compared. The new node creates a virtual server with the ID that is taken care of by the node with the heaviest load, and lets the virtual server join the overlay network. In this way, the new virtual server takes over some of objects from the overloaded node so that the overloaded node could have its load reduced. In the case that the new node still has some available capacity, it creates more virtual servers in the same way.
c) Object relocation enhanced by node migration Some techniques move objects between nodes from time to time. This kind of technique is used in non-DHT systems like Mercury [Bharambe2004] or a system supporting range-partitioned data [Ganesan2004]. Using such a technique, the nodes in a
52
ring or linked list are locally load-balanced by moving objects to their consecutive neighbors. In order to improve the load balancing speed, the technique further moves nodes in the system. A lightly loaded node is required to leave and rejoin the network to be a consecutive neighbor of a heavily loaded node. In this way, the heavily loaded node has its load reduced. We call this kind of load placement object relocation enhanced by
node migration.
d) Virtual server migration DHT systems using virtual servers can use dynamic techniques with virtual server
migrations. A virtual server has a unique ID and contains the objects associated to its ID. The load of a node is the sum of the loads of its virtual servers. The loads of nodes change when virtual servers migrate between them. The technique proposed in [Surana2006] uses this kind of load placement. During the migration of a virtual server, the IP address of the virtual server is changed. The migration does not split, or merge virtual servers. Therefore, they do not induce extra churn into the DHT system.
3.3.3.2. Architecture The architecture of a load balancing scheme is the structure by which the nodes are organized for the purpose of load balancing. We present several structures used by the load balancing techniques for P2P systems.
a) Topological structure The typical topological structures are listed as follows.
•
Linked-list: Some load balancing techniques use this kind of structure for local load balancing. Normally, these techniques use another structure for global load
53
balancing (e.g. the techniques in the category of “object relocation enhanced by
node migration”). For example, in a global load balancing operation, a lightly loaded node will be asked to leave and rejoin the network and be the consecutive neighbor of a heavily loaded node in the case that the local load balancing can not resolve the heavy load on the node.
•
Tree structure: In this category, a scheme either uses the tree-structured overlay network or builds a tree-structure for load balancing operations. For example, the scheme for the DP-tree system [Li2006] depends on the tree structure of the overlay network for aggregating load status of the system and circulating the global load status information. A node of the DP-tree stores the load statuses of all nodes in a load distribution map, and locates a receiver using the map in the case that it becomes a sender. Differently, the k-ary tree scheme proposed in [Zhu2005] builds a tree structure based on an overlay network like Chord. The P2P nodes are the tree-leaves. The tree-root aggregates the load status of the system and disseminates the information to the P2P nodes. According to the load status of the system, a P2P node identifies itself as a sender or receiver, and reports its state to its parent in the tree. A tree-inner-node works as a directory and locates receivers for senders in its sub-trees.
•
Histogram: Vu et al. proposed a technique of this kind in [Vu2009]. The technique constructs a structured framework for a P2P system, such as Chord, BATON, or Skip-Graph. Using this framework, each node aggregates a load distribution map of the system called Load Histogram. The Load Histogram indicates the average load status of nodes in the non-overlapped data ranges of the
54
system. Using the Load Histogram, a sender could find a receiver by recursively locating the nodes in the data rangers with lower average loads.
b) Distributed Directory Suranna et al. proposed a distributed directory in [Suranna2005]. A node registers in one of the directories, and periodically reports its load status to the directory. The directory works as a central information server to locate receivers for senders. In order to achieve the globally balanced state, the technique asks nodes to change their registrations from time to time.
c) Random Probing Some dynamic techniques use a distributed architecture where each node runs load balancing operations. While running an operation, a node collects the load status of the system by random probing. A random probing could be implemented by a procedure for looking up a random number or by a random walker in an overlay network. The nodes being probed compose the domain of the operation. For example, the scheme used by Mercury allows a node to estimate the load distribution of the system by sampling multiple nodes. Based on the knowledge, the node could identify itself as a sender and locate a receiver. The Simple Load Balancing scheme in [Karger2006] allows a node to sample only one node. The node identifies itself as a sender and the sampled nodes as a receiver in the case that its load is higher by some factor of the load of the sampled node.
3.3.3.3. Load measure There are two kinds of load measures used for P2P load balancing: workload and utilization of nodes. Workload is used by the schemes in [Bharambe2004] and in
55
[Ganesan2004]. These schemes assume that objects are fine grained, which means that objects with any size (or loads with any value) can be exchanged between nodes. In the case that a system is balanced, the nodes have the same value of load. Utilization is used by the schemes in [Zhu2005 and Suranna2005]. Here, the resources of nodes to be balanced could be CPU processing power or network bandwidth. These schemes regard the workload of a node as the total resource requirements of its services. For example, the resource requirement li of node i could be calculated by adding the resource requirements of its services: li = ∑ lo = ∑ so λo where o is an object on the node, so is o∈i
o∈i
the resource requirement of a service accessing o , and λo is the request rate or the popularity of the services accessing o . The utilization of the node is defined as
l ρi = i = Ci
∑s λ
o o
o∈i
Ci
. In the case that a system S is balanced, the utilizations of nodes are
∑∑ s λ the same as the system utilization which is defined as ρ = ∑C
o o
i∈S o∈i
. The techniques
i
i∈S
using virtual server migrations or virtual server placements also use this load measure. Since a virtual server contains multiple services, the workload of the virtual server is the sum of the resource requirements of its services. The workload of a node is the sum of the workloads of its virtual servers.
56
3.3.3.4. Effectiveness The effectiveness of load balancing in P2P systems is usually measured in terms of load distributions, system performance, and the cost of load balancing. These issues can be studied by simulation experiments. We present these studies as follows. Some papers displayed the load distributions in the systems at a globally stable state by using the correlation between the workloads on the nodes and the capacities of these nodes. A scheme is said to be effective in a system when the system has the correlation of this kind close to 1. For example, the paper [Zhu2005] showed that the loads on nodes follow a linear function of their node capacities. Moreover, some papers, for example the one for the Histogram scheme [Vu2009] or for the Mercury system [Bharambe2004], investigated the load distribution on nodes in terms of load imbalance; that is, the ratio of the maximum to the minimum of the workload. The more effective the load balancing scheme is, the smaller is the load imbalance in the system. There are some other ways to evaluate the effectiveness. For example, a scheme is more effective in the case that the system has fewer failed requests [Suranna2005], or more succeeding requests [Ledlie2005]. The cost of load balancing is mainly shown by the amount of loads moved and the number of messages spent on load balancing. According to the investigation in [Suranna2005], a scheme that reduces more variances of loads induces more load movements in the system. The number of messages used for load balancing depends on the scheme. After deciding the measure of the effectiveness of load balancing, people also studied the factors that affect the effectiveness. We list these factors as follows.
57
•
Highly skewed workload distribution: Bharambe et al. [Bharambe2004] indicates that a highly skewed workload takes more time to converge. Also, when the change of workload occurs at one hot spot, for example, a site or a file becomes suddenly extremely popular, and the popularity is further increased along with the time, the effectiveness of load balancing is degraded. Suranna et al. [Suranna2005] showed that, in this situation, the proportion of requests that fail will increase. The effectiveness of a scheme becomes normal when the load changes are widely dispersed in the system.
•
Churn: Churn causes the updates of the overlay network as well as the changes of the workload distribution of a P2P system. Even under the function of load balancing, the performance of a system is degraded when churn occurs. A scheme induces more load movements in the case that the system has a higher churn rate.
•
Size of objects: The workloads on the nodes in a system with small sized virtual servers could have better load distribution using load balancing schemes.
•
Size of systems: Distributed schemes are scalable. Their effectiveness should not be degraded by an increase of the sizes of systems. The scheme using the linkedlist structure is not scalable. Experiments showed that a system using this kind of scheme has its load imbalance increased when its system size increase.
The effectiveness of a scheme can be improved by adjusting the parameters of its policies. For example, a distributed directory scheme would be more effective when the running period of the directories is smaller. The load balancing schemes have different effectiveness. For example, Shen et al. [Shen2007] revealed that, compared to other schemes, the k-ary tree scheme induces a
58
larger number of messages. Meanwhile, the system using the scheme has a larger variance of loads in the case of churn. The paper also showed that the directory (central or distributed) scheme can not deal well with the dynamics of a system. The running period of the directory requires to be engineered. Ledlies’s research [Ledlie2005] shows that the technique called transfer technique is superior to the techniques that create or delete virtual servers on nodes according to the available capacities of individual nodes only, and to the link-list structure scheme where nodes only balance their loads with consecutive neighbors. The transfer technique is a virtual server replacement technique that uses a sender-initiated policy with a static threshold and a random-probing policy. The scheme is comparative to the k-Choice scheme. However, in the case that the workload is highly skewed, or the churn is highly skewed, k-Choice has better effectiveness. Since the k-Choice scheme arranges the virtual servers of a node when the node is inserted, in the case of a highly skewed workload, the insertion process better captures the changes of workload distribution. The paper on the Histogram scheme [Vu2009] shows that, in the case that a load distribution map is available, the technique using object relocation enhanced with node
migration could be more effective than a scheme that simply equalizes the load on two nodes. The system using the Histogram scheme has a smaller load imbalance. Other techniques, such as those using random neighbors, skip graph, and the scheme for Mercury, take more messages in order to reach a similar load balance level. Besides the effectiveness of load balancing, some load balancing schemes consider other aspects. For example, the Histogram scheme uses a parameter to control the propagation of load status reports to reduce the number of reporting messages. The k-ary
59
tree scheme considers the locality of nodes. When a sender selects a receiver, the candidates within a smaller proximity will have higher priorities than others. The k-
Choice scheme considers security when the IDs of virtual servers are generated.
60
4. Diffusive load balancing for peer-to-peer systems We propose a diffusive load balancing scheme that is adapted from the diffusive schemes proposed for parallel computing systems. In this chapter, we first present the reasons why we choose a diffusive scheme to balance the loads of nodes for a P2P system. Then, we present the scheme in terms of its policies, and the components and algorithms that implement these policies. We further investigate the effectiveness of the scheme, including the speed of load balancing and the costs for load balancing, in a distributed system with a skip-list network topology.
4.1. Why choosing a diffusive load balancing scheme? The review in the last chapter indicates that diffusive load balancing schemes are capable of balancing workload for systems with a large number of nodes. In a system, the operations of a diffusive scheme perform load balancing functions for the nodes in local neighborhoods. Studies have shown that a diffusive scheme is able to control the variance of loads within a smaller bound than other dynamic schemes (see Section 3.2.5). In this thesis, we propose a diffusive load balancing scheme for P2P systems to improve their performance. We modified the scheme in several ways. First, in a P2P
61
system, the scheme is expected to equalize the mean response times of nodes that host services. The operations of the scheme relocate objects between nodes. This kind of relocation causes the requests of the services that access these shared objects to be redirected. In this way, the available processing powers of the nodes are changed, which induces the change of the mean response times of the services. However, in order to effectively improve the performance of a P2P system, the scheme has to consider the nodes’ heterogeneous capacities, heterogeneous resource requirements of the services, and churn. Second, the scheme works in a distributed system that does not provide a global synchronization mechanism. We present the detail of the scheme in the following sections.
4.2. Design of the scheme We modified three aspects of the scheme, including the load measure, the stages of operation, and the decision algorithms. We present these aspects in the following.
4.2.1. Load measure 4.2.1.1. Available capacity We decided that the scheme should equalize the mean response times of services. The main responsibility of P2P nodes is to provide services like a server in a client/server system. In many studies regarding client/server systems, the performance of a server is evaluated by the mean response time of its requests. Also, the effectiveness of load balancing for a distributed computing system is investigated by the mean response times
62
of the tasks that dynamically arrive to or depart from nodes ([Eager1986a, Eager1986b, and Dandamudi1997]). Furthermore, it has been shown that load balancing based on the mean response time of services improves the performance of the services in a web server system ([Mohamed-Salem2003]). These points indicate that our diffusive scheme should improve the performance of a P2P system by equalizing the mean response time of services. However, the load measures used by existing diffusive load balancing schemes can not achieve this aim. The operations of a diffusive scheme measure and equalize the amounts of computation on the nodes in a parallel computing system. In this way, the execution times of parallel computing programs are reduced. Clearly, this load measure does not reflect the dynamic arrival or departure of requests on nodes. Therefore, in order to equalize the mean response time of services for a P2P system, the designed diffusive scheme has to use a different load measure. The load balancing schemes proposed for P2P systems in literature neither equalize the mean response times of services. Some load balancing schemes, such as the techniques in [Bharambe2004] or in [Ganesan2004], equalize the number of objects or of virtual servers on the nodes. They do not deal with nodes with heterogeneous capacities. Other load balancing schemes, such as the scheme in [Zhu2005] or in [Suranna2005], evaluate the load statuses of nodes by measuring their utilizations (i.e. the utilization of a node is the proportion of the time that the node is busy). These schemes bring the utilizations of the nodes to the average for the system. However, it can be shown that when two server nodes with different capacities have the same utilization, their mean response time might not be the same. The requests arriving to the node with the higher
63
capacity would experience the smaller mean response time. Therefore, these schemes can not equalize the response times of services on different nodes, and these nodes have largely varying performance. In contrast to the above schemes, we propose a diffusive scheme that uses the available capacities ( avc ) of P2P nodes as its load measure. The operations of the scheme bring the available capacities of nodes to the average of the system. In the studies regarding client/server systems, the performance of a server is normally modeled as an M/M/1 queuing system, and the performance parameters, like mean response time of service requests, mean queue length, and utilization, could be derived from the model.
1 According to [Jain 1991], the formula E [r ] =
µ λ 1− µ
=
1 indicates that the mean µ −λ
response time of requests E [r ] is the inverse of the difference between the service rate
µ and the arrival rate λ of requests on the server. We define the available capacity as the difference between µ and λ . This formula can be further interpreted as, in the case that two server nodes have the same available capacity, the mean response times of their requests are the same. The formula also works in the case that the two servers have heterogeneous capacities. Because of the direct mapping, we conclude that, in the case that the nodes in a P2P system have the same available capacity, the mean response times of the requests of the system are the same. Therefore, the purpose of the diffusive load balancing is to obtain similar available capacities of nodes so that the services provided by the system could have a more uniformed mean response times or quality of services.
64
The available capacity avci of node i can be calculated from the total capacity of the node ui and its utilization ρ i by using the formula avci = ui (1 − ρ i) . The total capacity of a node could be measured by a benchmark tool, and the utilization of the node could be measured by a performance measuring tool. This formula also implies that the available capacity of a node can be calculated when the node runs programs other than those for the P2P applications. In order to improve the accuracy of its load status, a node could monitor its own available capacity all the time, and the average value over a time could be taken as its load status for a load balancing operation.
4.2.1.2. Using available capacity as load measure In the last sub-section, we proposed that the diffusive scheme should use available capacity of nodes as its load measure. Now, we further support this decision with two points. First, we compare the effectiveness for two choices of load measure: (a) available capacity of a node, and (b) node utilization. We assume that each node can be modeled as an individual GI G 1 queues. We consider as objective for load balancing a uniform response time throughout the system; therefore we are interested in obtaining the lowest expected values for the average response time of the nodes and the variance of these response times. Our comparison shows that, between the two choices, the technique that equalizes available capacities is more effective. Second, we show that using available capacity for load balancing is a practical technique since it is consistent with Mean Value Analysis (i.e. MVA) derived from operational laws. The operational laws define the equations for evaluating performance of real systems as a function of parameters.
65
Originally, we chose the available capacity as load index because in the case that a node can be modeled as an M/M/1 queue, the mean response time of the node is the inverse of the available capacity of the node. Therefore, the response times of all nodes will be equal when their available capacities are equal. We also know that this inverse relation holds in the case that the nodes are modeled as M/G/1 queues and certain other scheduling methods such as PS (Processor Sharing) or LCFS (Last Come First Server pre-emptive scheduling). However, for other node models, the mean response times on the nodes may be different when their available capacities are equal. In the following analysis, we use the GI G 1 queuing model for evaluating the performance of nodes. The expected response time of a node modeled as a GI G 1 queue only depends on the mean and standard deviation of the service times and on the average inter-arrival time of requests. The following analysis is a generalization of the analysis based on the M/M/1 model in the previous section. First, we determine the expected value and variance of the mean response times on the nodes in a system. We consider the two cases where the available capacities or the utilizations of the nodes are equalized. Then, we compare these expected values and variances. We assume that a node is modeled as a GI G 1 queue. The “G” in this model stands for a general distribution for the service time where, for a random variable X, only the mean Ε[ X ] and the standard deviation STD[ X ] are known. Here, the coefficient of variation of X is c =
STD[ X ] . The parameters of this model are as follows: the interΕ[ X ]
arrival time of requests on a node has a mean value of
1
λ
and a squared coefficient of
66
variation of c 2A , and the service time has a mean of
1
µ
and a squared coefficient of
variation of cB2 . Any kinds of queueing models can be derived from this model. For example, since, for a random variable with an exponential distribution, the mean and the standard deviation are the same, an M/M/1 queue is a special GI G 1 queue with c A2 = cB2 = 1 . We assume that a system has n nodes, and these nodes have heterogeneous capacities. The capacities of the nodes are described by a random variable µ and the capacity of a node i is written µi . The requests arriving at nodes are described by another random variable λ , and the requests that arrive at node i have an arrival rate of λi . The total of the node capacities in the system is µtotal = ∑ µi , and the total request rate in the i
system is λtotal = ∑ λi . The following approximation holds for the waiting time of i
requests on a node i: Wi ≈
λ ρ i / µi c 2A + cB2 ⋅ where ρ i = i [Bolch1998]. According to 1 − ρi 2 µi
Bolch, this “well-known Allen-Cunneen approximation formula” “is exact for M/G/1 and a fair approximation elsewhere and is the basis for many other better approximations.” Therefore, the mean response time of service requests on node i can be approximated as: Ti ≈
ρ i / µi c 2A + cB2 1 ⋅ + 1 − ρi 2 µi
(Equation 4.1).
In the first case, the nodes have their available capacities equalized, and the available capacities on nodes satisfy
∀i : avci =
µtotal − λtotal n
= avc . Since, in this thesis, we
defined ∀i : avci = µi (1 − ρ i ) = µi − λi , then, the right side of 4.1 becomes: c 2A + cB2 1 ⋅ + . 2 µi avc
ρi
67
Since ρ i = 1 −
Ti ≈
avc
µi
, we get
1 c A2 + cB2 1 c A2 + cB2 1 ⋅ − ⋅ + 2 2 µi µi avc
.
c 2 + cB2 1 c 2A + cB2 = A + 1 − µi 2 2avc
Since the values of c 2A and cB2 are the same on all nodes, the expected value of the mean response times of the nodes satisfies
[]
ΕT =
1 c 2 + cB2 c 2A + cB2 + Ε 1 − A 2 2avc µ
1 c 2 + cB2 n (c 2A + cB2 ) = + Ε 1 − A 2(µtotal −λ total ) 2 µ
(Equation 4.2),
and the variance of the mean response times of the nodes satisfies: 1 c 2 + cB2 var T = var 1 − A 2 µ
[]
2
(Equation 4.3).
In the second case, the utilizations of the nodes are equalized. Utilization is another kind of load index which has been used by several load balancing schemes proposed for P2P systems. This choice is consistent with the techniques that balance the load among several nodes, such as in the M/M/m queueing model or for an asymmetric (or heterogeneous) system as described in [Bolch1998]. In order for such systems to have optimal performance, these techniques ensure that the utilizations of the different nodes are the same, but they also assumes that there is a common queue for dispatching requests to the nodes. Since P2P nodes do not have a common queue for their requests, we perform in the following an analysis, similar to the case of equalized available capacities, for a P2P system using utilization as load index where the performance of the nodes is modeled by individual GI G 1 queues (without a common queue). Then, we will
68
compare this case with the first one considering the expected value and variance of the mean response times on the nodes. The results from this comparison indicate that, when a technique equalizes the utilization of nodes, the mean response times of services (including the expected value and the variance of the mean response times of nodes) are not the smallest. We assume that the utilizations of the nodes satisfy ∀i : ρ i =
becomes:
λtotal = ρ . Then, 4.1 µtotal
1 ρ c A2 + cB2 c A2 + cB2 1 + = ⋅ + 1 . µi 1 − ρ µi µi 1 − ρ 2 2 1
ρ
⋅
Then, the expected value of the mean response times of nodes is: 1 ρ c 2A + cB2 Ε T = Ε ⋅ + 1 2 µ 1 − ρ
[]
(Equation 4.4)
1 c 2 + cB2 λtotal = Ε ⋅ A + 1 2 µ µtotal − λtotal
1 ρ c A2 + cB2 var T = var ⋅ + 1 2 µi 1 − ρ
[]
2
1 λtotal c 2 + cB2 = var ⋅ A + 1 2 µi µtotal − λtotal
2
(Equation 4.5)
In order to compare the results for the two cases regarding the expected values of the mean response times, we calculate the difference DΕ by subtracting the expected value defined by 4.2 from the expected value defined by 4.4. We obtain
1 1 c 2 + cB2 λtotal c 2 + cB2 n c 2 + cB2 . DΕ = Ε ⋅ A + 1 − ⋅ A + Ε 1 − A 2 2 2 µ µtotal − λtotal µ µtotal − λtotal Since µtotal = nΕ[µ ] and λtotal = nΕ[λ ], we obtain
69
1 1 c 2 + cB2 c 2 + cB2 1 c 2 + cB2 λtotal n DΕ = Ε ⋅ A + 1 − ⋅ A + Ε 1 − A 2 2 2 µ µtotal n − λtotal n µ µtotal n − λtotal n =
1 c A2 + cB2 1 1 Ε Ε[λ ] − 1 + Ε (Ε[µ ] − Ε[λ ]) ⋅ 2 Ε[µ ] − Ε[λ ] µ µ
1 c A2 + cB2 1 Ε[µ ]Ε − 1 = ⋅ 2 Ε[µ ] − Ε[λ ] µ
∑x
i
In general, for a random variable X, its arithmetic mean
harmonic mean
i
n
is not less than its
1 n . Therefore, we get Ε[µ ]Ε ≥ 1 , and, DΕ ≥ 0 . This indicates µ ∑1 xi i
that the expected value in the second case is larger than that in the first case. We conclude that the mean response times of services on nodes have a smaller expected value when the available capacities are equalized, as compared with the case that the node utilizations are equalized, Next, we investigate the variance of the mean response times of nodes. For the first case (where the available capacities are equalized), Equation 4.3 shows that the variance of the mean response times of requests is equal to the variance of the requests’ services 2
c 2 + cB2 c 2 + cB2 . We define the term A times multiplied by a factor 1 − A the “variation of 2 2 requests”, and its value is independent of the capacities of nodes. Equation 4.3 indicates that, in the case where
c 2A + cB2 > 1 , the larger the variation of requests is, the larger the 2
c 2A + cB2 variance of the mean response times is. However, in the case where 0 < ≤ 1 , it is 2 the opposite. For the second case, Equation 4.5 indicates that the variance of the mean
70
response time is determined by a function of the variation of the requests and the variance of service times. Since the function has a factor
ρ 1− ρ
, the higher the utilization is, the
larger the variance of the mean response times is. In the following, we investigate the difference between the variances of the mean response times of nodes in the above two cases. We denote this difference by Dvar . We calculate Dvar by subtracting the variance defined by Equation 4.3 from the variance defined by Equation 4.5 as: 2
Dvar
2
1 ρ c A2 + cB2 1 c 2 + cB2 . = var ⋅ + 1 − var 1 − A 2 2 µi 1 − ρ µi
If we have Dvar > 0 , this indicates that the technique that equalizes available capacities is more effective since the variance in the first case is smaller. If we have Dvar < 0 , this indicates the opposite. If we have Dvar = 0 , this indicates that there is no difference between the effectiveness of the two technique. These cases are discussed in more details below. We note that we do not consider systems working with a very low utilization close to zero. We do not consider systems whose nodes are modeled by D/D/1 queues, neither; in this case, there are no variations, and we c 2A = cB2 = 0 , and therefore ∀ρ : 0 < ρ < 1 , Dvar = 0 . In the following, we present the properties of Dvar derived from its approximation in the following cases: c A2 + cB2 1) For ∀c , ∀c : 0 < ≤ 2 and ∀ρ : 0 < ρ < 1 , the inequality Dvar > 0 is 2 2 A
2 B
satisfied.
71
2) For ∀c A2 , ∀cB2 : when
c 2A + cB2 2(1 − ρ ) > 2 and ∀ρ : 0 < ρ < 0.5 , let C = . Then 2 1 − 2ρ
c 2A + cB2 c 2 + cB2 < C , we have the inequality Dvar > 0 ; when A = C , we have 2 2
Dvar = 0 ; and when 3) For ∀c A2 , ∀cB2 :
c 2A + cB2 > C , we have the inequality Dvar < 0 . 2
c 2A + cB2 > 2 and ∀ρ : ρ ≥ 0.5 , the inequality Dvar > 0 is satisfied. 2
These properties indicate that, in general, the technique that equalizes the available capacities on nodes is more effective. First, for systems whose requests have the variation (regarding
c 2A + cB2 ) as small as those in the range defined by Case 1 (for example, a 2
system with nodes modeled as M/M/1 queues), the technique that equalizes available capacities on the nodes is more effective. Compared to the variance in the second case, the variance in the first case is smaller since Dvar > 0 . Also, this effectiveness depends on the average utilization of the system. The higher the utilization is, the larger the effectiveness is. Second, when the requests in a system have variations as large as those in the range defined by Cases 2 or 3, Dvar depends on the average utilization of the system and the variation of its requests. For a system efficiently working (with an average utilization ρ not smaller than 0.5), the technique that equalizes available capacities is more effective whatever the variation of requests in the system is. However, when the average utilization ρ is less than 0.5, the technique that equalizes utilizations becomes more effective in the case that the variation of requests is larger than the value of C defined above (that is,
c 2A + cB2 > C ); otherwise, either the technique that equalizes 2
72
available capacities is still the one that is more effective (when
no difference between these two techniques (when
c 2A + cB2 < C ), or there is 2
c 2A + cB2 = C ). 2
According to the above analysis, we conclude that the technique that equalizes the available capacities of the nodes is more effective than the technique that equalizes utilizations. Using the former technique, a system has a smaller expected value and a smaller variance for the mean response times of nodes. Also, the variance of the mean response times on its nodes is bounded by a fixed value. For a system where utilizations are equalized, this variance is bounded by
1 . 1− ρ
Our definition of available capacity is consistent with the Mean Value Analysis (MVA) derived from operational laws. Although we analyzed the mean response times of nodes in the above section, it is difficult to precisely predict the mean response time of a system since there are also other factors that affect the mean response time of a system, for example, the scheduling methods, or the influence of the utilization of a node on the variation of requests on the node. Mean Value Analysis is a practical method for estimating the performance of a system. This kind of analysis is derived from operational laws where the equations with the parameters like mean response time, throughput, and utilization of a device are defined. The performance of a system can be estimated by these equations when some of their parameters are measured. These equations are further extended for analyzing the performance of open queuing networks or closed queuing networks (called Mean-Value Analysis) [Jain1991]. The numerical analysis by Cavendish et al. [Cavendish2010] pointed out that the mean response time calculated from the mean
73
value analysis is the upper bound of that obtained by using a queuing model. Also, the results from their simulation experiments supported well their analysis. In this thesis, we define the available capacity of a node i as avci = Ci (1 − ρ i ) where the Ci =
capacity of the node. Meanwhile, the function Ri =
1 is the Si
Si is derived from operational 1 − ρi
laws for evaluating the mean response time of requests on a device i , where Si is the mean value of the service times of these requests, and ρ i is the utilization of nodes. Combining the above two equations, we conclude that, when the nodes in a system have the same available capacity, the services on these nodes have the same mean response times. Combining the above results and those in Section 4.2.1, we conclude that using available capacities as load index is more effective than using utilizations for a load balancing scheme.
4.2.2. Load balancing operation The designed diffusive scheme specifies load balancing policies. These policies are realized by the load balancing operations that are run on each node. We call the node that is executing an operation the operating node. The nodes for which an operation balances the load are the neighbors of the operating node. An operating node and its neighbors compose the neighborhood of an operation. The diffusive scheme specifies that the load status of a node is the available capacity of the node. Its Information policy specifies that a node collects the load statuses of its neighbors at the beginning of an operation. Its
74
transfer and location policies select senders and receivers from the nodes in the neighborhood. A node periodically executes the load balancing operations of the diffusive scheme. An operation goes through three stages which conduct the policies of the diffusive scheme. We describe these three stages in the following: •
Information: at this stage, the operating node determines its own available capacity and collects the available capacities of its neighbors through sending probing messages to them. The operating node waits for the responses from them. A probed neighbor responds with its available capacity if it is not involved in another balancing operation. After all responses are received, the operation goes to the decision stage.
•
Decision: first, the operating node calculates the average available capacity of the neighborhood. Then, a node is identified as a candidate receiver (sender) if its available capacity is larger (smaller) than the average. The operation at this stage identifies one or several pairs of receivers and senders and sends a load transfer request to the sender of each pair, including the ID of the selected receiver (which is the target of the load transfer) and the load that should be transferred (called required capacity). The details of the operation at this stage depend on its decision algorithm. We will discuss different decision algorithms in the following section.
•
Load transfer: note that objects are moved from a load-sender node to a loadreceiver node to bring the balance. After a sender receives an instruction for load transfer, it will select objects and transfer them to the receiver.
75
After having performed an operation, the operating node will go back to the processing of the normal service requests until the time has come for another load balancing operation. Operations on different nodes are not synchronized. These operations may run concurrently on different nodes, however, a node involved in one such operation will refuse the participation in another load balancing operation initiated by one of its neighbors. In this way, the load status information collected from a neighbor during an operation is always correct. We design a state diagram to show the stages of these load balancing operations in Figure 4.1. The execution of an operation on an operating node is triggered by a timeout event called “Triggering Timeout” after a predefined amount of time “sleeping” from the last operation execution, or a state change event when the node becomes either overloaded or under-loaded according to a static threshold. This execution sends out probing messages to its neighbors and waits for their responses in the “Load Determination” state. It enters the “Decision” state after the “GetResponses Timeout” expires, and makes decisions for load transfers. Then, it goes to “sleeping” again after sending the load transfer instructions to all the senders.
response
Send Probe Messages
Triggering Timeout sleeping
Send load transfer instructions
Load Determination
GetResponses Timeout
Decision
Figure 4.1 The state diagram of the load balancing procedure
76
In a P2P system, the load balancing operations are run by a node in regular time intervals, called a round. It is assumed that the message delay in the P2P system is bounded. When a node is in the “Load Determination” state, it waits for responses from the probed nodes. Since the messages of load balancing operations are transferred on the P2P connections, the health of these connections can be monitored by the functions of the P2P overlay network, and the delay time of transferring messages between nodes can be estimated. The waiting time of the “GetResponses” timer can be set according to the estimated delay. The time of the “sleep” timer is set according to the performance requirement of the system. We further formalize the diffusive load balancing in Appendix A. We call it “asynchronous load balancing with local synchronism”.
4.2.3. Decision algorithms In this section, we describe different algorithms that could be used in the decision stage of a load balancing operation. They are the Proportional, Complete Balancing (CB), Directory-Initiated (DI), Sender-initiated (SI) and Receiver-initiated (RI) algorithms. We assume that objects can be divided into infinitely small pieces at the size of fine granularity; also, they can be moved to any neighbor in the system. As an overlay construction protocol could avoid the change of overlay links when the objects are relocated to their consecutive neighbors (e.g. the way designed in [Li2006] or CAN [Ratnasamy2001]), we simply assume that the changes of overlay network caused by the load transfers are handled by the protocol of the overlay network.
77
We use here the following notations. The operating node of a load balancing operation is called node i . The neighborhood of the operation is denoted as Ai , and the number of nodes in the neighborhood is |Ai|. A node in Ai is identified as a node j . A node x has a node capacity equal to Cx. If a node has services with a total resource requirements of lx, its available capacity is avcx= Cx - lx. We write avcx and lx to represent the available capacity and the workload of node x at the beginning of an operation, respectively. We write avc ′x for the situation at the end of an operation. For example, when services with resource requirements l have redirected from node x to y at the end of an operation, avc ′x = avc x + l and avc ′y = avc y − l .
4.2.3.1. Proportional algorithm The Proportional algorithm (Prop.) has been discussed in [Xu1997], and we assume that the algorithm uses the available capacities of nodes as their load measure. Here, the decision algorithm determines the following load exchanges between node i and each other node j in its neighborhood: load equal to k(avci-avcj) will be transferred from node j to node i (if the value is negative, the exchange proceeds in the opposite direction), where k is a constant between zero and one. At the end of the operation, when all these exchanges have been performed, the new available capacities are as follows:
avci′ = (1 − dk )avci + k ∑ avc j for i where d=|Ai|-1, and avc′j = (1 − k )avc j + kavci for any j
neighbor j other than i.
78
4.2.3.2. Complete Balancing algorithm The Complete Balancing (CB) algorithm (also described in [Xu1997]) equalizes the available capacities of all nodes in the neighborhood of node i during an operation. The average available capacity of the nodes in the neighborhood of node i (including node i) is
∑ avc avcAi =
j∈Ai
j
(Equation 4.6).
Ai
The CB algorithm determines load exchanges such that at the end of the operation all nodes in the neighborhood have the same available capacity.
4.2.3.3. Directory-Initiated algorithm The Directory-Initiated (DI) algorithm also calculates the average available capacity of a neighborhood using Equation 4.6, but in contrast to the previous algorithms, it organizes the load transfer in terms of pairs of senders and receivers. A similar algorithm was proposed in [Corradi1999] for parallel computer programs. Based on the value of the average, the algorithm classifies all nodes as either overloaded (if its available capacity is smaller than the average), under-loaded (if its available capacity is larger than the average), or equalized. The overloaded nodes are kept in a vector SVect, and the underloaded nodes in RVect. The algorithm uses the procedure shown in Figure 4.2 to decide load migrations.
79
1 2 3 4 5 6 7 8
Decision Procedure Do forever if SVect and RVect are not empty
s = min {avc j } j∈SVect
r = max {avc j } j∈SVect
decide a transfer with the load equal to min{avc Ai − avcs , avcr − avc Ai } from s to r remove s from SVect and r from RVect else break; Figure 4.2 The decision procedure of the DI algorithm
The procedure stops in the case that one of the two vectors is empty (line 2). Otherwise, it selects a pair of a sender s and a receiver r such that the two nodes have the largest difference between their loads among all of the nodes remaining in the two vectors (line 3 and 4). Line 5 decides the load that could be moved between s and r according to the differences between their available capacities and the average. The sender s will not be under-loaded and the receiver r will not be over-loaded after the load transfer. The procedure continues after removing s from SVect and r from RVect.
4.2.3.4. Sender-Initiated and Receiver-Initiated algorithms Like the DI algorithm, the Sender-Initiated (SI) and Receiver-Initiated (RI) algorithms identify overloaded and under-loaded nodes according to the average calculated by Equation 4.6. However, there is only one sender in the SI algorithm, and only one receiver in the RI algorithm. Similar algorithms have been proposed for parallel computing systems in [Willebeek-leMair1993].
80
In the SI algorithm, node i is identified as a sender s if its available capacity is smaller than the average; otherwise, no load transfer will take place. The procedure for deciding the load transfer is shown in Figure 4.3. The load transferred out from node s (called avcrequired ) is the difference between the average and the available capacity of s (line 1). The total providable available capacity (called avc providable ) is obtained from the providable available capacities of all under-loaded nodes. The load to be transferred into a receiver is proportional to its providable available capacity (line 6). The under-loaded nodes in RVect are taken one by one for deciding the load transfers. The RI algorithm has a similar procedure where the receiver takes the role of the sender in Figure 4.3, and its exceeding available capacity (i.e. providable available capacity) will be distributed to all the overloaded nodes. Decision Procedure 1
avcrequired = avc Ai − avc s
2
avc providable =
∑ (avc
r
− avcAi )
r∈RVect
3 4 5 6
Do forever if RVect is not empty for some node r in RVect decides the transfer with the load of
avcrequired (avcr − avcAi ) / avc providable from s to r 7 8
remove r from RVect else break; Figure 4.3 The decision procedure of the SI algorithm
4.3. Convergence and convergence speed In this section, we consider the effectiveness of diffusive load balancing in a P2P system that has a static workload. In this system, no services are added or removed, and
81
the request rate of each service is not changed. At the beginning, the workloads are randomly distributed over the nodes. We study how this asynchronous, diffusive load balancing will lead the system to a globally balanced state where all nodes have the same available capacity. First, we discuss the convergence of the diffusive scheme from an analytical viewpoint, and then we present some simulation results which provide a more detailed comparison.
4.3.1. Analytical investigation The function that the Proportional algorithm uses to calculate the new available capacities of nodes is the function of an asynchronous diffusion scheme presented in [Xu1997] where workload is replaced by available capacity. The proof in [Xu1997] shows that, after an operation, the variance of the workload of all nodes in the system is decreased by a given factor a (smaller than 1). This means that the variance follows a geometric series of values which converges to zero. Hence, the Proportional algorithm converges when it uses available capacity as load measure. We can provide similar proofs of convergence for the other decision algorithms as follows. We first discuss the CB algorithm in detail, and then comment on the situation for the other decision algorithms. We assume that there is a P2P system that consists of N nodes, and the global average
∑ avc of
the
available
capacities
∑( AVC − avc )
of
its
nodes
is
AVC =
j
N
j
.
We
write
2
j
σ 2 (avc) =
j
N
for the variance of the available capacities of the system at
the time before a node i starts its load balancing operation. Now we want to calculate the
82
variance of the available capacities after this operation, written as σ 2 (avc′) . We have the following formula to calculate the variance of available capacities: Nσ 2 ( avc′) = ∑ ( AVC − avc′j ) 2 j
=
∑ ( AVC − avc′ ) j
2
+
j∈ Ai
∑ ( AVC − avc′ )
2
j
j∉ Ai
The formula is composed of two terms. The first term is over all of the nodes j that are within the neighborhood Ai (including i), and it is equal to Ai ( AVC − avcA ) 2 , where i
avc Ai is the average of the available capacity of the nodes within i’s neighborhood and |Ai| is the number of nodes in this neighborhood. Since this local average avc Ai is obtained over a set of |Ai| nodes, the square of the difference between a local average
1 2 σ (avc) . Since the avc Ai and the global average of AVC , is on average equal to Ai second
term
above
evaluates
to
( N − Ai )σ 2 (avc)
,
we
obtain
Nσ 2 (avc′) = ( N − Ai + 1)σ 2 (avc) or
σ 2 (avc′) = (1 −
Ai − 1 2 )σ (avc) N
(Equation 4.7).
Since this reduction factor for the variance holds for any local load balancing operation that is performed by any node in the system, we see that the value of the variance follows a geometric series that converges to zero. Now we are interested in estimating by which factor the variance decreases over a period of one round, which is the time interval within which each node of the overlay network is supposed to have performed exactly one load balancing operation. Since there will be N load balancing operations within this period, we obtain a decrease by a factor of
83
∏(1 − i
Ai −1 ) ; in the case that all operations have the same size of neighborhoods |A|, N
the factor is equal to (1 −
A −1 N ) . Since |A| is much smaller than N, we can use the N
x approximation that (1 + )n = e x for large n, and obtain a variance reduction factor for the n 1− A (1− A )
period of one round equal to e
, or a factor of e
2
for the reduction of the standard
deviation of available capacities. Then, we have Equation 4.3 for the available capacity of the system at round t+1:
σ 2 (avct +1 ) = e(1− A )σ 2 (avct )
(Equation 4.8).
The DI, SI and RI decision algorithms are expected to provide slower convergence than the CB algorithm discussed above, because at the end of a load balancing operation by a node i, the available capacities of the nodes within its neighborhood would be less uniform than in the case of the CB algorithm. For example, in the case of the SI algorithm, half of the times, there is no change in the load distribution, namely when node i is under-loaded. If node i is overloaded, its available capacity will reach the neighborhood average and the available capacity of the under-loaded nodes will be increased by smaller amounts. If we ignore the changes of the under-loaded nodes, we obtain the formula σ 2 ( avc′) = (1 −
1 )σ 2 ( avc ) – note that we have ignored here the 2N
difference between the global average and the average within the neighborhood. Therefore we expect that the standard deviation of available capacities is reduced over 0.25 the period of one round by a factor of e . This would be similar for the RI algorithm.
84
The convergence speed of the DI algorithm is more difficult to estimate, since during a single load balancing operation, several sender-receiver pairs exchange parts of their load. For each of the resulting load transfers, one of the partners will reach the neighborhood average, but it is difficult to estimate how many pairs will be identified and how much the load change of the other partner contributes to the reduction of the variance. However, since the DI algorithm drives more nodes to reach the average of the neighborhood during one operation than the SI or RI, it is clear that the convergence speed of this algorithm is expected to lie between the speeds of the CB and SI algorithms.
4.3.2. Simulation experiments The analysis in Section 4.3.1 is only approximate, and it does not consider the effect of the structure of P2P overlay networks. To further study the issues, we made simulation studies and measured the convergence speed of the diffusive load balancing in an overlay network with a skip-list structure, as described below. As the diffusive scheme does not require any specific structure for the P2P system to collect the load statuses of nodes or to disseminate load, the scheme could be used in any structured P2P system. However, the effectiveness of the scheme will in general depend on the neighborhood structure used for information collection and load dissemination.
85
4.3.2.1. A peer-to-peer system with a skip-list overlay network We assume that the system using our diffusive scheme has a skip-list overlay network. A skip-list is a data structure for storing and accessing data or service items. It has multiple-level lists. At level 0, all elements are connected in order, and at level i , elements are sequentially picked from level i − 1 with a certain probability p and connected in the same order as well. There is only one node at the highest level log p N for an N -node skip-list. The process of searching an element in the skip-list is similar to that in a tree structure; therefore, the time complexity of a search is O (log p N ) [Pugh1990]. Such skip-lists are used by many P2P systems, such as Chord, Mercury and DPTree, to construct their overlay networks. The time and message complexities of a search can be maintained as O (log N ) in these overlay networks. We assume that there are N nodes in the network. Each of these nodes is assigned a unique ID. An ID is an integer number chosen from 0 to N − 1 . These nodes are connected into a ring in ascending order of their IDs. Node i , in position i , will take nodes in the positions (i + 2 0 ) mod N , (i + 21 ) mod N , K , (i + 2 log 2 ( N −1) ) mod N , as neighbors, that is, the immediate neighbors connecting i at levels 0 to log 2 ( N − 1) is a skip-list. In an overlay network of this kind, a node has log 2 ( N − 1) fingers called outdegree connections that point to its neighbors, and log 2 ( N − 1) fingers called in-degree connections that point to it from other nodes, and the diameter of the overlay graph is
86
O(log N ) . Figure 4.4 shows an example of the connections between nodes and the routing table of a node in a system of 17 nodes. Figure 4.4(b) shows the routing table of node 0. The routing table stores the IP addresses of its neighbors 1, 2, 4, 8, and 16 (pointed by the fingers in Figure 4.4(a)). node0
node16
node1 node2
node4
node8
(a)
(b) Figure 4.4 The connections of node0 in the overlay with a skip-list structure: (a) the fingers of node0, (b) the routing table of node0
87
4.3.2.2. Experiments and their results The experiments in this subsection are mainly provided for showing the convergence of the load balancing scheme. The speeds of convergence for the scheme with different decision algorithms are also compared. In these experiments, the parameters defining the simulation and the simulated system are configured first. The system use the skip-list overlay network described above, and it has 1,000 nodes (N=1000). All nodes have the same capacity (C=10 requests/second). Initially, the available capacities of the nodes are uniformly distributed in the range of [0,10], with a mean of 5 which leads to a standard deviation of 2.88. We assume that the objects of the system are fine grained, that is, loads of arbitrarily small sizes may be moved. The effectiveness of the scheme, including the convergence ratios and the loads transferred during the rounds (defined in Section 4.3.1) of load balancing, is evaluated. The convergence ratio γ t during round t is the ratio of σ ( avc t ) to σ ( avc t −1 ) where
σ ( avc t ) is the standard deviation of the available capacities collected at the end of round t and called the standard deviation of load of the system. Comparing two convergence ratios, the smaller one indicates the larger reduction of the standard deviation of available capacities, and the load balancing converges faster and stronger. The amount of loads transferred between nodes is also collected. For transferring loads, a system has to spend some processing power of its nodes on packing and unpacking objects and some bandwidth of its network links on transmitting the packages of objects. Therefore, the cost of load balancing is evaluated by measuring the amount of loads transferred between
88
nodes. These measurements are collected from 20 runs of the experiments. The mean and
1
Prop. CB DI SI RI
0.8
1
convergence ratio
standard deviation of normalizedavailable capacities
the 95% confidence interval of the mean for each measurement are displayed.
0.6 0.4 0.2
0.8
Prop. DI CB SI RI
0.6 0.4 0.2
0
0
0
1
2
3
4
5
1
2 3 4 round of load balancing
round
(a)
5
(b) proportion of loads transferred (%)
100
Prop. DI CB SI RI
80 60 40 20 0 1
2 3 4 round of load balancing
5
(c) Figure 4.5 The progress of the diffusive load balancing with various decision algorithms: (a) standard deviation of normalized available capacities, (b) convergence ratio, and (c) proportion of loads transferred
Figure 4.5 shows the effectiveness of diffusive load balancing during the first 5 rounds. Figure 4.5(a) shows the reduction of the standard deviation of normalized available capacities during load balancing. The normalized available capacities are the available capacities at the end of that round normalized by the average workload of the system. We will further explain the concept of normalized available capacity in Section 5.3.1. Since the system keeps the same average workload during load balancing, Figure 4.5(a) also shows the reduction of the standard deviation of available capacities. We
89
observe that, for a given decision algorithm, the convergence ratios of the rounds change as the available capacities become more similar. During the first round, the standard deviation of available capacities drops most rapidly (Figure 4.5(b)), and the system has the largest proportion of loads transferred (Figure 4.5(c)). In the following rounds, the load balancing resolves the differences between the available capacities of nodes in a slower manner with fewer loads transferred. We also observe that, after the experiment runs for 10 rounds, there are very few loads transferred in the system, and the standard deviation of available capacities approaches zero. We say that the system is in a globally balanced state, and the diffusive scheme converges. We also observe that the decision algorithms converge at different speeds. The CB algorithm converges most rapidly among all the algorithms. This algorithm has a convergence ratio γ 1 close to 0.002, which indicates that the standard deviation of available capacities drops by 99.8% in the first round (Figure 4.5(a) shows that the standard deviation of the normalized available capacities drops from 0.573 to 0.001). In the following rounds, the convergence ratios of the CB algorithm could be kept as small as 0.01. The SI and RI algorithms converge much slower than the other algorithms (e.g. the standard deviation of available capacities drops by 78% in the first round with γ 1 around 0.22). Among the practical algorithms (i.e. DI, SI and RI), the DI algorithm has the smallest average convergence ratio, and this convergence ratio is close to that of the CB algorithm (with γ 1 around 0.02). This observation indicates that resolving multiple pairs of senders and receivers, as done by the DI algorithm, improves the effectiveness of diffusive load balancing. The Proportional algorithm converges faster than the SI and RI
90
algorithm and slower than the DI algorithm. The data in the figure confirms the predictions of our analysis given above. We conclude that the DI algorithm is the best candidate for use in the diffusive load balancing scheme within a P2P system. The CB algorithm is an ideal algorithm which would be difficult to implement in a distributed P2P system. The proportional scheme requires transferring more loads than the DI, SI or RI algorithms. The DI, SI and RI algorithms result in about 35% of the total loads to be transferred between nodes for the standard deviation of available capacities to drop by 99% from the beginning. Among these algorithms, the DI algorithm converges fastest.
91
5. Characteristics of the diffusive load balancing scheme We studied the effectiveness of the diffusive load-balancing scheme in a P2P system with a skip-list overlay network in the last chapter. Now, we examine the effectiveness of the scheme in more detail. In this chapter, we consider various kinds of neighborhoods, and systems with various workload distributions, sizes, and degrees of churn. Then, we compare the diffusive scheme with some other dynamic load balancing schemes proposed for P2P systems. At the end, the diffusive scheme is modified for P2P systems hosting large-sized services, and the impact of sizes of these services on the effectiveness of the scheme is also examined.
5.1. Using random neighborhoods There are two kinds of random neighborhoods that we consider in this subsection. One is the neighborhoods provided by a random-graph overlay network and called random-graph neighborhoods. Another is the neighborhoods with neighbors collected by random walks and called random-walk neighborhoods. The kind of neighborhoods in a skip-list overlay network is called skip-list neighborhoods. The term “overlay network neighborhood” implies either a skip-list or random-graph neighborhood.
92
5.1.1. Random-graph structured overlay networks Researchers have shown that diffusive load balancing requires different times to converge in systems with different structures. For example, it converges faster in a hypercube-structured system than in a ring-structured system. The skip-list overlay network considered in the last chapter is similar to the architecture of a hypercube network. We investigate whether the proposed diffusive load balancing scheme converges faster in a skip-list overlay network than in a random-graph overlay network. We did simulation experiments based on a simulated P2P system with a randomgraph overlay network. We kept the configuration used by the experiments in Section 4.3.2.2 except that the nodes are randomly connected. In order to construct a randomgraph overlay network, the simulation program randomly chooses O(logN) nodes to be the neighbors of a node at beginning. For a specific node, its neighbors do not change during an experiment as long as there is no node joining or leaving. The neighborhoods in a random-graph overlay network are used by the operations of the diffusive scheme. Similar to the previous experiments, the following experiments use systems with static workloads. Figure 5.1 shows the convergence ratios during the first five rounds of the decision algorithms presented in Section 4.2.3. Compared with the results shown in Section 4.3.2.2, the performance of the CB algorithm is not much changed in this random-graph overlay network; its convergence ratios are still as small as 0.003. However, the
93
performance of the other algorithms is degraded. The convergence ratios are increased by 10% for the Proportional, SI and RI algorithms. For the case of the DI algorithm, the convergence ratios are increased by a factor of about 2 to 4. For example, the DI algorithm has γ 1 around 0.012, and γ 5 (i.e. the convergence ratio of the fifth round) around 0.30 with skip-list neighborhoods, and γ 1 around 0.046 and γ 5 around 0.6 with random-graph neighborhoods. Accordingly, we claim that the diffusive scheme performs better with skip-list neighborhoods than with random-graph neighborhoods.
convergence ratio
1 0.8
Prop. DI CB SI RI
0.6 0.4 0.2 0 1
2
3
4
5
round of load balancing
Figure 5.1 The convergence ratios of the diffusive load balancing in the overlay network with a random-graph topology
5.1.2. Random walks Another kind of random neighborhoods has been proposed for load balancing where, for each load balancing operation, a new random neighborhood is dynamically established by random walks. The schemes proposed in [Bharambe2004] and [Zhong2008] are schemes for P2P systems of this kind. We investigate the convergence of the diffusive scheme when it uses random walks to dynamically construct its
94
neighborhoods. In our simulation experiments, the operating node of a load balancing operation randomly chooses log 2 N nodes at the beginning of the operation. Figure 5.2 shows the convergence ratios of the different decision algorithms in the first 5 rounds. The classic Proportional algorithm does not perform well in this context. We observed that there is still some degree of load imbalance that cannot be resolved. Especially, the standard deviation of the available capacities on nodes is kept around 0.05 even when the experiment is run for 50 rounds. The CB algorithm is less affected by the changing of neighbors during the progress of load balancing. Therefore, we say its effectiveness does not depend on what kind of neighborhoods is used: the skip-list or random neighborhood. The SI and RI algorithms perform better by using random-walk neighborhoods than by using overlay network neighborhoods. Starting from round 2, their convergence ratios become much smaller than those for the overlay network neighborhood case (including the skip-list neighborhoods and the random-graph neighborhoods). We think that a node has more chance to be a sender or a receiver when the domain of the load balancing operations is changed each time, and the reduction of load differences is also larger than in the case of overlay network neighborhoods. The DI algorithm does not have any improvement for its convergence speed by using random neighbors. Meanwhile, we observe that the proportion of loads transferred between nodes in a system using the DI, SI or RI algorithm is very similar to that in the previous case. In summary, the diffusive scheme has different performance when it uses different kinds of neighborhoods. The SI and RI algorithms perform better with random-walk neighborhoods. The performance of the DI algorithm does not have much difference whether the random-walk neighborhoods or skip-list neighborhoods is used. However,
95
the performance of the diffusive scheme is degraded when random-graph neighborhoods are used. Since these results were observed in systems whose workloads have initially a distribution which is uniformly distributed between two extreme values, we investigate next the effectiveness of the scheme in systems that have initially a skewed workload distribution.
convergence ratio
1 0.8
Prop. DI CB SI RI
0.6 0.4 0.2 0 1
2
3 rounds
4
5
Figure 5.2 The convergence ratios of the diffusive load balancing with random neighbors
5.2. Skewed workload distribution It has been shown that, in some cases, the workload distributions of P2P systems are highly skewed. For example, the popularity of files is described by a Zipf distribution in [Zhao2006]. To simulate a skewed workload distribution, we configure the simulated system with a number of hot spots. We consider different cases with the following fractions of nodes being hot-spots: 0.001, 0.01, 0.1, 0.2, or 0.4. The fraction of 0.001 corresponds to the case of one hot-spot in the 1000-node system. At the beginning of an experiment, the workloads of a system are evenly distributed over all of its hot-spots.
96
These workloads on the hot-spots will be redistributed to the other nodes by the load balancing operations. The DI and SI algorithms are used in the experiments for collecting the following results. These algorithms use skip-list neighborhoods or random-walk neighborhoods. We observed that the convergence ratios in the first round are different in these cases. However, during the progress of load balancing, for the case of a specific algorithm with a specific kind of neighborhoods, the convergence ratios approach those found in the previous experiments. For example, in the case of the one-hot-spot workload, the DI algorithm with skip-list neighborhoods has γ 1 as large as 0.34. During the second round, the convergence ratio drops, and in round 5, γ 5 is 0.30 which is close to that in the case of uniform workload (Figure 4.4(b) and 5.1). Therefore, in Figure 5.3, we show only γ 1 for these different cases.
1
convergence ratio
0.8
DI, skip-list DI, random SI, skip-list SI, random
0.6 0.4 0.2 0 0.001
0.01
0.1
0.2
0.4
uniform
hot-spot workload
Figure 5.3 Comparison of the DI and SI algorithms in systems with hot spots
For the one-hot-spot case, the SI algorithm outperforms the DI algorithm in the first round (Figure 5.3). The SI algorithm could reduce 80% of the standard deviation of available capacities (with γ 1 =0.19), but the DI algorithm only reduces 65% of the load differences (with γ 1 =0.35). One reason for this is that, in the one-hot-spot case, a 97
neighborhood could have one or zero sender with a larger probability at the beginning of the experiment. Since the DI algorithm only selects one receiver for a sender, the DI algorithm resolves fewer differences between the available capacities of nodes than the SI algorithm which can select many receivers for the sender. The performance of the SI algorithm is not much affected by the workload distribution with γ 1 all around 0.2. However, the performance of the DI algorithm largely depends on the fraction of hotspots in the system. γ 1 of the DI algorithm is dropped to 0.23 from 0.35 when the fraction of hot-spots is increased from 0.001 to 0.01. In the case that the fraction of hot-spots is further increased to 0.1, the values of γ 1 of the DI algorithm are close to those observed from the pervious experiments where the system initially have uniformly distributed workload. Moreover, the DI algorithm does not reduce γ 1 much even if the system further increases the number of its hot-spots.
5.3. Working in systems with churn In this subsection, we investigate the effectiveness of the diffusive load balancing in a system that has churn (i.e. node-joining or -leaving). Churn occurs when nodes join or leave a P2P system. This kind of node-joining and leaving could cause the changes of the overlay network. These changes may affect load balancing operations. In some cases, the operating node could disappear in the middle of an operation, and the operation would be aborted. In some cases, a node in the neighborhood could leave. The operation would have fewer nodes in its neighborhood. In both cases, the differences between the loads of the nodes in the neighborhood can not be fully reduced. Especially, in the case that the
98
operating node fails, the differences between the loads of nodes in the neighborhood can not be reduced at all. Shen et al. showed in [Shen2007] that the effectiveness of load balancing is degraded when node failures occur in a P2P system. For example, a system has fewer service requests met their deadlines after the node failures are introduced in the system. We mainly discuss the effect of churn to the load distribution here. Churn also affects the load distribution of a system, and it is the major source that contributes to the variation of workload in a P2P system. Structured P2P systems in general use data replication or recovery mechanisms to deal with node-joining or leaving. For example, when a new node locates its place in a CAN system, the node takes over half of the objects from a neighbor; when a node leaves, the node hands over its objects to a neighbor. Therefore, the workloads on these nodes change. Although the variation of workloads also can be caused by the changes of services’ request rates, the variation induced by churn is much larger. First, a node hosts multiple services. Second, researchers showed that the popularity of files in a file sharing application generally follows a cosine waveform function with a period of a day (i.e. 24 hours) [Lloret2006]. But, the occurrence of churn (i.e. the arrival of churn events) fits to a Weibull distribution [Stutzbach2005]. Therefore, the impact of churn on the variation of workloads is in general more important from the perspective of load balancing. The effectiveness of the diffusive load balancing in a dynamic system had been studied before. For example, Cybenko [Cybenko1989] pointed out that the difference between the workloads of nodes is bounded when tasks or computations are dynamically generated and terminated. Elsasser et al. [Elsasser2004] studied the convergence of a diffusion scheme when nodes change their positions in the network by carrying along
99
their existing workloads. However, these dynamics are all different from the changes of workloads on P2P nodes induced by churn.
5.3.1. The bound of the standard deviation of available capacities We consider a P2P system with churn in the following experiments. We study the standard deviation of available capacities. We also study the impact of the decision algorithm, degree of churn (i.e., the rate of node joining or leaving), and the sizes of workloads, on these standard deviations. In this subsection, we consider homogeneousnode systems whose nodes have the same capacity. We extended our simulated system by using an extra component to implement churn. In the simulated system, node-joining is realized by placing a new node in a position randomly selected from the ring, and the new node takes over half of the objects (or half of its services) from its successor. Node-leaving is realized by disconnecting a node chosen at random from the ring, and the leaving node hands over its objects (or services) to its successor. In order to capture the changes of the overlay network induced by churn, a node rebuilds its neighborhood right before it runs a load balancing operation. The simulated system uses a churn rate to specify the frequency of churn events. We define the churn rate to be the fraction of nodes that join or leave the system during one round of the load balancing operations (see Section 4.3.1). Therefore, the changes of available capacities of nodes induced by churn and the reduction of the differences between these available capacities produced by the diffusive load balancing are evaluated
100
within the same time period. The differences between the available capacities of nodes are shown with the standard deviation of these available capacities (called standard
deviation of available capacities). We assume that, for each node-leaving, there is a node-joining, so that neither the total number of nodes nor the system's average available capacity changes. For example, when the churn occurs at a rate of 0.1 in a system with 1000 nodes, the system would have 50 occurrences of node-leaving and 50 node-joining per round. If the duration of a round is
T
, the mean time interval between two
consecutive occurrences of node joining or leaving is then
T 50 .
Without load balancing, a
system has the standard deviation of its available capacities increasing along with the advance of the experiment. This increase depends on the churn rate. For example, for a homogeneous-node system initially having a uniformly distributed workload, the standard deviation of available capacities increases by a factor of 3 when an experiment runs 50 rounds in the case that churn occurs at the rate of 0.1; the standard deviation increases by a factor of 8 in the case that the rate is 0.9. The practical decision algorithms, such as the DI and SI algorithms, are selected for the following experiments. In an experiment, an algorithm uses skip-list neighborhoods or random-walk neighborhoods. The configurations used for the experiments in Section 4.3.2.2 are kept. These experiments collect the standard deviation of available capacities at the end of the rounds and the proportion of loads transferred during these rounds. We observed that, in a system with churn, the standard deviation of available capacities depends on the average workload of the system. The larger the average workload is, the larger the standard deviation is. Moreover, for systems only different in their average workloads, the ratios of the standard deviation of available capacities to the average
101
workload of the systems (i.e. those with homogeneous nodes) are always the same. We call this ratio the standard deviation of normalized available capacities and use it as a parameter for comparing the performance of different decision algorithms. Figure 5.4 shows the standard deviation of normalized available capacities and the proportions of loads transferred during the first 20 rounds of load balancing. We observe that, after a few rounds, both measurements do not increase along with the advance of the simulated time . We say that, in this kind of situation, the system is in a steady state. We say that the average of the standard deviation of normalized available capacities at the steady state is bounded. However, in a system, the size of the bound depends on the decision algorithm. For the case of the SI algorithm, the bound is about 30% larger than that for the case of the DI algorithm (0.15 for the DI algorithm and 0.2 for the SI algorithm case). This result showed that an algorithm with a faster convergence speed can better control the standard deviation of available capacities under churn. We note that the bounds, for a given algorithm using different kinds of neighborhoods, are not significantly different. Figure 5.4(b) indicates that the costs for load balancing are similar for both decision algorithms. Both these algorithms invoke almost the same proportions of loads transferred when the system is in the steady state. The proportion for a decision algorithm does not depend on what kinds of neighborhoods are used: skip-list neighborhoods or random-walk neighborhoods.
102
proportion of loads transferred (%)
standard deviation of normalized available capacities
1
DI,skip-list DI,random SI,skip-list SI,random
0.8 0.6 0.4 0.2 0
50
DI, skip-list DI, random SI, skip-list SI, random
40 30 20 10 0
0
5
10 round
15
20
0
2
4
6
8
10 12 round
14
16
18
20
(a) (b) Figure 5.4 Effectiveness of the diffusive load balancing in a system with churn at a rate of 0.1, (a) standard deviation of normalized available capacities, and (b) proportion of loads transferred
5.3.2. Varying churn rates Figure 5.5 shows the relation between the bound of standard deviation of normalized available capacities and the churn rate. The experiments used the same system and algorithms as described earlier. The churn rate of the system is varied from 0.1 to 0.9 with increments of 0.1. An additional value of 0.01 is also included. The standard deviations are collected at the ends of rounds from 21 to 50 (the initial 20 rounds are not included), and the average of these standard deviations are taken for calculating the bounds. Each experiment is repeated 20 times. The means of the bounds and their 95%
1
proportion of loads transferred (%)
standard deviation of normalized available capacities
confidence intervals are displayed. DI, skip-list SI, random
0.8 0.6 0.4 0.2 0
100
DI, skip-list SI, random
80 60 40 20 0
0
0.1 0.2 0.3 0.4 0.5 0.6 0.7 0.8 0.9 rate of churn
1
0
0.1
0.2
0.3
0.4 0.5 0.6 0.7 rate of churn
0.8
0.9
1
(a) (b) Figure 5.5 The bound of the standard deviation of available capacities in systems with varying churn, (a) the standard deviation of normalized available capacities, and (b) proportion of loads transferred
103
We observed that the bound increases along with the increase of the churn rate. We have seen in the previous subsections that, in the case that the system has no churn, the bound reaches zero under the effect of the load balancing. In the case that the churn rate is negligible, the load balancing can quickly resolve the load dynamics induced by the churn. Figure 5.5 shows the bounds of standard deviation of normalized available capacities when the system has non-negligible churn rates. In the case that the system has the churn rate of 0.1 and the average workload of 5 requests/second, the DI algorithm using the overlay network neighborhoods is able to control the standard deviation of available capacities around 0.7 (with a standard deviation of normalized available capacity of 0.139). In this case, few nodes would have their available capacities less than zero and be overloaded. In the case that the system has the churn rate of 0.9, the standard deviation is 1.5 (with a standard deviation of normalized available capacity of 0.3), and there are less than 10% of nodes overloaded. However, the bound is not a linear function of the churn rate. We observed that the size of the bound also depends on whether the DI algorithm or SI algorithm is used. Furthermore, the difference between the bounds of the two algorithms is increased when the churn rate increases. When the churn rate is as small as 0.01, the bounds for the two algorithms are almost the same. When the churn rate is as large as 0.9, a system using the SI algorithm would have a bound twice as large as a system using the DI algorithm (0.6 for the SI algorithm, and 0.3 for the DI algorithm). The system has fewer loads transferred when it uses the SI algorithm (Figure 5.5(b)).
104
5.3.3. Nodes with heterogeneous capacities Since our load balancing scheme equalizes the available capacities of nodes, the scheme is able to perform load balancing for P2P systems with heterogeneous nodes, that is, in the case that the nodes have different capacities. We use the insights we found in previous sections to interpret the effectiveness of the scheme here. In a system with static workload, the analysis to the effectiveness of the scheme is also suitable here, and the results are the same. However, this is not the case for a system with churn. In this case, the variation of workloads caused by the leaving or joining of nodes depends on the capacities of nodes. The larger-capacity nodes which have larger workloads would induce larger variations than the smaller-capacity nodes (assuming that all nodes have the same available capacity). In the following experiment, the system has two types of nodes: small-capacity nodes with a capacity of 10 requests/second, and large-capacity nodes with a capacity of 1000 request/second. There are 1000 nodes among which 0.1% are large capacity nodes, and the others are small capacity nodes. The churn rate is 0.1. Figure 5.6 shows the standard deviation of available capacities as a function of time. The figure shows several points with extraordinary high standard deviations. These points are caused by the leaving or joining of the high capacity nodes. Since the number of the high capacity nodes is small, the leaving or joining of these nodes results in some of other nodes becoming hot-spots. The diffusive load balancing resolves these hot spots in one or two rounds. Thereafter, the standard deviation of available capacities is reduced to the value maintained for the system where only the small-capacity nodes are joining or leaving.
105
standard deviation of available capacities
5
DI
4 3 2 1 0 0
5
10
15
20
25 30 round
35
40
45
50
Figure 5.6 Effectiveness of the diffusive load balancing in the heterogeneous node system with churn at a rate of 0.1
As we observed in Section 5.2, the DI algorithm has larger convergence ratios in the one-hot-spot case than the SI or RI algorithm. We propose to modify the DI algorithm and allow the sender (or receiver) to distribute the excess load (i.e. available capacity) to all the under-loaded (or overloaded) nodes in the neighborhood in the case that there is only one overloaded (or under-loaded) node in the neighborhood. This modification is expected to improve the performance of the DI algorithm to deal with hot-spots. The solution in [15] that partitions a node into several virtual nodes and locates these virtual nodes in the different places of an overlay network is an alternative approach.
5.4. Scalability Here discuss the scalability of the load balancing scheme in terms of its effectiveness in a system with a large number of nodes. The scheme is scalable in the case that its effectiveness is not degraded by the increase of the system size. We note that, using the diffusive scheme with the CB algorithm, the system has the standard deviation of the 1− A
available capacities of its nodes) reduced by a factor close to e
2
in a round (where A is
106
the number of nodes in a neighborhood). For a P2P system, the value of A grows along with the increase of the system size. Therefore, the larger the system size, the smaller the factor for the reduction is. For example, in the system with a skip-list overlay network (as discussed in Section 4.3.2.1), the factor for reduction of the standard deviation of available capacities would drop from e factor or a degree of reduction of
1−log2 N 2
to e
1−log2 N +1 2
=e
− log2 N 2
(an improvement by a
e ≈ 1.648 ), in the case that the number of nodes is
doubled from N to 2N. Since the number of messages for a load balancing operation performed by a node is 3 log 2 N , the growth of the number of message for load balancing is also limited. However, the total number of messages per round is more than doubled, since each node perform a load balancing operation per round. From these two perspectives, we conclude that the diffusive load balancing is scalable for P2P systems. In the following experiments, the system has various sizes. The size of the system is exponentially increased (e.g. N=128, 256, 512, and 1024). We assume that the workload of the system is a fixed proportion of the total capacity of the system. For these systems, the workloads are always set to 50% of the total capacity of the system. We first discuss the convergence ratios of the load balancing in a system without churn. The results of the experiments are shown in Figure 5.7. We can observe that the convergence ratios r1 of the scheme slightly drops in the case that the number of nodes in the system is exponentially increased. This decrease is not significant when the size of a system is doubled. However, when the size of the system increases by a factor of 8, for example, N is increased from 128 to 1024, r1 decreases by almost 40% (r1=0.021 for N=128, and 0.012 for 1024). The degree of the reduction is around 1.75, which is much smaller than that calculated for the CB algorithm. After the first round, the convergence ratios of the 107
diffusive scheme increase gradually in these systems. We can further observe that the proportions of loads transferred between nodes are almost the same for the different systems. The results indicate that the scheme does not lead to a higher proportion of loads for transfers when the number of nodes is increased.
0.8
100
N=128 N=256 N=512 N=1024
proportion of loads transferred (%)
convergence ratio
1
0.6 0.4 0.2 0
N=128 N=256 N=512 N=1024
80 60 40 20 0
1
2
3 round
4
5
1
2
(a)
3 round
4
5
(b)
Figure 5.7 Scalability of the diffusive load balancing in systems without churn: (a) convergence ratios (b) proportion of loads transferred between nodes
We further discuss the effectiveness of the diffusive scheme in a system with churn. The following experiments use a system with sizes N=128 and 1024 respectively. Figure 5.8 shows the normalized available capacities and the proportions of loads transferred for the two cases. We can observe that the differences between the measures for the cases are not significant. Therefore, the effectiveness of the diffusive scheme is not degraded by
1
proportion of loads transferred (%)
standard deviation of normalized available capacities
the increase of system size, and the diffusive scheme is scalable. churn=0.1, N=128 churn=0.1, N=1024 churn=0.9, N=128 churn=0.9, N=1024
0.8 0.6 0.4 0.2 0
100
churn=0.1, N=128 churn=0.1, N=1024 churn=0.9, N=128 churn=0.9, N=1024
80 60 40 20 0
0
5
10 round
(a)
15
20
0
5
10 round
15
20
(b)
Figure 5.8 Scalability of the diffusive load balancing in systems with a churn rate of 0.1 or 0.9, (a) standard deviation of normalized available capacities, (b) proportion of loads transferred
108
5.5. Comparison with other schemes for peer-to-peer systems We compare the diffusive scheme with three other schemes proposed for P2P systems in Table 5.1. The other schemes are: distributed directory, k-ary tree, and random probing. First, the schemes are different in their decision components that take the role of deciding load transfers in the load balancing operations. In the distributed directory scheme, the number of directories is pre-configured. The effectiveness of the scheme depends on the number of directories and the interval between the two consecutive runs of a directory. For example, for a system with a large size, the scheme with a small number of directories is similar to a scheme with a central directory. For a system with a small size, the scheme with a large number of directories is similar to a distributed scheme using random probing. Different from the distributed directory scheme, both the random probing scheme and the diffusive scheme let every node in a system make these decisions. Therefore, the two schemes are more scalable compared with the distributed directory scheme with a fixed number of directories. The k-ary tree scheme uses the inner tree-nodes to make decisions for load transfers. Therefore, the number of decision components is a fraction of the number of nodes in a system, and the scheme is scalable. Second, in terms of the Information policy, among the four schemes, only the k-ary tree scheme uses the tree structure to aggregate the global load status information and disseminates this information to all computing nodes. As we reviewed in Section 3.2.3.3,
109
the global information of a system easily becomes stale in the case that the system has a dynamic workload. Moreover, churn in a P2P system induces a fluctuation of the treestructure in addition to the variation of workload. This further degrades the accuracy of the global load status information. Furthermore, Shen et al. [Shen2007] showed that the k-ary tree spends more messages on implementing its Information policy. The other three schemes all use the load status information collected from a subset of nodes. Compared to the k-ary tree, the other schemes spend fewer messages on their Information policy. Also, without using the global information, they are more effective in dealing with the dynamics of the P2P system. Third, only the random probing scheme uses a senderinitiated Transfer policy for a load transfer. The other schemes use a directory-initiated policy where a decision component selects a sender and a receiver for a load transfer. Our previous experiments showed that the directory-initiated policy is superior to the sendinitiated policy. Table 5.1 Typical load balancing schemes in P2P systems Structure
Decision component
Information policy
Transfer policy
Location policy
Distributed Directory (d-directory) [Suranna2006]
Directory
a directory collects load status of its nodes
directory-initiated
Nodes registered in each directory
K-ary tree [Zhu1998] inner nodes of the tree
tree-root aggregates load directory-initiated statuses of nodes by the tree structure, and the average load status of the system is disseminated to leaves
Nodes in the sub-trees of a decision component
Random probing [Bharambe2004]
each node
a node collects the load statuses of randomly probed nodes
sender-initiated
Nodes been probed
Diffusive scheme
each node
a node collects the load statuses of nodes in a neighborhood
directory-initiated
Nodes in the neighborhood
110
To further distinguish the random probing scheme proposed in literature and the diffusive scheme, we implemented a random probing scheme and investigated its convergence speed using simulation experiments. Similar to the experiment in Section 5.2, the operating node of an operation randomly picks log 2 N nodes in the system as neighborhood for an operation. The random probing scheme uses a sender-initiated policy. In the case that the running node turns out to be a sender (its available capacity is larger than the average available capacity of the nodes in the neighborhood), the running node locates the node with the smallest available capacity as a receiver. We compare two decision algorithms that are popular in random probing schemes. One algorithm lets the sender equalizes its available capacity with one receiver, and we call it the equalizaiton algorithm. Another algorithm lets the sender and the receiver have their available capacities equal to the neighorhood average, and we call it the neighborhood average algorithm. The other parameters of the simulated system are configured as the same as for the experiments in Section 5.2. Figure 5.9 shows that two decision algorithms are different in their convergence ratios. The equalization algorithm converges faster than the neighborhood average algorithm. However, the equalization algortihm induces 15% more load transfer than the neighborhood average algorithm (the equalization algorithm moves 45% and the other moves 30% of the total workload). Compared with the data shown in Figure 5.2, the convergence speed of the equalization algorithm is close to that of the SI algorithm using random neighborhood, which is slower than the DI algorithm. The experiment further indicates that random probing schemes with a sender-initated policy converge much slower than the diffusive scheme with a directory-initiated policy.
111
1
neighborhood average equalization
convergence ratio
0.8 0.6 0.4 0.2 0 1
2
3
4
5
round of load balancing
Figure 5.9 The convergence ratios of the random probing scheme
5.6. Dealing with large sized services In our previous studies, we assumed that services are of fine granular sizes. For a load transfer, services with any size can migrate from a node to another. Therefore, all nodes are able to reach the same available capacity in a globally balanced state. However, in reality, some systems have large-sized services, and it is difficult to equalize the available capacities of the nodes, and the load imbalance (i.e., the maximum difference between the available capacities of nodes) can not be completely resolved. We propose two different decision algorithms in this subsection. They are for a diffusive load balancing scheme to decide load transfers between nodes in a P2P system. These two algorithms are variations of an algorithm proposed in [Cortés2002], where the tasks with equal amounts of resource requirements are considered. Our algorithms implement a directory-initiated policy; they consider the amount of resource requirements of services instead of the number of services on the nodes. They are intended for systems with homogeneous services (i.e., all services have the same resource requirements) and for systems with heterogeneous services (i.e., services have different resource
112
requirements), respectively. We investigate the standard deviation of available capacities and the impact of the sizes of services on this standard deviation for a system. We use the same notations as in Chapter 4 to describe the algorithms. As earlier, we assume that the overlay network would update the destination of a shared object or a virtual server during a load transfer. For example, a virtual server has its IP address changed when it is moved; thereafter, the virtual servers pointing to it update the IP address stored in their routing tables [Surana2006].
5.6.1. Homogeneous services The DIHomoService algorithm decides load transfers between possibly several pairs of overloaded and under-loaded nodes within the neighborhood of a load balancing operation. The algorithm calculates the average available capacity of nodes in the
∑ avc neighborhood using the formula avc Ai =
j∈Ai
Ai
j
. Based on the average available node
capacity avc Ai , it classifies a node j in the neighborhood as either overloaded (if its available capacity is smaller than avc Ai ), under-loaded (if its available capacity is larger than avc Ai ), or average loaded. The algorithm stores the information of the overloaded nodes in vector SVect and of the under-loaded nodes in vector RVect. Then the algorithm decides load transfers using the decision procedure shown in Figure 5.10. A service has its resource requirement equal to l . The Decision procedure is shown in Figure 5.10(a). For a pair of nodes that have the largest difference between their available capacities among all of the nodes in the two
113
vectors (line 3 and 4), the procedure resolves the load difference by calling the Selection function shown in Fig. 5.10(b) (line 5). The Selection function returns the number of services to be transferred. In the case that no service can be transferred, the procedure stops since it will not be able to schedule load transfer in this operation at all. In the other case the procedure decides the load transfer. Then the procedure goes back to line 2 to find the next node pair. The Selection function is shown in Figure 5.10(b). First, it calculates the required available capacity for the sender and the provided available capacity for the receiver according to the differences between their available capacity and avc Ai (line 1 and 2). The minimum of the provided and the required available capacities is the load difference that the algorithm should resolve (line 3). Then, in the case that the minimum is larger than the resource requirement of a single service, the function returns the integer part of the ratio of the minimum to the resource requirement of a service (line 5). Otherwise, it returns 1 in the case that the available capacity of the sender could be still less than that of the receiver right after the load transfer. In this way, the algorithm keeps the available capacities of nodes closest to the average.
114
Decision procedure: 1 Do forever 2 if SVect and RVect are not empty // select a load receiver 3 select y such that
avc y = max {avc j } j∈RVect
4
// select a load sender select x such that
avcx = min {avc j } j∈SVect
5 w= Selection(x, y); 6 if w > 0 7 decide the transfer with the load of w 8 remove x from SVect 9 remove y from RVect 10 else break; 11 else break;
(a) Selection(s,r) 1 avc required = avc Ai − avc s 2
avc provided = avcr − avc Ai
{
3 avcmoved = min avcrequired , avc provided 4 5 6 7 8 9
}
if avc moved > l
avcmoved l else if avc s + l ≤ avcr − l return
return 1 else return 0
(b) Figure 5.10 The DIHomoService algorithm: (a) the Decision procedure, (b) the Selection function
We can see that, when following the above procedure, the diffusive load balancing eventually stops. In the following part, we assume that the system has a static workload. This means that no new service joins or leaves the system, and the request rates of existing services do not change. We also assume now that the P2P system has no churn. Cedo et al. [Cedo2007] presents assumptions for a general model of a partially
115
asynchronous load balancing scheme. These assumptions assure that the diffusive load balancing converges or stops in a system with homogeneous services. We show that our scheme with the DIHomoService algorithm has additional properties compared with the general model. First, the proposed scheme serializes the running of its operations in neighborhoods with common nodes. Compared with the assumption of partial asynchronous message passing for the general model, the local serialization guarantees that the load status of a neighborhood is always fresh and correct during an operation. Second, the general model assumes sender-initiated load transfers. Since the scheme uses the DIHomoService that decides load transfers for multiple pairs of senders and receivers, the scheme has a stronger load balancing power by invoking multiple sender-initiated load transfers in one operation. Third, the DIHomoService also guarantees that avc′s is less than avcr′ for a pair of sender and receiver. Hence, like the general model, our scheme using the DIHomoService will eventually stop load transfers (in a system with a static workload), and the system enters a globally stable state thereafter. We further claim that after the system enters a globally stable state, the local load imbalance of the system (i.e., the maximum difference between the available capacities of nodes in a neighborhood) is 2l. In the case that the decision algorithm of an operation decide no load transfer to be done between two nodes, for example, between the sender s1of SVect and the receiver r1 of RVect, either avc Ai − avc s1 < l or avcr1 − avcAi < l holds. Then, the inequality avcr1 − avcs1 < 2l exists. In the case that there are p nodes in RVect, and avc rp ≤ avc r ( p −1) ≤ K ≤ avc r 2 ≤ avc r1 , no receiver could be located as a receiver for s1. In the case that there are q nodes in SVect, and avc s1 ≤ avc s 2 ≤ K ≤ avc s ( q−1) ≤ avc sq ,
116
no sender could be found for r1. Hence, in the globally stable state, the local load imbalance (i.e. the difference between the available node capacities between s1 and r1) is at most 2l. Because of the local load imbalance, a global load imbalance (i.e. the maximum difference between the available capacities of the nodes in a system) can reach the value 2ld where d is the diameter (i.e. maximum of the minimum hop distance between any two nodes) of the overlay network. We use an example to derive the global load imbalance. We consider that a node s1 in neighborhood A1 transfers its services to rd in the neighborhood Ad in d hops at most. We construct a path connecting the nodes according A1
A2
Ad −1
Ad
to the load transfers in the form of s1 → r1 / s2 →L → rd −1 / sd → rd where ri / si +1 represents a node that works as a receiver in Ai and as a sender in Ai +1 . Since the local load imbalance is bound by 2l, the global load imbalance between s1 and rd is bound by 2ld.
5.6.2. Heterogeneous services The DIHeteroService algorithm deals with heterogeneous services. Similar to the DIHomoService algorithm, the Decision procedure of the DIHeteroService starts from selecting a pair of nodes for a load transfer. The DIHeteroService algorithm calls a different Selection function. The function returns a vector containing the services selected for a load transfer (Figure 5.11(a)). The services with the minimal resource requirements are selected (line 4 in Figure 5.11(a)) in a way that the total resource requirement of the selected services will not lead to the sender’s available capacity larger than the receiver’s available capacity thereafter. After calling the Selection function, the procedure removes
117
the sender and receiver from the SVect and RVect and continues the decision phase until no pair can further be identified. Selection (s,r):
{ }; P = {service ∈ s};
1 W=
2 3 Do 4 lmin = min {lservice} service∈P
5 6 7
if avc s + lmin ≤ avc r − lmin then add v to W if lv = lmin
avc s = avc s + l min
8 9 10 11 12 13
avc r = avcr − l min remove v from P continue else return W
(a) Segment of Decision procedure: 10 else 11 remove x from SVect 12 if SVect is not empty 13 go to line 4 14 else break;
(b) Figure 5.11 The DIHeteroService algorithm: (a) the Selection function, (b) the segment replacing lines 10 and 11 of the Decision procedure in Figure 5.10(a).
Using the arguments we used for the DIHomoService algorithm, we can show that the load balancing with the DIHeteroService algorithm will stop in a system with a static workload. However, when the system reaches a globally stable state, the local load imbalance might not be the smallest. For example, for an operation, even when there is no service of s1 that could be selected for a load transfer between the pair s1 and r1 , it is possible that there are still some services in the other senders that could be transferred to r1 . In order to improve the DIHeteroService, we replace lines 10 and 11 of the
118
Decision procedure in Figure 5.10(a) by the segment shown in Figure 5.11(b). The Decision procedure of the operation stops when there is no sender in SVect or no receiver in RVect. Like the DIHomoService algorithm, the DIHeteroService algorithm reduces the differences between the available capacities of the nodes in each operation. Also, when the distribution of the loads in the system is unknown, in a globally stable state, the local imbalance is bounded by 2lmax where lmax is the maximum resource requirement of the services, and the global load imbalance is bounded by 2lmax d .
5.6.3. The impact of the service sizes In this subsection, the effectiveness of the scheme is investigated in terms of the convergence ratios (defined in Section 4.3.2.2), and the number of load transfers that occur for load balancing. We assume that each load transfer requires the same amount of resources, such as CPU or bandwith, even though they may include multiple services. Accordingly, a larger number of load transfers indicates a higher cost of load balancing. We also investigate the standard deviation of available capacities when the system is in the presence of churn. This is the degree of load balancing that can be obtained; as we will see, it depends on the degree of churn (as can be expected). The impact of the resource requirements of services (i.e. the sizes of services) for load balancing is also further examined. The following experiments use the configuration described in Section 4.3.2.2. The difference is that a system installs large-sized services or small-sized services. These services are randomly distributed over the nodes at the beginning of an experiment. For
119
example, for a system with large-sized homogeneous services, l is set as 2.5 requests/second for a service, which is of the same order as the node capacity. A node can host 4 services at most. For a system with small-sized homogeneous services, l is set to 0.25 requests/second, which is one tenth of that of a large service. A node can host 40 such services at most. For the systems hosting heterogeneous services, services have their resource requirements uniformly distributed between 0 and a preconfigured maximum, e.g., 2.5 requests/second for a system with large-sized services, and 0.25 requests/second for a system with small-sized services. Therefore, the sum of the resource requirements of these services is equal to half of the total capacity of the system, and the average available capacity of nodes is 5 requests/second (and the average utilization of the system is 50%). Table 5.2 shows the results collected from 20 runs of experiements. The mean value and the 90% confidence interval (CI) for the mean of each item are given. For a system, the convergence ratio of the first round γ 1 is smaller than that of the second round. This indicates that, when load balancing first starts, the balancing operations largely reduce the differences of available node capacities. Along with the progress of load balancing, the reduction become smaller. Furthermore, γ 1 for a system hosting small services is smaller than for a system hosting large services. This indicates that small services facilitate the load balancing. Since the load balancing operations could select the small services in the heterogeneous systems for further resolving load unbalances, the available capacities of the nodes in these systems can have a smaller standard deviation in subsequent rounds. However, moving services for load balancing in these heterogeneous systems introduces more load transfers. The number of load transfers in a heterogeneous system is about
120
three times larger than in a homogeneous system hosting only the maximum-sized services. From the Table 5.2, we also see that the global load imbalance of a system in the stable state is much smaller than the bound calculated in Section 5.6.1. The predicated global load imbalance is bound to 2ld , but the experiments show a value around l or 2l .
Table 5.2 Results for the DIHomoService and DIHeteroService decision algorithms with skip-list overlay neighborhood
Number of load transfers γ1 γ2
Standard deviation of available capacities Maximum difference of available capacity
Mean 90% CI Mean 90% CI Mean 90% CI Mean 90% CI Mean 90% CI
Homogeneous system Small Large services services 1825.9 617.65 25.44 5.86 0.034 0.141 0.002 0.009 0.88 0.99 0.039 0.005 0.09 0.49 0.01 0.032 0.36 4.5 0.047 0.377
Heterogeneous system Small Large services services 5414.6 1608.05 64.46 17.17 0.013 0.124 0.001 0.002 0.324 0.99 0.016 0.001 0.012 0.355 0.001 0.006 0.139 2.64 0.014 0.116
In the following experiments, we study the effect of the load balancing in the presence of churn. These experiments use the churn model described in Section 5.3.1. Without load balancing, the standard deviation of the available node capacities always increases, and the degree of the increase depends on a churn rate. For example, in the case that the system has a churn rate of 0.1, after the system has run for 50 rounds, the standard deviation of the available node capacities is increased by a factor of three. In the case that the churn rate is 0.9, the standard deviation is increased by a factor of seven after 50 rounds.
121
homo, small homo, large hetero, small hetero, large
3
number of load transfers
standard deviation of available capacities
4 3.5
2.5 2 1.5
4000
homo, small homo, large hetero, small hetero, large
3500 3000 2500 2000 1500
1
1000
0.5
500
0
0 0
5
10
15
20
25
30
35
40
45
50
0
5
10
15
20
round
5000 number of load transfers
standard deviation of available capacities
3
35
40
45
50
(b) homo, small homo, large hetero, small hetero, large
3.5
30
round
(a) 4
25
2.5 2 1.5 1
homo, small homo, large hetero, small hetero, large
4000 3000 2000 1000
0.5 0
0 0
5
10
15
20
(c)
25 30 round
35
40
45
50
0
5
10
15
20
25 30 round
35
40
45
50
(d)
Figure 5.12 Load balancing in a system with churn: (a) the standard deviation of available capacities when churn rate is 0.1; (b) the number of load transfers when churn rate is 0.1; (c) the standard deviation of available capacities of nodes when churn rate is 0.9; (d) the number of load transfers when churn rate is 0.9. (Note: “homo” is for homogeneous services, “hetero” is for heterogeneous services, “small” is for services with small resource usage, and “large” is for services with large resource usage)
In a system using the diffusive scheme, the standard deviation of the available capacities of nodes depends on the churn. When the system has negligible churn, for example, one node joins or leaves in every 2 rounds, load balancing can quickly resolve the load unbalance, and its effectiveness is close to that shown in the previous experiments. Therefore, in the following experiments, two different churn rates are considered: a low rate of 0.1 and a high rate of 0.9. These experiments use the four systems described above. Figure 5.12 shows the standard deviation of the available capacities of nodes and the number of load transfers in each round of the first 50 rounds.
122
For a system, the standard deviation slightly varies around a certain value as the system evolves, and we say that the system enters a steady state. When the churn rate is 0.1, the bounds of the standard deviations for the steady states of the four systems are around 0.75 with no significant difference (Figure 5.12(a)). However, the numbers of load transfers are largely different (Figure 5.12(b)). The systems hosting large services are favored by the load balancing operations with fewer load transfers. For example, the homogeneous system hosting large services has the fewest load transfers, and the heterogeneous system hosting small services has the largest number. Figure 5.12(c) shows the standard deviations of available capacities for the cases where the churn rate is 0.9. Compared with Figure 5.12(a), for a system, the bound of the standard deviation of available capacities is increased. A heterogeneous system hosting small services has a distinct bound around 2.2, and other systems have a bound of around 1.6. These bounds are close to those in systems with fine-grained objects. This observation indicates that the sizes of services has not much impact on the bound of the standard deviation of available capacities when a system has churn. Figure 5.12(d) shows that a homogeneous system hosting large services has the fewest load transfers, and this further confirms our intuition based on Figure 5.12(b).
5.7. Summary In this chapter, we investigated the effectiveness of load balancing for P2P systems. Load balancing with random walks (or random probing) was proposed for P2P load balancing to deal with the change of file popularity and churn. According to our study, using random-walk neighborhoods, the SI and RI algorithms perform better; however,
123
their effectiveness is still worse than that of the DI algorithm. The performance of the DI algorithm does not depend on the kind of neighborhood, random-walk or skip-list. However, the scheme using random walks needs to probe O(logN) nodes for each balancing operation, which represents a large message overhead, unless a static random neighborhood is used. Load balancing in P2P systems has to consider churn. The DI algorithm is able to control the average of the standard deviations of available capacities of the nodes within a bound when the system experiences churn. The resulting bound is proportional to the churn rate. We are able to understand the effectiveness of the diffusive load balancing scheme under adverse factors, such as churn and heterogeneous node capacities. Since the services in a real P2P system are not fine-grained, we modified the directory-initiated algorithm of the scheme so that the scheme could work for a P2P system with large-sized services. The load balancing operations use the DIHomoService algorithm (i.e. directory-initiated algorithm for systems hosting homogeneous services), or the DIHeteroService algorithm (i.e. directory-initiated algorithm for systems hosting heterogeneous services). The results of the simulation experiments show that, when the churn is negligible, the small services hosted by a heterogeneous system facilitate load balancing. Hence, the node performance of a heterogeneous system has a smaller variance than that of a homogeneous system with the same maximum-sized services. The results also show that, when the systems has noticeable churn, the variances of the node performance of the systems are not significantly different. However, higher churn rates result in larger differences of node performance. The numbers of load transfers are also
124
increased. A system hosting larger services with homogeneous capacities always introduces the fewer load transfers.
125
6. Diffusive load balancing for clustered peer-to-peer systems We further designed a diffusive scheme for balancing the loads of the nodes in a clustered P2P system so that the services of the clustered system could have similar mean response times. We propose decision algorithms for the load balancing operations to transfer data (or services) or nodes between clusters. We show that the scheme is able to converge in a clustered system. We also discuss the difference between balancing the available capacities of nodes and balancing the available node capacities of clusters. We assume that, in a clustered system, the clusters have different sizes, and the nodes have different capacities.
6.1. Structure of a clustered peer-to-peer system In a clustered P2P system, nodes are organized into clusters. Then, these clusters are organized into a structure, for example, a tree, hypercube, or just a big flat interconnected structure. Clustering helps a P2P system to perform better. We briefly discuss several clustered P2P systems here. In clustered P2P systems, nodes are grouped into clusters based on different criteria. Some systems, like Hierarchical Gnutella, group nodes at random. The nodes within a
126
cluster do not have any common property. In opposition, some systems group nodes based on their locations (for example, CBT [Yu2008] and eQuus [Locher2006]), or based on the similarities of their documents (e.g. the approach proposed by Yang et al. [Yang2007]). The HCPS system [Liang2007] groups nodes according to their resource capacities. We assume that within each cluster, all resource capacities of the nodes are shared effectively by some intra-cluster scheduling algorithm. The clusters in a clustered P2P system are usually interconnected into some kind of structure. For example, the systems proposed in [Krishnamurthy2001], [Stutzbach2005], and [Liang2006], let the super nodes of the clusters construct a network with a randomgraph topology. The HCPS proposed in [Liang2007] has a hierarchical tree structure. The nodes of the tree are clusters. The head (i.e. super node) of a child cluster participates in its parent cluster. In some systems, a cluster does not have a super-node or head. Some nodes in different clusters are connected directly. For example, in the system proposed in [Yang], a node has links (called long-distance links) that points to the nodes in some other clusters. In systems, such as eQuus [Locher2006] and Cycoid [Shen2006], clusters construct a structured P2P overlay network, where the nodes in a cluster connect to the nodes (regular nodes or super nodes) in neighbor clusters. The number of clusters within a system change by cluster splits or mergers. The sizes or members of a cluster change when nodes join or leave. There are two ways for a clustered P2P system to manage its clusters: centralized or distributed. In a centralized way, a system has a central server. For example, the system described in [Krishnamurthy2001] has a server that stores the network locations of the clusters in the system. A new node could find the cluster whose nodes share the same BGP (i.e. Border
127
Gateway Protocol) router with it. The server in a HCPS system stores the information of the number of nodes and the total upload bandwidth regarding each cluster. This information is used when the server decides a cluster for a new node. The new node with a large (small) upload bandwidth joins a cluster whose average upload bandwidth is the minimum (maximum). Also, this central server splits a cluster into two clusters (or merges a cluster with another) in the case that the sizes or average upload bandwidth of the cluster is larger (or smaller) than the global average by a given factor. Differently, in a distributed way, a new node independently chooses a cluster to join, and clusters decide split or merger by themselves. Normally, a new node invokes a join service which forwards a “join” message in an overlay network. The forwarding procedure stops until it locates the cluster that shares the common property with the new node. For example, in the system proposed in [Yang2007], the join procedure locates the clusters whose nodes share the same categories with the new node. These categories are generated according to the documents stored on nodes. In eQuus, the procedure locates the cluster which is closest to the new node by geographic distance. In eQuus, a cluster performs a split (or a merger) in the case that its size is larger (or smaller) than a parameter D by a factor of 2. The parameter is called cluster size parameter. Using either way (centralized or distributed), a clustered P2P system has to update the connections in its overlay network when clusters split or merge. Using clustering, the system may improve certain properties, such as the performance of services, resilience to churn, or robustness to node (or link) failures. For example, a Hierarchical Gnutella is more resilient and robust than a regular Gnutella. Using the network-aware clustering technique proposed in [Krishnamurthy2001], the system can
128
locate files for a file-sharing query in fewer steps, and the chance for a search to succeed is also increased. The results in [Liang2007] showed that, by using the clustering structure of HCPS, the nodes can receive video chunks at a rate close to the theoretical maximum. Load balancing is proposed to improve the performance of nodes in clustered P2P systems. These schemes normally use two-level load balancing: intra-cluster load balancing for the nodes inside a cluster, and inter-cluster load balancing for the nodes in different clusters (e.g. [Shen2007] and [Garofalakis2009] ). A primary node (or supernode) of a cluster conducts intra-cluster load balancing which transfers loads between nodes inside a cluster. For example, the intra-load balancing in [Shen2007] uses a load sharing scheme to transfer the loads from the overloaded nodes to the under-loaded nodes. They define an overloaded (under-loaded) node to be one that has a load larger (smaller) than its capacity. The capacity of a node is the maximum load that the node could have in order to serve its service requests within deadlines. In the case that the cluster still has unresolved overloaded nodes, the primary node perform an inter-cluster load balancing operation that implements the sender-initiated Transfer and random probing Information policies. The loads on the overloaded nodes in the sender cluster are transferred to the under-loaded nodes in a receiver cluster. The receiver cluster has the larger total free capacity (i.e. available capacity in this thesis) between two probed clusters. For a node, the free capacity is the difference between its capacity and used capacity; for a cluster, the total free capacity is the total of the free capacities of its underloaded nodes. The scheme in [Garofalakis2009] lets the super-node of a cluster to evenly dispatch the file downloading requests to the normal nodes according to the loads of these
129
nodes. The inter-cluster load balancing takes charge of the sizes of clusters by moving peers (or nodes) between clusters or by performing cluster splits or mergers. We propose a diffusive scheme that takes charge of the inter-cluster load balancing for clustered P2P systems. The scheme balances the loads of the nodes in the system by moving services (called load migration or transfer) or by moving nodes (called node migration). These two kinds of movements are used for different kinds of system. The scheme could move services for a system that groups nodes based on the location of nodes, or move nodes for a system that uses replicas to improve the performance of applications. Using the diffusive scheme, the available capacities of the nodes in a clustered system converge to the average of the system. The scheme proposed in [Shen2007] only deals with the overloaded nodes (i.e. the nodes have their available capacity less than 0) for a system.
6.2. Diffusive load balancing for clustered peer-to-peer system Here, we adapt the diffusive load balancing proposed in the previous chapters to clustered P2P systems. In a clustered P2P system, some node in each cluster performs the diffusive load balancing operations. These operations equalize the available capacities of all nodes in the system. The principle of our design is that the nodes are expected to have similar service mean response times. We model the performance of a clustered system as a system that contains groups of M/M/1 queues. One queue corresponds to one node; therefore a
130
cluster corresponds to a group of such queue. We have shown in Chapter 4 that the mean response time of a node is the inverse of its available capacity when an M/M/1 queue performance model is used. This implies that, if the nodes in the clustered system all have the same available capacity, they will provide the same mean response time. Therefore, in our approach, a clustered P2P system may use a scheme like the one in Chapter 4 and 5 for balancing the available capacities of nodes inside each cluster (i.e. intra-cluster load balancing), and the diffusive scheme described in this chapter for equalizing the available capacities of nodes in different clusters (i.e. inter-cluster load balancing). The diffusive scheme for non-clustered P2P systems described in Chapter 4 and 5 can not be used for inter-cluster load balancing without any adaptation. The diffusive scheme for a non-clustered system would take the available capacity of a cluster as load measure in the clustered system. The available capacity of a cluster is the sum of the available capacities of the nodes in the cluster. Because the clusters run intra-cluster load balancing operations, the available capacities of the nodes within a given cluster are the same. In the case that two clusters are not of the same size, the available capacities of their nodes will not be the same when the available capacities of the two clusters are the same. Therefore, we modify the diffusive scheme, especially, the decision algorithms. The load balancing operations of the proposed diffusive scheme are conducted by the nodes of clusters. These operations invoke load transfers that move services between nodes, or node migrations that move nodes between clusters. One node in each cluster is selected (e.g. by the other nodes using an election algorithm) as a load balancing coordinator or simply coordinator of the cluster. A coordinator that is running a load balancing operation is called the operating coordinator of the operation. While not
131
running an operation, a coordinator monitors the load status of its own cluster. These coordinators asynchronously run their load balancing operations. An operating coordinator conducts the three stages of operations (described in Section 4.2.2), including the information, decision, and load migration stages. During the information stage, the coordinator chooses one node from each of its neighbor clusters and sends probing messages to them. The messages are forwarded to the coordinators of these clusters. A coordinator returns the load status of its cluster in the case that its cluster is not participating in another operation; otherwise, the coordinator returns a “reject” message to withdraw from the new operation. During the decision stage, the operating coordinator decides load migrations between the selected pairs of sender and receiver clusters in the neighborhood. Then, the decisions are sent to the coordinators of these selected clusters. During the load migration stage, the amount of loads to be exchanged (for the services) or number of nodes to be migrated are determined by the coordinators of the clusters involved. In the following sections, we will present two algorithms that are used in the decision stages. One applies load transfers and the other node migrations.
6.3. Algorithms deciding load transfers This section presents the decision algorithms that decide load transfers between clusters in a clustered P2P system with fine-grained services. We also investigate the convergence of the scheme in a clustered system without churn, and the standard deviation of remaining loads of the system in a system under churn.
132
We define the notations used in this section here. The cluster that has an operating coordinator running an operation is called an operating cluster and denoted as cluster i. The neighborhood of the operation is denoted as Ai , and Ai includes cluster i and the neighbor clusters of i. Cluster j is a cluster in Ai (i.e. j ∈ Ai ). The number of clusters in Ai is denoted as | Ai |. The number of nodes in a cluster, for example, cluster x, is denoted as |x|. We define the available node capacity of a cluster to be the average of the available capacities of the nodes in the cluster, and write avc x for cluster x. When loads are transferred between two clusters, the available node capacities of the clusters change. For example, after the loads with the resource requirements equal to l are transferred from cluster x to y, the available node capacities of the two clusters become avc ′x = avc x +
and avc ′y = avc y −
l x
l , respectively, where avc x and avc ′x are the available node y
capacities of cluster x at the beginning and at the end of an operation.
6.3.1. Decision algorithms In a clustered system, in order to make decisions, the decision algorithm of an operation has to know the load status of each cluster in the neighborhood. The load status of a cluster, including the number of its nodes and its available node capacity, is collected during the information stage of the operation by the operating coordinator. The decision algorithm calculates the average available node capacity of the neighborhood, selects the pairs of sender- and receiver-clusters, and decides the services that should migrate between the pairs.
133
Since our previous study shows that the classic Proportional algorithm is inferior to the other decision algorithms in terms of convergence speed and cost of load balancing (see Section 4.3.2.2), the Proportional algorithm is not further studied. However, we can adapt the other algorithms. The CBClustService algorithm is a version of the Complete Balancing algorithm (i.e. the CB algorithm described in Section 4.2.3.2). The algorithm equalizes the available node capacities of the clusters in a neighborhood. For example, the operating coordinator of cluster i is executing an operation. During the decision phase, the operation calculates the average available node capacity avc Ai of the neighborhood Ai using the following equation:
∑ avc Ai =
j avc j
j∈ Ai
∑
j
(Equation 6.1).
j∈ Ai
At the end of the operation, the equation avc i′ = av c ′j = av c ′Ai = avc Ai holds. We design the DIClustService algorithm which is a version of the Directory-Initiated algorithm (i.e. the DI algorithm described in Section 4.2.3.3) for a clustered P2P system. In a clustered system, the algorithm first identifies a cluster, for example j, as overloaded if avc j < avc Ai , or under-loaded if avc j > avc Ai . The algorithm stores the information of the overloaded clusters in the vector SVect, and the under-loaded clusters in the vector RVect. Then, the DIClustService algorithm performs the Decision procedure shown in Figure 6.1. First, in the case that the SVect and RVect are not empty, the procedure selects a pair of sender and receiver according to their avcacceptable or avcprovidable from the two vectors. The avcacceptable (avcprovidable) is the available capacity a sender (receiver) cluster should
134
receive (provide) so that its nodes could have their available capacities equal to the average. In order to maximally reduce the differences between the available node capacities of the clusters, the procedure selects the cluster with the largest avcacceptable as the sender and the cluster with the largest avcprovidable as the receiver from the vectors (line 3 and line 4). The total resource requirement of the services that migrate between s and r is equal to the minimum of avcacceptable and avcprovidable (line 5). Therefore, after the service migration, the inequality avcs′ ≤ avc Ai ≤ avc′r holds. Decision Procedure 1 2 3
Do forever if SVect and RVect are not empty
s = max {(avc Ai − avc j ) j } j∈SVect
4
r = max {(avc j − avcAi ) j }
5
avcacceptable = ( avc Ai − avcs ) s
6 7
avc providable = ( avcr − avc At ) r
8 9 10
j∈RVect
decides a service migration with the amount of min{ avc acceptable , avc providable } from s to r remove s from SVect and r from RVect else break
Figure 6.1 The decision procedure of the DIClustService algorithm
The sender-initiated algorithm (i.e. SIClustService) and the receiver-initiated algorithm (i.e. RIClustService) for a clustered system can be similarly obtained from the corresponding algorithms for non-clustered systems. Similar to the DIClustService algorithm, these algorithms consider the avcacceptable or avcprovidable of the clusters while making decisions. We do not describe these two algorithms any further here.
135
6.3.2. Effectiveness of the decision algorithms In this subsection, we first present a clustered system whose clusters construct a network with a skip-list structure. Then, we derive the convergence ratio of the decision algorithms for a clustered system. At the end, we investigate the impact of the sizes of clusters on the effectiveness of the schemes in the clustered P2P system with a skip-list overlay network.
6.3.2.1. A clustered peer-to-peer system with a skip-list overlay network We demonstrate the structure of a clustered system using Figure 6.2. The clusters of the system construct a network with a skip-list structure. In the figure, the clusters are represented by the dots. The nodes within a cluster (a dot) connect to each other by using connections called intra-cluster connections. The nodes in a cluster connect to the nodes in other clusters by using connections called inter-cluster connections. In this example, the clusters build the skip-list structure by using the inter-cluster connections between their nodes. Nodes use the connections in the skip-list structure to resolve the P2P lookup messages. Figure 6.2(a) shows the “fingers” (i.e. the inter-cluster connections) of cluster0; those fingers point to the neighbor clusters: cluster1, cluster2, cluster4, cluster8, cluster16. Figure 6.2(b) shows the routing table of a node inside cluster0. An entry of the routing
136
table contains pointers to up to k nodes of a specific cluster. The node chooses one of these nodes for forwarding a lookup message to the cluster. cluster0
cluster16
cluster1 cluster2
cluster4
cluster8
a cluster of nodes
(a)
(b) Figure 6.2 An example of a clustered peer-to-peer system: (a) the skip-list overlay network constructed by inter-cluster connections, (b) the routing table of a node in cluster0
The members of clusters are changed when nodes join or leave these clusters. A node joins a cluster at random, and any of clusters can have a node leaving. The size (i.e. the
D number of nodes) of a cluster is controlled to remain in the range ,2 D ; we call D the 2 cluster size parameter of the clustered system. A cluster splits into two clusters in the case that its size is above or equal to 2D, and mergers with its predecessor in the case that its
137
size is below or equal to
D . When a cluster split or merger occurs between two clusters, 2
the intra-cluster connections of the nodes in both clusters are updated, and the intercluster connections pointing to or from the new cluster or the merged cluster are updated like non-clustered systems when nodes join or leave.
6.3.2.2. Convergence speed The diffusive scheme converges in a clustered P2P system since the variance of the available capacities of the nodes in the system is monotonically non-increasing. While equalizing the available capacities of the nodes, the decision algorithm also equalizes the available node capacities of the clusters in the system. We assume that the system has a certain number of clusters (denoted as c), and a cluster (e.g. cluster j) in the system has a certain number of nodes (denoted as
avc Ai =
∑ avc ∑j
j∈ Ai
j
j ). At the beginning of an operation,
j . In the case that all the clusters have the same number of nodes (e.g.
j∈ Ai
m), the following equation holds for a neighborhood i, and the CBClustService algorithm can be regarded as a CB algorithm that works on clusters.
m ∑ avc j avc Ai =
j∈ Ai
m Ai
∑ avc =
j∈ Ai
j
(Equation 6.2)
Ai
Therefore, the variance of available node capacities of clusters can be derived according A −1 2 to Equation 4.3 in Chapter 4 as σ 2 (avc′) = 1 − i σ (avc) for a clustered system. c
138
Here, in a clustered system, σ 2 ( avc) and σ 2 ( avc′) are the variances of the available node capacities of the clusters at the beginning and end of the operation, respectively, and
Ai is the number of clusters in the neighborhood of the operation. Since, in each operation, σ 2 ( avc′) is smaller or equal to σ 2 ( avc) , the variance of the available node capacity of the clusters is monotonically non-increasing. Meanwhile, in a round, the standard deviation of loads of the clusters (i.e. the standard deviation of available node c
Ai −12 , which is approximately capacities of the clusters) is reduced by a factor of 1− c 1− Ai
equal to e
2
. This factor indicates that the available node capacities of the clusters in
the system converge to the average. Using the same reasoning as in Chapter 4, we can prove that the other schemes, such as DIClustService, SIClustService, and RIClustService, converge. Also, the DIClustService algorithm converges faster than the SIClustService or RIClustService algorithm. In the case that the sizes of the clusters are not exactly the same, Equation 6.2 does not hold any more. Moreover, although the variance of available node capacities of clusters is still monotonically non-increasing, the convergence speed of the scheme does not follow the above analysis. We use simulation experiments to determine the speed of convergence. The convergence speed of the scheme in a clustered system is evaluated based on the standard deviation of loads of clusters. The cost that the operations use for load balancing is measured as the proportion of loads that are transferred between the clusters. This cost is directly induced by the diffusive scheme for the inter-cluster load
139
balancing. In this section, the load balancing operations transfer fine-grained services. We collect these measurements by using the ways we used in Chapter 4 and 5. The simulated system in the experiments uses the structure like the one described in the Section 6.3.2.1. At the beginning of an experiment, the simulation program adds nodes to clusters randomly selected. The sizes of clusters are controlled by a parameter D. There are 10,000 nodes in the system, and the capacity of a node (i.e. the parameter NC) is equal to 10 requests/second. Initially, loads are randomly distributed to clusters; that is, a cluster installs the services with the total resource requirement uniformly distributed from 0 to its total capacity (i.e. the total of the capacities of its nodes). Therefore, the distribution of the available node capacities of the clusters follows a Uniform distribution with the range [0, 10] (i.e. with a mean of 5 requests/second and a standard deviation of 2.88) initially. Because of the intra-cluster load balancing, the nodes inside a cluster always have the same available capacity. The simulation software use the ways described in Section 5.3 to simulate the churn in the clustered system. When churn occurs, the simulated system changes the connections in its overlay network (described in Section 6.3.2.1). Moreover, the available node capacities of clusters are changed. For example, after node x with capacity C joins cluster j, the cluster becomes avc j ′ =
avc j j + C j +1
j′ , and its available node capacity becomes
. In the case that a node leaves cluster j, the available node capacity of
the cluster becomes avc j ′ =
avc j j − C j −1
. Furthermore, the members of clusters can be
changed by split or merger when churn occurs in the system. During a cluster-split, the nodes and the services of the original cluster are taken over evenly by the two new 140
clusters. During a cluster-merger, two clusters combine their nodes and services into the new cluster. In the case that the two clusters that are created by a cluster split, or combined by a cluster merger, have similar sizes and available node capacities, the available capacities of their nodes may not change much thereafter. Figure 6.3 shows the effectiveness of the scheme using the DIClustService algorithm in the clustered system from three perspectives: the standard deviation of available capacities and convergence ratio in the system without churn, and the standard deviation of available capacities in the system with churn. We note that the scheme displays some of the properties that we have observed in a non-clustered system. When the system does not have churn, the difference between the available node capacities for different clusters approaches zero in the progress of load balancing (i.e. the line for the standard deviation of the available capacities based on clusters in Figure 6.3(a)). Meanwhile, the scheme has the smallest convergence ratio based on clusters at the first round; then, the convergence ratio increases. After the second round, the convergence ratio does not change much (see Figure 6.3(b)). Furthermore, the standard deviation of available capacities based on clusters in the system with churn is bounded, and the size of the bound highly depends on the rate of churn (see Figure 6.3(c)). We will discuss the impact of the sizes of clusters in the following subsection. In Figure 6.3, for each perspective, two measures are collected: one is based on nodes, another is based on clusters. For example, (a) shows the standard deviations of available capacities based on nodes (i.e. the available capacities of the nodes) and based on clusters (i.e. the available node capacities of the clusters), respectively. We observed that, for a certain perspective, the difference between its two measures is not significantly
141
different. We conclude that, the reduction of the differences between the available node capacities of clusters is highly correlated to the reduction of the differences between the available capacities of nodes. This result indicates that the diffusive scheme is also a function that effectively equalizes the available node capacities of the clusters. Therefore, the diffusive scheme working in a clustered system is able to maintain its properties that are observed in non-clustered systems. We do not repeat for clustered systems the experiments about the effectiveness of the diffusive scheme described in Chapter 4 and 5 here. 0.4
based on nodes based on clusters
0.35
3
convergence ratio
standard deviation of available capacity
4 3.5
2.5 2 1.5 1 0.5
based on nodes based on clusters
0.3 0.25 0.2 0.15 0.1 0.05
0
0 1
2
3
4 round
5
1
2
3 round
(a)
5
(b) based on nodes, churn=0.1 based on clusters,churn=0.1 based on nodes,churn=0.9 based on clusters,churn=0.9
1.4
standard deviation of available capacity
4
1.2 1 0.8 0.6 0.4 0.2 0 0
5
10
15
20
round
(c) Figure 6.3 The effectiveness of the scheme on nodes or clusters in a clustered system with D=8, and C=512: (a) standard deviation of available capacity and (b) convergence ratio in the system without churn, (c) the standard deviation of available capacities of the system with churn rate=0.1 or 0.9
142
6.3.2.3. The impact of cluster sizes In this section we discuss how the effectiveness of load balancing depends on the number of clusters and the sizes of the clusters. First, we have varied the number of clusters (e.g. c=128, 256, 512, or 1024). The cluster size parameter was set to D=8. Figure 6.4(a) shows that convergence is slightly slower in systems that have fewer clusters (e.g. γ 1 is equal to 0.020 or 0.0168 in the case of c equal to 128 or 256). However, for the systems that have more than 512 clusters, the effectiveness of the scheme does not significantly change, where the convergence ratios of the scheme (shown in Figure 6.4(a)) and the proportions of loads moved (shown in Figure 6.4(b)) are not significantly different. This shows that the diffusive scheme for a clustered system is scalable. Furthermore, the data shown in Figure 6.4(a) and (b) is similar to those in Figure 5.7 which corresponds to non-clustered systems. This similarity indicates that the operations of the inter-cluster load balancing effectively reduce the differences between the available node capacities of clusters. The data in Figure 6.4(c) and (d) indicates that, for a system with churn, the standard deviation of available node capacities does not depend on the number of clusters. Then, we investigate the effect of the cluster size on the effectiveness of load balancing. Figure 6.5 shows the data collected from the experiments using systems with different cluster size parameters D (e.g. D=4, 8, 16, and 32). The number of nodes in the 5D D clusters is in the range ,2 D , and the average number of nodes is . The numbers 4 2 of clusters c of these systems are equal to 512. We observed that, in the absence of churn, the convergence speeds of the scheme in these systems are very similar. This indicates 143
that the convergence speed does not depend on the cluster-size parameter of the system. Compared to the results shown in Figure 4.5(b) and (c) (those for a non-clustered system), the results in Figure 6.5(a) and (b) confirm the implication that the convergence speed of the diffusive scheme does not depend on whether the nodes are clustered or not (e.g. in a clustered system or a non-clustered system).
0.4
0.3
proportion of services moved (%)
0.35
convergence ratio
50
c=128 c=256 c=512 c=1024
0.25 0.2 0.15 0.1 0.05 0
c=128 c=256 c=512 c=1024
40 30 20 10 0
1
2
3 round
4
5
1
2
c=128,churn=0.1 c=1024,churn=0.1 c=128,churn=0.9 c=1024,churn=0.9
standard deviation of available capacities
1.4 1.2
4
5
(b) proportion of loads transferred (%)
(a)
3 round
1 0.8 0.6 0.4
50
c=128,churn=0.1 c=1024,churn=0.1 c=128,churn=0.9 c=1024,churn=0.9
40 30 20 10
0.2 0
0 0
5
10 round
(c)
15
20
0
5
10 round
15
20
(d)
Figure 6.4 The effectiveness of the scheme in systems with different numbers of clusters: (a) convergence ratio and (b) proportion of services moved in systems without churn, (c) standard deviation of remaining available capacity and (d) proportion of loads transferred in systems with churn rate of 0.1 and 0.9, respectively
144
convergence ratio
0.3
50
D=4 D=8 D=16 D=32
proportion of loads transferred (%)
0.4 0.35
0.25 0.2 0.15 0.1 0.05 0
D=4 D=8 D=16 D=32
40 30 20 10 0
1
2
3
4
5
1
2
round
proportion of loads transferred (%)
standard deviation of available capacities
5
(b) D=4,churn=0.1 D=32,churn=0.1 D=4,churn=0.9 D=32,churn=0.9
1.2
4
round
(a) 1.4
3
1 0.8 0.6 0.4
50
D=4,churn=0.1 D=32,churn=0.1 D=4,churn=0.9 D=32,churn=0.9
40 30 20 10
0.2 0
0 0
5
10 round
(c)
15
20
0
5
10 round
15
20
(d)
Figure 6.5 The effectiveness of the scheme in systems with the same number of clusters (e.g. C=512) and different cluster-size parameters: (a) convergence ratio and (b) proportion of loads transferred in systems without churn, (c) standard deviation of available capacities and (d) proportion of loads transferred in systems with churn rate of 0.1 or 0.9
However, we also observe that, when these system have churn (e.g. with a rate of 0.1 or 0.9), the standard deviations of available capacities that the systems could maintained are different. Here, for a clustered system, the standard deviation of available capacities is the standard deviation of the available node capacities of clusters. The bound (i.e. the average of the standard deviations of available capacities) for the system with D=4 is about 10 times as large as that for the system with D=32. That is, in the case that the churn rate is 0.1, the bound is 0.131 for D=4 and 0.016 for D=32; in the case that the churn rate is 0.9, that is 0.382 for D=4 and 0.038 for D=32. According to our analysis for
145
non-clustered system (see Section 5.3), there are two factors that affect the size of the bound of the standard deviation of available capacities in a system: (1) the change of the workload distribution on nodes caused by churn, and (2) the convergence speed of the load balancing scheme in a system without churn. Since the convergence speed of the diffusive scheme does not depend on the cluster-size parameter of a system, the convergence speed in a system with D=4 is as same as that in a system with D=32. Therefore, we intuit that the change of workloads on nodes caused by churn is the major factor that causes the difference between the systems with different cluster size parameters. In a clustered system with churn, the change of the workloads on nodes depends on the number of nodes per cluster. For example, in the case that the clusters have their available node capacities equal to the system average (written as AVC ), and the workloads of the nodes are equal to the system average as well (written as l ). If a node leaves cluster i, the workload of the remaining nodes in the cluster increases to
il . In i −1
the case that a node joins a cluster j, the workload of the nodes in the cluster reduces to jl . In the absence of load balancing, the leaving of one node from some cluster and j +1
the joining of a node into another cluster will therefore lead to a variance of the workloads of nodes (i.e. σ N2 (l ) ) given by the equation:
146
2
(i − 1) i l − l + ( j + 1) j l − l i −1 j +1 σ N2 (l ) = N 2 1 1 l + i − 1 j + 1 = N
2
(Equation 6.2)
where N is the number of nodes in the system. Since the number of nodes in a cluster is on average
5D 5D 5D , we have i − 1 ≈ and j + 1 ≈ . Then, Equation 6.2 can be 4 4 4
2 4 4 2 l + 5D 5 D l 4 2 simplified to σ N (l ) ≈ = . This indicates that the change of the N N 5D
workloads of nodes depends strongly on the average cluster size of the system. Therefore, between two clustered systems that have the same system size and different cluster size parameters, the system with the smaller cluster size parameter has the larger variance of workloads on clusters. We have seen that the bound of the standard deviation of available capacities does not depend on the number of clusters in the system. Therefore, between the two systems for Figure 6.5, the system with a cluster size parameter of 32 should have the smaller bound. In summary, the diffusive load balancing is scalable in a clustered system since its effectiveness does not depend on the number of clusters. Neither does the convergence speed of the load balancing depend on the sizes of clusters. However, systems with larger cluster sizes are less affected by churn, and have therefore smaller bound of the standard deviation on the available node capacities of clusters.
147
6.4. Load balancing through node migrations Moving nodes for balancing the loads on nodes has been proposed for P2P systems. For example, in addition to moving fine-grained data items between the nodes consecutively connected (in the space of node IDs for DHT systems or of object values for non-DHT systems), the load balancing schemes proposed in [Bharambe2004] and [Vu2009] also foresee the migration of nodes to improve the load balancing speed. A node is identified as overloaded (or under loaded) in the case that its load is larger (or smaller) than the average of the system by a factor. For obtaining load from an overloaded node, an under-loaded node sheds its workload to its original neighbors and leaves and rejoins to be the consecutive node of the overloaded node. However, these schemes require that the numbers of nodes in a local balancing operation (that performs load balancing for the nodes consecutively connected) are the same. Our algorithms described below can deal with clusters or neighborhoods having different numbers of nodes. We present two classes of algorithm here. One is the algorithm for systems having nodes with homogeneous capacity, and another is for systems having nodes with heterogeneous capacities. We describe these algorithms in the following sections using the same terminology used in Section 6.3.
148
6.4.1. Decision algorithms Since the diffusive scheme converges fastest with a directory-initiated decision algorithm,
we
propose
a
directory-initiated
decision
algorithm
(called
DIClustHomoNode) for deciding node migrations between the clusters in a
neighborhood. These node migrations change the total capacities as well as the number of nodes of the clusters involved, which further changes the available node capacities of these clusters. For example, in the case that a node with capacity C is moved into cluster i during a load migration, then we have avci′ =
moved out, we have avci′ =
i avci + C ; or, if a node with capacity C is i +1
i avci − C . i −1
6.4.1.1. Handling homogeneous nodes We consider in this subsection the case that all nodes have the same capacity C (i.e. the homogeneous capacity). The decision algorithm is designed to decide the numbers of nodes to be migrated between a pair of sender-receiver clusters. After these node migrations, the available node capacities of the clusters in the neighborhood become closer to their average avc Ai (calculated according to the operation using Equation 6.1 for a neighborhood Ai). For example, there is a migration between a pair of sender cluster s and receiver cluster r, and the migration includes k nodes. After the migration, the available node capacities of s and r become avcs′ =
avc r r − kC avc s s + kC and avc r′ = s +k r −k
149
respectively. In order for the diffusive load balancing to converge, the inequalities avcs′ ≤ avc Ai ≤ avcr′
have
to
be
satisfied.
For
the
sender,
we
have
( avc Ai − avcs ) s k acceptable = which is the largest number of nodes that s can receive C − avc s ( avcr − avc Ai ) r without becoming under-loaded. For the receiver, we have k providable = C − avcr which is the largest number of nodes that r can provide without becoming over-loaded. Then, the decision algorithm chooses k such that k = min{k acceptable , k providable } . In this way, the migration reduces the differences between the available node-capacities of the clusters in the system. Similar to the DIClustService algorithm (see Section 6.3.1), the algorithm first identifies a cluster x as overloaded if avc x > avc Ai or as under-loaded otherwise. The information of overloaded and under-loaded clusters is stored in Vector SVect and RVect, respectively. Then, the algorithm calls the Decision procedure described in Figure 6.6. The Decision procedure stops in the case that one of the vectors SVect and RVect is empty (line 2 in Figure 6.6(a)). Otherwise, the procedure selects a pair of clusters. The selected sender cluster s has the largest kacceptable among the overloaded clusters, and the receiver cluster r has the largest kprovidable among the under-loaded clusters (line 3 and 4 in Figure 6.6(a)). Then, the procedure calls the Selection function (line 5). In the case that the Selection function returns a value larger than zero, the Decision procedure schedules the node migration including the value (line 7 in Figure 6.6(b)). The procedure continues to select the next pair of clusters thereafter. Otherwise, the Decision procedure stops (line 10 in Figure 6.6(a)). At this moment, it is impossible for the procedure to find any
150
additional node migration between the clusters remaining in SVect and RVect. These clusters have smaller k acceptable or k providable than the current pair. Decision Procedure 1 2
Do forever if SVect and RVect are not empty
3
s = max {kacceptabe =
4
r = max {k providable =
j∈SVect
j∈RVect
( avc Ai − avc j ) j C − avc j (avc j − avcAi ) j C − avc j
}
}
k= selection(s,r) 5 6 if (k > 0) 7 move k nodes from r to s 8 remove s from SVect and r from RVect 9 else 10 break; 11 else break; 12 13 end of Do (a) Selection(s, r) function 1 k = 0;
( avc Ai − avcs ) s k acceptable = ; C − avcs ( avcr − avc Ai ) r k providable = ; C − avcr k = min{k acceptable , k providable };
2
3 4 5
if k=0 then
6
if
7 8
avcs s + C avcr r − C ≤ then s +1 r −1
k = 1; return k;
(b) Figure 6.6 The decision procedure and the selection function of the DIClustHomoNode algorithm (a) the Decision procedure, (b) the Selection function
151
The Selection function calculates the number of nodes that should be included in the node migration between r and s. The Selection function returns k in the case that k = min{k acceptable , k providable }> 0 (line 4, 5, and 6 in Figure 6.6(b)). Otherwise, the Selection
function returns one if avcs′ ≤ avcr′ could be satisfied after one node migrates (line 8 and 9 in Figure 6.6(b)) or returns zero if avcs′ > avcr′ could happen. We analyze the convergence of the proposed diffusive scheme from three points of view. First, using the scheme with the DIClustHomoNode algorithm, a system is able to enter a globally stable state when it has a static workload. In this state, the system does not have any node migration. The scheme is to converge. We have shown that the scheme using DIHomoService is able to converge (see Section 5.6.1). Compared to that scheme, the proposed scheme only uses a different algorithm (i.e. DIClustHomoNode) for deciding node migration. Since the DIClustHomoNode guarantees that the differences of the available node capacities of clusters in a neighborhood are reduced in an operation, the proposed scheme conforms to the assumptions of the general model proposed in [Cedo2007]. Therefore, eventually, the operations of the proposed scheme do not decide any node migration for the system, and the system enters a globally stable state. Second, since the node migrations between clusters do not change the total capacity and workload of the system, the global average of the available capacities of nodes does not change. Therefore, the variances of the available capacities of nodes and of the available node capacities of clusters are monotonically non-increasing till the scheme stops. Third, we show that the differences of the available node capacities of clusters are bounded in a globally balanced state. When a system enters a globally stable state, the available node capacities of a receiver cluster r and a sender cluster s in a neighborhood satisfy the following inequality:
152
avcr r − C avcs s + C < r −1 s +1
(Inequality 6.1)
where the node capacity is u; otherwise, a node migration with at least one node is to be decided between the pair. Since avcr −
avcr r − C avcs s + C C C < and < avcs + , r −1 r −1 s +1 s +1
the difference between the available node capacities of the two nodes satisfies the following inequality:
avc r − avc s < ε where ε =
C C . Since the number of + r −1 s +1
D nodes in a clustered system is in the range ,2 D , we get 2 C
4D 4D 0 12 send a node movement instruction with the value of Cexpected to r and s 13 remove s from SVect and r from RVect 14 else 15 remove s from SVect 16 goto line6 17 end of Do (a) Selection(s, r)
1 2
Cacceptable = ( avc Ai − avcs ) s + avc Ai
3
C providable = ( avcr − avc Ai ) r + avc Ai
4
if min Cacceptable , C providable ≥ avcr
5
and Cr _ min ≤ min Cacceptable , C providable , and Cr _ max ≥ avcr
6 7
Cexpected= min Cacceptable , C providable
Cexpected=0
{
}
{
{
}
}
else
8
if
avcs s + Cr _ min s +1 Cexpected= Cr _ min
≤
avcr r − Cr _ min r −1
and Cr _ min ≥ avcr
9 10 return Cexpected (b)
Figure 6.7 The Decision procedure and the Selection function of the DIClustHeteroNode algorithm (a) the Decision procedure, and (b) the Selection function
157
We can prove the convergence of the diffusive scheme using the DIClustHeteroNode algorithm by the same technique as for the scheme with the DIClustHomoNode algorithm. The DIClustHeteroNode algorithm implements a Selection policy different than DIClustHomoNode. The policy specifies that only a node whose capacity is larger than avcr can move between two clusters. This policy prevents the case that, after a node migration, a sender cluster has an available node capacity even smaller than it has before the migration, or a receiver cluster has an available node capacity even larger (i.e. avcs′ < avcs or avcr′ > avcr ). This policy guarantees that the differences between the
available node capacities of clusters are always non-increasing. Therefore, the scheme with the DIClustHeteroNode algorithm converges. We evaluate the effectiveness of the DIClustHeteroNode algorithm through simulations in the following subsections.
6.4.2. Effectiveness of load balancing through node migration As shown by our convergence analysis above, load balancing in a clustered P2P system can be achieved by node migrations. However, this approach could display properties that are different from those shown when load balancing is achieved by the exchange of fine-grained services. We investigate these properties in terms of the convergence speed of the scheme, bound of the standard deviation of available capacities, and costs for load balancing, including the number of nodes moved and the number of cluster splits or mergers.
158
6.4.2.1. The impact of cluster sizes The DIClustHomoNode algorithm is designed based on the DIHomoServ algorithm. We have observed in Section 5.6.3 that the convergence speed of the DIHomoServ algorithm depends on the size of services (e.g. the services have the same resource requirement l). Now, we consider an ideal algorithm called CBHomoServ for a nonclustered system with large-sized services. This algorithm maximally reduces the differences of the available capacities of the nodes in a neighborhood. After one load balancing operation by a given node finishes, the local load imbalance (i.e. the maximal difference between the available capacities of the nodes in the neighborhood) is bounded by 2l. Therefore, in a system with smaller l, the scheme converges faster. Then, we consider CBClustHomoNode algorithm as the CB algorithm for the scheme that moves nodes in a clustered system. With the CBClustHomoNode algorithm, the local load imbalance is bounded by C
4D (according to Inequality 6.2). Therefore, the D2 − 4
convergence speed of CBClustHomoNode is affected by the cluster-size parameter D. The algorithm converges faster in a system with a larger D. We believe that this is the same for the DIClustHomoNode algorithm. Table 6.1 compares the effectiveness of the DIClustHomoNode in systems with various cluster size parameters (e.g. D=4, 8, 16 or 32). All these systems have 512 clusters. Table 6.1(a) shows the effectiveness of the scheme in systems without churn. The data in the table confirms our intuition. In a system that has a D as large as 4, the convergence ratio γ 1 of the scheme is about 6 times as large as that in a system with D=32 (e.g. for the case of D=4, γ 1 is 0.17; for the case of D=32, γ 1 is 0.024). In addition,
159
the cluster size parameter D also affects the differences between the available capacities of clusters in a system. The differences in the system with D=4 are about 9 or 10 times as large as those in the system with D=32. For example, in Table 6.1(a), the standard deviation is 0.498 for D=4 or 0.057 for D=32, and the maximum difference is 2.98 for D=4 or 0.297 for D=32. However, in systems with larger cluster sizes, more nodes are
moved between clusters. For example, for the case of D=4, the proportion of nodes moved is about 25%, and for the case of D=32, it is about 30%. Table 6.1 Effectiveness of the diffusive load balancing in systems with various cluster sizes (C=512) (a) Systems without churn Standard deviation of available capacities
Mean
Maximum difference of available capacities
Mean
r1
95% C.I. 95% C.I. Mean 95% C.I.
r2 Proportion of nodes moved
Mean
D=4
D=8
D=16
D=32
0.498
0.2278
0.1158
0.057
0.0056
0.0032
0.0011
0.0003
2.982
1.421
0.640
0.297
0.1334
0.0730
0.0227
0.0068
0.172
0.077
0.041
0.024
0.0016
0.0010
0.0004
0.0001
0.992
0.987
0.991
0.984
95% C.I.
0.0048
0.0061
0.0052
0.0038
Mean
25.513
28.083
29.639
30.513
95% C.I.
0.1048
0.1044
0.0623
0.0260
(b) Systems with churn Churn=0.1 D=4 Split(%) Merger(%)
Mean
Bound of the standard deviation of available capacities
D=32
D=4
D=32
0
0.375
0.017 0.0182
95% CI
0.056
0
0.0719
Mean
0.073
0
0.348
0
0.0360
0
0.0512
0
95% CI Proportion of nodes moved (%)
0.195
Churn=0.9
Mean
0.724
0.092
5.825
0.729
95% CI
0.069
0.0069
0.1634
0.0210
Mean
0.523
0.062
0.655
0.072
95% CI
0.006
0.0059
0.0107
0.0057
Now, we compare the cases of moving nodes and moving services in systems with churn. First, for the case of moving nodes, the bound of the standard deviation of available node capacities also depend on the cluster size parameter of a system. That is, 160
the bound increases by a factor of about 9 with the decreasing of the parameter from 32 to 4 (e.g. in Table 6.1(a), the bounds are 0.062 for D=32 and 0.523 for D=4 when the churn rate is 0.1, and 0.072 for D=32 and 0.655 for D=4 when the churn rate is 0.9). Second, while the load balancing operations move nodes instead of services, the system has the larger bound of the standard deviation of available capacities. Third, the difference between the bounds for the two cases depends on the rate of churn. For example, when the churn is at a rate of 0.1, the bounds of both systems (with D=4 and D=32, respectively) for the case of moving node are 3 times larger than those for the case
of moving services. When the churn is at a rate of 0.9, the bounds for the case of moving nodes are one times larger. This observation indicates that the impacts of churn on the bounds are different for the two cases. For example, for the case of moving nodes, a system has its bound increased 20% with the increase of the churn rate from 0.1 to 0.9. For the case of moving services, the system has its bound increased by a factor of about 3. This is because an operation will not decide a node migration unless the difference between the available node capacities of two clusters is large enough. But, an operation always decides service migrations with fine-grained services. Therefore, we conclude that, for the case of moving nodes, churn has less impact on the standard deviation of the available capacities of a system as well as the effectiveness of the scheme. Then, we discuss the costs in the case of moving nodes. Clearly, churn also influences the proportion of nodes moved for load balancing. First, the larger the churn rate is, the larger the proportion of nodes is moved. Table 6.1(b) shows that the proportions of nodes for the cases of a churn rate of 0.1 are 8 times as large as those for the cases of a churn rate of 0.9. Second, the larger the cluster size parameter is, the smaller the proportion of
161
nodes is moved. For example, between the two systems in the experiments, 13% more proportion of nodes are moved in the system with D=4. Third, while moving node for load balancing, the systems have less splits or mergers. In an unbalanced system with D=4, there are 0.34% clusters that split or merge in a round when churn is at the rate of
0.1, and 1.7% when the rate is 0.9. Moving node for load balancing, the system only has 0.195% clusters split or merge when the rate is 0.1, and 0.395% when the rate is 0.9. Furthermore, between the two systems, the system with the larger D has fewer clusters splitting or merging. We claim that, using the diffusive load balancing, the clusters in the clustered system (described in Section 6.3.2.1) has less splits or mergers. We conclude that, as an inter-cluster load balancing scheme, the diffusive scheme converges in a system by moving nodes. A system that has a larger cluster-size parameter maintains the smaller bound of the standard deviation of available capacities with fewer costs of load balancing when the system has churn. The scheme maintains the larger bound for a system while moving nodes instead of services. However, in this case, churn has fewer impacts to the effectiveness of the scheme. When nodes are moved for load balancing, a system has the frequency of cluster splits or mergers reduced. We also did experiments to investigate the factors, such as workload, capacities, or number of clusters; these factors have little impact on the effectiveness of the scheme. The results of these experiments are shown in Appendix B.
6.4.2.2. Nodes with heterogeneous capacities In our previous experiments, the systems have nodes with homogeneous capacity. In this subsection, we investigate the available capacities of a system having nodes of
162
heterogeneous capacities. The heterogeneous capacities of P2P nodes are often modeled by a capacity distribution with a large variance, such as a Pareto distribution. For example, Godfrey et al. [Godfrey2004] uses this kind of distribution where most (e.g. 80%) have small capacities, and the remaining nodes (e.g. 20%) have large capacities. In the following experiments, the simulation program generates Pareto distributed random values for the capacities of the nodes in the systems. The distribution has the shape parameter equal to 2 and the scale parameter equal to 100. Therefore, the mean of the node capacities is 200 requests/second, and the variance is infinite. In the simulated systems, the maximum capacity for a node is 5000 requests/second, and the minimum is 100 requests/second. There are N=10,000 nodes in the system. The system has a small portion of nodes with extremely high capacities. As we have shown, in the presence of churn, the standard deviation of available capacities of a system highly depends on the variance (or heterogeneity) of its node capacities when the system has churn (see Section 5.3.3). In the following, we first compare the effectiveness of the diffusive scheme in two different systems have the same average node capacity. One system is a homogeneous system that has nodes with the homogeneous capacity of 200 requests/second. Another is a heterogeneous system that has nodes with heterogeneous capacities (e.g. the Pareto distribution described above). They use D equal to 8. In Figure 6.8, we observe that the bounds of standard deviations of available capacities for the case of the heterogeneous system are about 5 to 6 times larger than those for the case of the homogeneous system. For example, in the case that the churn rate is equal to 0.1 (or 0.9), for the homogeneous system, the bound is around 7.2 (or 10). However, for the heterogeneous system, the bound is around 45 (or 55).
163
90
Pareto, without VN, D=8 Pareto, with VN, D=8 homo, capacity=200, D=8 Pareto, without VN, D=32
80 70
standard deviation of available capacities
standard deviation of available capacities
90
60 50 40 30
70 60 50 40 30
20
20
10
10
0
Pareto, without VN, D=8 Pareto, with VN, D=8 homo, capacity=200, D=8 Pareto, without VN, D=32
80
0 10
15
20
25
30 35 round
(a)
40
45
10
15
20
25
30 35 round
40
45
(b)
Figure 6.8 The standard deviation of available capacities of the systems using virtual nodes or without (a) churn rate equal to 0.1 and (b) churn rate equal to 0.9
We propose two alternatives for a heterogeneous system to reduce the size of its bound. The system could use a large cluster-size parameter (e.g. D=32) or use virtual nodes. In the approach of virtual nodes, a physical node with the capacity larger by a given factor (e.g. 2) than the mean node capacity of the system, is divided into multiple virtual nodes, and each virtual node has the capacity equal to the mean (e.g. 200 requests/second in our example). A virtual node joins a cluster picked at random when its physical node joins the system, and the virtual node leaves the system when its physical node leaves. Similar to virtual servers proposed in [Surana2006], virtual nodes host services. However, a virtual node has a fixed capacity in addition to the resource requirements of its services. These two alternatives both effectively reduce the bound of the standard deviation of available capacities for a system whose nodes have heterogeneous capacities. Figure 6.8(b) shows that, using virtual nodes, a heterogeneous system with virtual nodes has a bound whose size is similar to that of a homogeneous system. However, using virtual nodes adds extra costs to a system. First, a system has more clusters when virtual nodes
164
are used (e.g. the heterogeneous system in the example has 20% more clusters when it uses virtual nodes). The system uses more messages in order to manage these extra clusters. These messages are for managing the membership of clusters and the connections between clusters. Second, the system using virtual nodes has the larger number of node movements (e.g. around 6000 node movements when the churn rate is 0.9). Table 6.2 shows that this number is twice as large as that of the system without virtual nodes. Table 6.2 Costs caused by load balancing in the heterogeneous systems churn = 0.1 no VN Number of splits
with VN
Churn = 0.9 D=32, no VN
no VN
with VN
D=32, no VN
Mean
33.129
36.484
3.613
99.903
145.903
0.839
95% CI
1.6339
2.3022
0.5589
2.9193
3.1581
0.2751
Proportion of clusters split
Mean
Number of merges
Mean
32.903
95% CI
1.9781
Proportion of clusters merge
Mean
Number of node movements
Mean
95% CI
95% CI 95% CI
2.795
2.641
1.407
8.896
11.053
0.325
0.1388
0.1683
0.2178
0.2659
0.2455
0.1062
35.581
3.355
99.935
146.355
0.935
1.7863
0.5374
2.9041
3.9735
0.3789
2.775
2.574
1.303
8.896
11.084
0.362
0.1654
0.1256
0.2071
0.2488
0.2891
0.1461
1039.871
1511.129
987.097
3139.58
6342.516
968.581
18.6032
29.0615
30.8143
67.4946
46.2513
15.3889
Using a cluster-size parameter as large as D=32, the heterogeneous system does not have these costs while the sizes of the bound of the available capacities are still smaller than those of a system with D=8. In Figure 6.8(b), the standard deviation of available capacities for the case of the heterogeneous system is slightly larger than for the case of the homogeneous system with D=8 when the churn rate is equal to 0.1 or 0.9. Table 6.2 also shows that the numbers of cluster that split or merge are much smaller than in the other cases. The number of node movements does not increase with the increase of churn. Therefore, the heterogeneous system is suggested to use a cluster-size parameter as large
165
as 32. The standard deviation of available capacities would be bounded slightly larger than for a system using virtual nodes. However, it has a much smaller cost compared with the system using virtual nodes. A comprehensive study that compares these techniques (using virtual nodes and using large sized clusters) is suggested.
6.5. Summary The decision algorithms for load balancing push the available capacities of the nodes in a neighborhood to their average in a clustered P2P system. The average of a neighborhood does not change in an operation. Therefore, the variance of the available capacities of the nodes in the system is monotonically non-increasing, and the available capacities of the nodes converge in a clustered system. We have shown that the diffusive load balancing scheme effectively reduces the differences between the available node capacities of clusters. The convergence speed of the diffusive scheme is not affected by the number of clusters in the system; therefore, the scheme is scalable to large system sizes. Moreover, the convergence speed of the scheme does not depend on the sizes of the clusters. However, a system has a smaller standard deviation of available capacities in the case that it has larger sized clusters since these clusters effectively reduce the variation of workload caused by churn. The scheme also converges when the load balancing operations move nodes between clusters for inter-cluster load balancing. When a system is in a globally stable state, no further node movement will be initiated. The differences between the available node capacities of clusters are fixed. The scheme maintains the larger bound for a system while moving nodes instead of services. However, in this case, churn has fewer impacts to the
166
effectiveness of the scheme. When nodes are moved for load balancing, a system with churn has the frequency of cluster splits or mergers reduced. While having churn, compared to a homogeneous system whose nodes have the same mean capacity, a heterogeneous system maintains the standard deviation of its available capacities in a larger bound. Using virtual nodes, a heterogeneous system (e.g. whose node capacities follow a Pareto distribution) can have a bound of available capacities close to that of a homogeneous system, however, with extra costs for maintaining more clusters and managing more cluster splits and mergers. Using a cluster size parameter as large as 32, the heterogeneous system spends much less costs on load balancing while maintaining the standard deviation of its available capacities in a bound slightly larger than a homogeneous system with the cluster size of 8.
167
7. Conclusion 7.1. Summary Our research applies a diffusive load balancing scheme to P2P systems. P2P nodes asynchronously run the operations of this scheme. These operations adjust the load of nodes in the neighborhoods within the overlay network according to the characteristics of these systems. An operation has three stages. It begins with the Information stage where the operating node pulls load information from its neighbors within the overlay network. Then, at the Decision stage, the operation decides load transfers by using a decision algorithm. The determined load transfers are realized during the Load Transfer stage. A node only participates in one load balancing operation at a time, which guarantees noninterference between different load balancing operations. The load balancing operations equalize the available capacities of nodes so that these nodes could have similar response times while providing services. The available capacities of the nodes converge to an average in a system with static workload. In this case, no services are added nor removed from the system, and the requests rates of services do not change. In the case that the services are fine-grained, the available capacities of nodes approach the global average. In the case that the services are largesized, there is a remaining imbalance. In a system that has larger services or an overlay network with a larger diameter, the remaining imbalance is larger.
168
The effectiveness of the proposed scheme depends on various factors. Several decision algorithms have been designed for use during the decision stage. The traditional Proportional algorithm is inferior to others since that algorithm converges at the lowest
speed and induces the largest costs. The Complete Balancing (CB) algorithm is an ideal case; however, it is difficult to implement in a real system. The Directory-initiated (DI), Sender-initiated (SI), and Receiver-initiated (RI) algorithms are practical algorithms that
are feasible in real systems. The scheme performs best when a directory-initiated decision algorithm is used. Moreover, the convergence speed of the load balancing scheme depends on the structure of the P2P overlay network and the load distribution of nodes. Furthermore, in a P2P system with churn, the scheme is able to control the average of the standard deviation of the available capacities of the nodes within a bound. Since the effectiveness of the diffusive scheme does not depend on the number of nodes in a P2P system, the scheme is scalable. The diffusive scheme can also be applied to inter-cluster load balancing in clustered P2P systems. By equalizing the available capacities of the nodes in a clustered system, the scheme effectively equalizes the available node capacities of the clusters. The sizes of the clusters do not affect the convergence speed of the diffusive scheme. However, when a system has churn, the variation of loads caused by node leaving or joining is smaller in the case that the clusters are larger-sized. As a result, the system with larger-sized clusters has the smaller bounds of available capacities. The scheme maintains the larger bound for a system while moving nodes instead of services. However, in this case, churn has less impact on the effectiveness of the scheme. A system having nodes with heterogeneous capacities can have its bound reduced by using virtual nodes or using large-sized clusters.
169
7.2. Contributions Diffusive load balancing schemes are used in parallel computing systems, and these schemes deal with the characteristics of parallel computing programs and of hardwired processors in these systems. We proposed a diffusive scheme according to the characteristics of P2P systems. The diffusive scheme described in this thesis can also be used in a distributed computing system whose characteristics are similar to those of P2P systems. Our contributions are as follows: •
We developed diffusive load balancing for P2P systems. We designed the policies of the scheme, the stages of the load balancing operations, and the decision algorithms. We further compared the different decision algorithms in terms of their effectiveness for load balancing by extensive simulation studies. The results from this research will be published in [Qiao2012].
•
We have proposed to use the available capacites of nodes as load index. Using this load index, the decision algorithms of these operations can precisely calculate the workload that should be transferred between nodes. As a result, the mean response times of the services in the system become similar. Other researchers proposed to use the utilization, or the workload of nodes as load index. These indexes can not equalize the mean response time of services in a P2P system.
•
Using the available capacity as load index for the nodes, the diffusive load balancing can deal with heterogeneity (e.g. services with heterogeneous resource
170
requirements, and/or nodes with heterogeneous capacities). These results were published in [Qiao2011]. •
We have used new measures of the performance and the effectiveness of diffusive load balancing. In the literature, the maximum difference of loads among nodes [Vu2009], or the portion of failed requests [Surana2006] in the steady state of a dynamic system have been considered. We use the standard deviation of the load distribution in the steady state. We also investigate the convergence speed of load balancing and the cost of load migrations during the load balancing operations. This approach allows us to analyze the effectiveness of load balancing from different perspectives.
•
We also extend the diffusive load balancing to clustered P2P system. We developed the decision algorithms that lead to similar available capacities for the nodes. We further proposed a clustered P2P system that uses the diffusive load balancing for its services to have similar response times [Qiao2010]. Some earlier results along these lines were published in [Qiao2009A and Qiao2009B]. In these papers, the clustered system used the structure of eQuus [Locher2006].
7.3. Future work Our results on diffusive load balancing can be extended in the following ways. First, some other aspects of P2P systems could be considered in the study of the effectiveness of the load balancing scheme. For example, the formation of clusters could be theoretically analyzed (e.g. by using a Markov chain). In our study, we use the average number of nodes for indicating the sizes of clusters. Also, the online times of nodes could
171
be considered for systems with churn. As we reviewed in Section 2.5.1, P2P nodes with larger capacities stay online longer than nodes with smaller capacities in P2P systems. In our research, the probabilities for nodes to leave an overlay network are assumed to be the same. Second, the load balancing operations could use a flexible running period. Each node in the system runs periodically a load balancing operations. We have assumed that the period between two consecutive runs is configured by a system parameter. A node could run operations in flexible running periods and always have its available capacity larger than zero. When the system has high churn (e.g. at a rate of 0.9), the nodes may use a running period shorter than the fixed system parameter. The load variations caused by churn at the rate could be resolved faster so that the standard deviation of available capacities could be further reduced. When the system has small churn (e.g. at a rate of 0.1), the nodes could use a running period longer than the parameter. The system could reduce the cost of load balancing while maintaining an acceptable performance. Using a flexible running period, the operations of the scheme would work more efficiently. Third, our scheme currently equalizes the available capacities of the nodes. The scheme could be modified to equalize another performance parameter, for example, the utilization of storage space, CPU, or network bandwidth. Also, multiple performance parameters could be combined into one load index. Fourth, each operation of the scheme could have multiple decision components in the neighbourhood. These decision components could consider different perspectives, for example, performance, locality, or power cost of the nodes. Each decision component makes its own decision. The decision components negotiate to reach a local equilibrium
172
in the neighbourhood. The global equilibrium can be achieved by using the diffusive approach. The proposed diffusive load balancing scheme could be deployed in a large scale distributed computing system. The system provides services to end-users. These services are moveable. That is, they can be removed from a node and installed on another node. The system is able to locate them wherever they are; however, such service movements should be transparent to the user.
173
Appendix convergence load
A: of
balancing
Proof
of
asynchronous with
local
synchronism This appendix proofs the convergence of an algorithm called asynchronous load balancing with local synchronism. First, we define this algorithm by using two assumed properties: one defines local synchronism (i.e. Assumption A-1), and the other concerns the decision algorithm (i.e. Assumption A-2). Following the definition, we prove that the algorithm converges when these two assumptions are satisfied in each load balancing operation. The load balancing scheme presented in Chapter 4 realizes these assumptions. That is, the Information and Load Transfer stages of the load balancing operations realize the assumption of local synchronism, and the Decision stage realizes the second assumption. We adopt the notations used in [Bertsekas1997] in this appendix. These notations are different from those used in the main body of this thesis. For example, workloads are used in [Bertsekas1997] as the load indexes of nodes. Since the proposed load balancing scheme in the thesis uses available capacity of nodes as load index, the notations for workloads are changed to those for available capacities. The decision algorithm defined by Assumption A-2 corresponds to the Receiver-initiated algorithm (i.e. RI). Considering these changes, we conclude that the proof in this appendix implies that the load balancing scheme proposed in the thesis converges. We can prove the correctness of other decision algorithms proposed in this thesis in a similar way as in Section A.2.2 below.
174
A.1.
Definition of load balancing
We define the proposed load balancing by following the notations used in Section 7.3 of [Bertsekas1997] for a partially asynchronous load balancing algorithm. We present this partially asynchronous algorithm first, and the asynchronous algorithm with local synchronism next. In the following sections, we use the following notations. We define a network for the system using a load balancing algorithm for the following proof. This system has n nodes. Its network is described by a graph G =< N , E > , where N is the set for the nodes, and E is the set for the edges between these nodes. The edges are directed. A node can reach any other node through these edges. t represents the time in the system. The total of the workloads in the system is denoted by L which is equal to the sum of the workloads of all nodes. This total does not change during the progress of load balancing. i is the index of a node that conducts a decision action, and Ai is the neighborhood of node i in the system. Tdi is the set of the times instants when node i runs a decision action. The workload of a node i at time t is xi (t ) . A node j reports its load status to its neighbors from time to time. Node i stores the information of the load statuses of its neighbors. The load status information denoted as x ij (t ) stored by node i at time t is contained in a report sent from j to i at time trji (t ) , that is, x ij (t ) = x j (trji (t )) . For the node i, this information is collected at time t, that is, xii (t ) = xi (t ) . For a time when node i starts the decision stage, that is, for a time td with td ∈ Tdi , we have x ij (td ) = x j (trji (td )) and xii (td ) = xi (td ) . During the decision action at time td , node i may decide a load transfer with the amount sij (td ) from i to j, and node j receives this load at time tlij (td ) . Figure A.1 shows the times
for the actions of load balancing.
175
Node i Node j
t trji (td ) td t ij (t ) l d Figure A. 1 The times when actions of load balancing are conducted
A.1.1. Partially asynchronous load balancing Bertsekas defined a partially asynchronous load balancing (we call it Bert algorithm in this appendix) in [Bertsekas1997] by two assumptions: Assumption 4.1 (we call it Bert-1) and 4.2 (we call it Bert-2). Assumption Bert-1 specifies when the actions of this load balancing are executed, and Assumption Bert-2 applies to the decision algorithm used by a load sender. We call this algorithm “partially asynchronous iterative method” for load balancing since it requires the message delays to be bounded to B time units. Assumption Bert-1 has three sub-assumptions. Assumption (a) specifies that a node runs a decision action at least once during any time interval of B units. Assumption Bert-1(b) specifies that, at any time t, the information stored on node i is the load status of a node j at some time after t-B. This assumption guarantees that the running node uses the updated information for its decision actions. Assumption Bert-1(c) specifies that, when a node sends the load to another node determined by an operation at time td , the load is received at some time before td + B . Figure A.2 shows two report actions and two decision-load transfer actions. These actions are defined by Assumption Bert-1. The times related to one of the decision actions are labeled.
176
Node i Node j
t ji r
t ( td ) t d t ( t ) d td + B td − B ij l
td − B < trji (td ) ≤ td td ≤ tlji (td ) < td + B Figure A. 2 The actions for load balancing defined by Assumption Bert-1
Partial Asynchronism:
Assumption Bert-1. There exists a positive integer B such that: (a) For every i and for every t ≥ 0 , at least one of the elements of the set {t , t + 1,K, t + B − 1} belongs to Tdi . (b) The inequality t − B < trji (t ) ≤ t holds, for all i and t, and all j ∈ Ai (c) For node i, at some time td ∈ Tdi , the load sij (td ) is sent from node i . The inequality td < tlij (td ) ≤ td + B holds for node j to receive this load at time tlij (td ) .
Bert-2 specifies two properties that should be satisfied by a load balancing decision action. The first one defines a property about the amounts of load contained in the load transfers from a sender to the least loaded receivers. The second one implies that, after the sender removes the excess loads and the receivers add the load transferred, the sender still keeps its position the list of nodes in the neighborhood, arranged in ascending order of their workloads.
177
Assumption Bert-2. (a) The amount transferred from a sender i at time td ∈ Tdi to the receiver j with the lightest load (i.e. x ij (td ) = min k ∈ A( i ) xki (td ) ) satisfies sij (td ) ≥ α (xi (td ) − x ij (td )), where α is a constant with α ∈ (0,1) . (b) For a sender i, and a time td ∈ Tdi , for any j ∈ Ai with xi (td ) > x ij (td ) , the following inequality is satisfied: xi (td ) −
∑ s (t ) ≥ x (t ) + s (t ) ik
d
i j
d
ij
d
k ∈ A( i )
We present R-Bert-2 as follows. This is a revised version of Assumption Bert-2. The (a) is the same as Bert-2(a). The (b) says that, after the sender removes the excess loads, and the receivers add the load transferred, the sender still has its load larger than its receivers.
Assumption R-Bert-2. (a) The amount transferred from a sender i at time td ∈ Tdi to the receiver j with the lightest load (i.e. x ij (td ) = min k ∈ A( i ) xki (td ) ) satisfies sij (td ) ≥ α (xi (td ) − x ij (td )), where α is a constant with α ∈ (0,1) . (b) For a sender i, and a time td ∈ Tdi , for any j ∈ Ai with xi (td ) > x ij (td ) and sij (td ) > 0 , the following inequality is satisfied: xi (td ) −
∑ s (t ) ≥ x (t ) + s (t ) ik
d
i j
d
ij
d
k ∈ A( i )
A.1.2. Asynchronous load balancing with local synchronism Similar to the Bert algorithm presented in the last section, we also use two assumptions to specify this load balancing. Assumption A.1 defines the concept of local synchronism. Assumption A.2 defines a decision algorithm. Different from Bert algorithm, this load
178
balancing algorithm has an extra probing action in addition to decision and load transfer actions. A load balancing operation is a sequential running of these three actions. Besides the notations defined above, we further define Tpi to be the set of times when the probing action starts. Then, for a node i and an operation that starts its probing stage at time t p and conducts its decision stage at time td , we have t p ∈ Tpi and td ∈ Tdi . We assume that the message delay is bound to B time units. Local synchronism:
Assumption A-1. There exist positive integers B and H such that: (a) For every i and every t ≥ 0 , a time between [t , t + H − 1] belongs to Tpi . For a t p , with t p ∈ Tpi , there is a td ∈ Tdi . (b) For any i, any pair of t p ∈ Tpi
and td ∈ Tdi , and any j ∈ Ai , the following
inequalities
hold:
t p ≤ trji (td ) < t p + B, trji (td ) ≤ td ≤ t p + 2 B, td ≤ tlij (td ) < t p + 3B , and . 3B < H . And H is large enough so that every node in the system could run an operation at least once. (c) A node participates in only one operation at a time, either as a running node, or as a neighbor. Figure A.3 shows the times related to the actions defined by A-1. During the time interval between t and t+H-1 (inclusively), node i runs an operation starting at time t p , that is,
t p ∈ Tpi . It sends probing messages out to its neighbors, and a probing message is received by a neighbor j at time trji (td ) . Right after receiving this probing message, node j sends a reporting message which contains its current workload equal to x j (trji (td )) to
node i. The reporting message is received by i before time td . Since a node is allowed to participate in only one operation at a time, we have the following equations for the loads on
the
nodes
in
the
neighborhood Ai :
xi (td ) = xi (t p ) for
node
i,
and 179
x j (td ) = x j (trji (td )) = x ij (td ) for all nodes j with j ∈ Ai . At time td , node i calculates the load equal to sij (td ) for a load transfer to node j and initiates the load transfer. Thereafter, this operation is finished, at time td ∈ Tdi . The load equal to sij (td ) is received by node j at time tlij (td ) .
tp ≤ trji (td ) < tp + B
Probing: t for node i
Load status reporting: trji (td ) ≤ td ≤ t p + 2 B
t for node j
ji t p tr (td ) td tlij (td )
t for the system
tp + H
Load transferring:
td ≤ tlij (td ) < td + B
One operation:
3B < H
Figure A. 3 The local synchronism defined by Assumption A-1
Assumption A-2 specifies the decision algorithm used by the decision action of load balancing.
Assumption A-2. (a) For any t p ∈ Tpi and corresponding td ∈ Tdi , node i becomes the sender when
∑ x (t ) i j
xi (td ) > x Ai (td ) is satisfied where x Ai (td ) =
j∈ Ai
Ai
d
and Ai is the size of the
neighborhood.
(
)
(b) For ∀j : j ∈ Ai ∧ x ij (td ) < x Ai (td ) , we have sij (td ) = α ij (td ) xi (td ) − x Ai (td ) where
α ij (td ) =
∑
x Ai (td ) − x ij (td ) k ∈ Ai ; x ki ( t d )< x Ai ( t d
() x (t ) − x (t )) . Ai
d
i k
d
Assumption A-2 corresponds to the Receiver-Initiated decision algorithm (i.e. RI) in Chapter 4. After we replace the workload x with available capacity avc and “sender” with “receiver”, Assumption A-2 indicates that the receiver reduces its available capacity and increases the available capacities of the senders.
180
A.2.
Proof of convergence
We prove that the workloads on nodes converge to their average in a system using the asynchronous load balancing algorithm with local synchronism. First, we proof that, a load balancing algorithm which is specified by local synchronism (i.e. A-1) and the revised Bertsekas’ decision algorithm (i.e. R-Bert-2) converges. Then, we proof that A-2 implies R-Bert-2. Therefore, we can conclude that the load balancing of Chapter 4, which is defined by the assumptions of A-1 and A-2, converges.
A.2.1. Assumptions A-1 and R-Bert-2 imply convergence Now, for a system, we define the minimum of workloads at time t equal to the minimum of workloads in the duration (t − H , t ] .
Definition A.1. The minimum of the workloads on nodes at time t is m (t ) = min min xi (τ ) . i
t − H xi (t ) ≥ m (t ) + β (xi (t ) − m (t )) for some β ∈ (0,1) . Therefore, the inequality A.1 holds for the above two cases. In the case that, for a time t equal to td with td ∈ Tdi , node i decides load transfers to its neighbors as a sender. According to Assumption R-Bert-2, the inequality
∑ s (t ) ≥ x (t ) + s (t )
xi (t + 1) = xi (td ) −
ik
d
i j
d
ij
d
k ∈ Ai
is satisfied for ∀j : j ∈ Ai ∧ xi (td ) > x ij (td ) ∧ sij (td ) > 0 . If there are k nodes like j in the neighborhood, we have kxi (t + 1) ≥ ∑ xj∈(At i )> x i (t ) x ij (td ) + i
d
s ij (t d )> 0
m(td ) = min min xi (τ ) ,
Since
i
td − H < td − 3B < t p ≤ trji (td ) ≤ td
∑ s (t ) = x (t ) − x (t ik
d
i
d
and
t d − H 0 at time tlij (td ) . Then, we write τ d for the time that is the first element in Tdi after td . When td < τ d < t0 + nH , we have x j (trji (τ d )) = x ij (τ d ) ≥ m (t0 ) +
α 2
βτ
d
− t0
(xi (t0 ) − m(t0 )) .
Because of the above two cases, for any t ≥ t0 + nH , the load of j satisfies:
(
)
(x (t (τ )) − m(t (τ ))) ) (x (τ ) − m(t )) ji
x j (t ) ≥ m trji (τ d ) + β t − t r
≥ m(t0 ) + β
t − t rji
ji
≥ m(t0 ) + β t − t r
ji
≥ m(t0 ) + β t − t r
(τ d
(τ d )
j
i j
(τ d ) α
(τ d )+τ d − t 0
ji r
d
d
0
d
βτ
2
ji r
d
− t0
α 2
(x i (t0 ) − m(t0 ))
(x i (t0 ) − m(t0 ))
Since τ d − trji (τ d ) ≤ B , the above inequality becomes x j (t ) ≥ m (t0 ) +
αβ B 2
β t − t (x i (t0 ) − m (t0 )) 0
. Therefore inequality A.4 holds.
□
185
Lemma A.5. For any i, t0 , and any j, where the shortest distance from i to j is equal to l, and for any t ≥ t0 + nlH , we have l
αβ B t − t 0 x j (t ) ≥ m (t0 ) + β (xi (t0 ) − m (t0 )) 2
A.5
Proof. Lemma A.4 proves the inequality A.5 is true when l is 1. Then, we prove the inequality by induction over l. First, we assume that for a node j, the inequality exists in the case that the shortest distance from i to j is l. That is: l
αβ B nlH x j (t0 + nlH ) ≥ m (t0 ) + β ( xi (t0 ) − m (t0 )) 2 Then, for a node k, k ∈ A j , for any t, t ≥ t0 + nlH + nH ,
xk (t ) ≥ m(t0 + nlH ) + ≥ m(t0 ) +
αβ B
≥ m(t0 ) +
αβ B
≥ m(t0 ) +
αβ B
2 2 2
αβ B
β t −t
2 0
− nlH
β t − (t
0
(x (t j
+ nlH )
(x (t j
0
0
+ nlH ) − m(t0 + nlH ))
+ nlH ) − m(t0 )) l
β
t −t0
β
t −t0
αβ B nlH − nH (xi (t0 ) − m(t0 )) β 2 l
αβ B t − t0 β (xi (t0 ) − m(t0 )) 2
αβ B t − t0 ≥ m(t0 ) + β 2
l +1
(xi (t0 ) − m(t0 ))
Therefore, the inequality holds for node k. And inequality A.5 is proved.
□
Proposition A.1. For a load balancing algorithm with local synchronism as defined by Assumption A.1 and a decision algorithm satisfying the assumption Bert.2, the loads on nodes satisfy
186
∀i : lim xi (t ) = t →∞
L where L is the total load of the system, and n is the number of nodes in n
the system. We say that the load balancing algorithm converges.
Proof. According to Lemma A.5, if we choose l=n, for a node i, we have n
αβ B n 2 H + H (xi (t0 ) − m (t0 )) x j (t ) ≥ m(t0 ) + β 2
for ∀j, ∀t ∈ [t0 + n 2 H , t0 + n 2 H + H ] .
According to the definition of m(t ) (i.e. Definition A.1), we have n
αβ B n 2 H + H ( xi (t0 ) − m (t0 )) . m (t0 + n H + H ) ≥ m (t0 ) + β 2 2
n
αβ B n 2 H + H , such that β Then, there exists a factor δ = 2 m (t0 + n 2 H + H ) ≥ m(t0 ) + δ (xi (t0 ) − m (t0 ))
This inequality is also satisfied when node i is the heaviest loaded node at time t0 .
(
)
Therefore, for any t, the inequality m (t + n 2 H + H ) ≥ m(t ) + δ max xi (t ) − m(t ) holds. i
Since m(t ) converges, we have lim max xi (t ) − m (t ) = 0 . Therefore, ∀i : lim xi (t ) = t →∞
load balancing algorithm converges.
i
t →∞
L . The n
□
A.2.2. Assumptions A-1 and A-2 imply convergence We prove in this section that Assumption A.2 is stronger than the Assumption R-Bert-2. With the result of Section A.2.1, this proves that Assumption A-1 and A-2 imply convergence.
187
Lemma A.6. Condition A-2(a) implies condition R-Bert-2(a).
Proof. For any i, any pair of t p ∈ Tpi and td ∈ Tdi , when node i decides load transfers
∑s
ik
(td ) > 0 at time td by using Assumption A-2(a), then, xi (td ) > x Ai (td ) . Also, for the
k ∈ Ai
least loaded neighbor j x ij (td ) = min xki (td ) , the inequality xi (td ) > x ij (td ) is satisfied. k ∈ Ai
Therefore, in the case that the decision algorithm is defined by Assumption R-Bert-2(a), node i still decides load transfers
∑s
ik
(td ) > 0 in the same situation (the same neighbors
k ∈ Ai
and the same workloads on them). But, the decision algorithm defined by A-2 may not decide load transfers in a case where the algorithm defined by R-Bert-2 may. For example, we assume this is the case where, for node i, and td ∈ Tdi , xi (td ) > x ij (td ) holds for the least loaded neighbor x ij (td ) = min xki (td ) , but xi (td ) ≤ x Ai (td ) . This case satisfies k ∈ Ai
Assumption R-Bert-2(a) instead of A-2 for deciding a load transfer. Therefore, A-2(a) is stronger than R-Bert-2(a).
□
Lemma A.7: Condition A-2(b) implies condition R-Bert-2(b).
Proof. For a node i, Tpi and Tdi are the sets of times of the beginning and ending of load balancing operations that decide load transfers (that is,
∑s
ik
(td ) > 0 ).
k ∈ Ai
According to condition A-2(b),
∑α (t ) = 1 . Therefore, ∑ s (t ij
k ∈ Ai
the inequality xi (td ) −
∑ s (t ij
j∈ Ai
d
ij
d
) = xi (td ) − x Ai (td ) , and
j∈ Ai
∑ x (t i j
d
) ≥ x Ai (td ) hold where x Ai (td ) =
j∈ Ai
Ai
d
) (defined in A-
2(a)). 188
According to A-2(a), the inequality:
xi (td ) − x Ai (td ) ≤ ∑l∈i Ai ;
x l (t d )> x Ai (t d
)
(x (t ) − x (t )) = ∑ i l
d
Ai
d
l ∈ Ai ; x li (t d )< x Ai (t d
)
(x (t ) − x (t )) Ai
i l
d
d
holds for all j ∈ Ai that satisfy x ij (td ) < x Ai (td ) . Therefore we have
x ij (td ) + sij (td ) = x ij (td ) + α ij (td )( xi (td ) − x Ai (td )) = x (td ) + i j
≤ x ij (td ) +
∑ ∑
x Ai (td ) − x ij (td ) l ∈ Ai ; x li (t d )< x Ai (t d
() x (t ) − x (t )) (x (t ) − x (t )) Ai
i j
d
i
x Ai (td ) − x ij (td ) l ∈ Ai ; x li (t d )< x Ai (t d
(x (t ) − x (t )) ∑ ) Ai
i j
d
d
Ai
d
d
d
l ∈ Ai ; x li (t d )> x Ai ( t d
)
(x (t ) − x (t )) i j
d
Ai
d
≤ x ij (td ) + x Ai (td ) − x ij (td ) = x Ai (td ) And finally, we have xi (td ) −
∑ s (t ) ≥ x (t ) ≥ x (t ) + s (t ) . ik
d
Ai
d
i j
d
ij
d
This shows that
k ∈ Ai
condition R-Bert-(b) is satisfied.
□
Therefore, the algorithm defined by assumptions A-1 and A-2 converges.
189
Appendix B Table B. 1 The effectiveness of the scheme in systems with various numbers of clusters when moving nodes with homogeneous capacity, systems without churn, and D=8 c=128
c=256
Standard deviation of available capacities
Mean
Maximum difference of available capacities
Mean
1.338
95% C.I
0.010
r1
Mean
0.081
r2
Mean
95% C.I
95% C.I 95% C.I Proportion of nodes moved
Mean 95% C.I
c=512
c=1024
0.211
0.217
0.210
0.211
0.0026
0.0049
0.0032
0.0024
1.426
1.421
1.502
0.0748
0.0730
0.070
0.075
0.074
0.074
0.0002
0.0019
0.0010
0.0008
0.899
0.994
0.987
0.989
0.0129
0.0039
0.0060
0.0033
6.628
5.712
5.986
6.113
0.1430
0.1278
0.1044
0.0728
Table B. 2 The load variance and the normalize load variance of the systems with different workload factors Churn=0.1 Average workload on nodes Split (%)
2.5 Mean 95% CI
Merge (%)
mean 95% CI
Proportion of nodes moved (%)
mean
5
Churn=0.9 7.5
2.5
5
7.5
0.121
0.084
0.096
0.533
0.603
0.584
0.0411
0.0400
0.0317
0.0766
0.0771
0.0740
0.016
0.016
0.014
0.437
0.508
0.493
0.0125
0.0147
0.0143
0.0633
0.0577
0.0762
3.450
3.426
3.445
19.828
19.799
19.841
95% CI
0.0690
0.0580
0.0688
0.1260
0.1344
0.1352
Standard deviation of available capacities
mean
0.1505
0.298
0.441
0.292
0.5899
0.883
95% CI
0.0018
0.0032
0.0048
0.004
0.0086
0.0106
Standard deviation of normalized available capacities
mean
0.060
0.0591
0.0585
0.116
0.117
0.117
0.0007
0.0006
0.0006
0.0016
0.0017
0.0014
95% CI
190
Table B. 3 The effectiveness of the diffusive load balancing in systems with node capacities equal to 10 and 20 requests/second, respectively, C=1024, D=8 (a) system without churn c=10 Standard deviation of available capacities
Mean 95% C.I
Maximum difference of available capacities
Mean 95% C.I Mean
r1
95% C.I Mean
r2
95% C.I Mean
Proportion of nodes moved
95% C.I
c=20
0.211
0.417
0.0024
0.0034
1.502
2.824
0.0701
0.1256
0.074
0.074
0.0008
0.0004
0.989
0.988
0.0033
0.0036
6.113
6.048
0.0728
0.0534
(b) in a system with churn rate of 0.1 or 0.9, average workload of nodes is 5 requests/second Churn=0.1 c=10 Mean
Split (%)
95% CI Mean
Merge (%)
95% CI Proportion of nodes moved
Mean 95% CI
Standard deviation of available capacities
Mean
Standard deviation of normalized available capacities
Mean
95% CI 95% CI
Churn=0.9
c=20
c=10
c=20
0.084
0.105
0.603
0.560
0.0400
0.0485
0.0771
0.0810
0.016
0.007
0.508
0.468
0.0147
0.0090
0.0580
0.0710
3.426
3.496
19.799
19.946
0.0580
0.0569
0.1344
0.1297
0.298
0.294
0.589
0.589
0.0032
0.0028
0.0086
0.0068
0.059
0.0585
0.117
0.117
0.0006
0.0005
0.0017
0.0014
Table B. 4 The convergence of the scheme in the systems where node capacities follow a Pareto distribution Pareto Standard deviation of available capacities Maximum difference of available capacities r1
28.50005
Pareto, virtual node 2.956524
265.9245
65.39656
0.461558
0.065586
r2
0.971683
0.943207
Proportion of nodes moved
38.79747
34.91807
191
Reference: [Asaduzzaman2008]: S. Asaduzzaman, Y. Qiao, G. v Bochmann, "CliqueStream: An Efficient and Fault-Resilient Live Streaming Network on a Clustered Peer-to-Peer Overlay," in Proceeding of Eighth International Conference on Peer-to-Peer Computing (P2P), 2008, pp.269-278 [Asaduzzaman2010]: S. Asaduzzaman, Y. Qiao and G. v. Bochmann, “CliqueStream: Creating an efficient and resilient transport overlay for peer-to-peer live streaming using a clustered DHT,” Journal on Peer-to-Peer Networking and Applications, Vol. 3, Issue 2 (2010), pp. 100-113, Springer [Aspnes2002]: J. Aspnes, Z. Diamadi, and G. Shah, “Fault-tolerant routing in peer-topeer systems,” in Proceedings of the Twenty-First Annual Symposium on Principles of Distributed Computing, Monterey, California, July 21 - 24, 2002 [Bertsekas1997]: D.P. Bertsekas and J.N. Tsitsiklis. Parallel and distributed computation: Numerical Methods, Englewood Cliffs, NJ, 1997 [Bhagwan2002]: R. Bhagwan, S. Savage, and G. Voelker, “Understanding availability,” in Proceedings of the 2nd International Workshop on Peer-to-peer Systems, Berkeley, CA, December 2002. [Bharambe2004]: A. R. Bharambe, M. Agrawal, and S. Seshan, “Mercury: supporting scalable multi-attribute range queries,” In Proceedings of the 2004 Conference on Applications, Technologies, Architectures, and Protocols For Computer Communication. SIGCOMM '04. ACM, New York, NY. [Bochmann2007] G. v. Bochmann and G. V. Jourdan, “An overview of content distribution and content access in peer-to-peer systems (invited paper)”, in Proceeding of NOTERE Conference, Marakech (Maroco), June 2007. [Boillat1990] J. E. Boillat. Load balancing and Poisson equation in a graph. Concurrency and Computation: Practice and Experience 2, 4, Nov. 1990, 289-313. [Bolch1998]: G. Bolch, S. Greiner, H. de Meer, K. S. Trivedi, “Queueing Networks and Markov Chains: modelling and performance evaluation with computer science applications.” John Wiley and Sons, 1998 [Byers2003]: J. Byers, J. Considine, and M. Mitzenmacher. “Simple Load Balancing for Distributed Hash Tables,” In Proceedings of the 2nd International Workshop on Peer-toPeer Systems (IPTPS '03), February 2003.
192
[Cao2004]: J. Cao, X. Wang, and S. K. Das, “A framework of using cooperating mobile agents to achieve load sharing in distributed web server groups,” Future Generation Computer SystemsVolume 20, Issue 4, Advanced services for Clusters and Internet computing, 3 May 2004, Pages 591-603. [Cardellini2003]: V. Cardellini, M. Colajanni, and P. S. Yu. “Request redirection algorithms for distributed web systems,” IEEE Trans.Parallel Distrib. Syst., vol. 14, no. 4, pp. 355–368, 2003. [Casavant1988]: T.L. Casavant, J.G. Kuhl, "A taxonomy of scheduling in generalpurpose distributed computing systems," IEEE Transactions on Software Engineering, vol. 14, no. 2, pp. 141-154, Feb., 1988 [Castro2003]: M. Castro, P. Druschel, A. Kermarrec, A. Nandi, and A. Rowstron, A. Singh. “SplitStream: high-bandwidth multicast in cooperative environments,” In Proceedings of the Nineteenth ACM Symposium on Operating Systems Principles, SOSP '03. Bolton Landing, NY, USA, October 19 - 22, 2003. [Castro2005]: M. Castro, M. Costa, and A. Rowston, “Debunk some myths about structured and unstructured overlay,” in the Proceeding of 2nd Symposium on Networked Systems Design & Implementation, NSDI’05, 2005. [Cavendish2010]: D. Cavendish, H. Koide, Y. Oie, and M. Gerla. 2010. A Mean Value Analysis approach to transaction performance evaluation of multi-server systems. Concurr. Comput. : Pract. Exper. 2010, 1267-1285 [Cedo2007]: F. Cedo, A. Cortes, A. Ripoll, M. A. Senar, and E. Luque. The Convergence of Realistic Distributed Load-Balancing Algorithms. Theory of Computing Systems 41, 4, December 2007, 609-618. [Chen2005]: X. Chen, S. Ren, H. Wang, X. Zhang, "SCOPE: scalable consistency maintenance in structured P2P systems," INFOCOM 2005. 24th Annual Joint Conference of the IEEE Computer and Communications Societies. Proceedings IEEE , vol. 3, pp. 1502-1513, 13-17 March 2005 [Chu2002]: J. Chu, K. Labonte, and B. Levine, “Availability and locality measurements of peer-to-peer file systems,” in Proceedings of ITCom: Scalability and Traffic Controlin IP Networks, July 2002. [Corradi1999]: A. Corradi, L. Leonardi, and F. Zambonelli. Diffusive Load-Balancing Policies for Dynamic Applications. IEEE Concurrency 7, 1, Jan. 1999, 22-31. [Cortes2002]: A. Cortés, A. Ripoll, F. Cedó, M. A. Senar, and E. Luque. An asynchronous and iterative load balancing algorithm for discrete load model. J. Parallel Distrib. Comput. 62, 12, Dec. 2002, 1729-1746.
193
[Cybenko1989]: G. Cybenko. Dynamic load balancing for distributed memory multiprocessors. J. Parallel Distrib. Comput. 7, 2, Oct. 1989, 279-301. [Dabek2001]: F. Dabek, F. Kaashoek, D. Karger, R. Morris, and I. Stoica, “Wide-area cooperative storage with CFS,” in Proc. ACM SOSP’01, Banff, Canada, 2001. [Dandamudi1997]: S. P. Dandamudi, and K. C. Lo, “A Hierarchical Load Sharing Policy for Distributed Systems,” in Proceedings of the 5th international Workshop on Modeling, Analysis, and Simulation of Computer and Telecommunications Systems, MASCOTS. IEEE Computer Society, Washington, DC, 1997 [Diekmann1997]: R. Diekmann, S. Muthukrishnan, and M. V. Nayakkankuppam. Engineering Diffusive Load Balancing Algorithms Using Experiments. In Proceedings of the 4th International Symposium on Solving Irregularly Structured Problems in Parallel (IRREGULAR '97), Gianfranco Bilardi, Afonso Ferreira, Reinhard Springer-Verlag, London, UK, 111-122, 1997 [Eager1986a]: D. L. Eager, E. D. Lazowska, and J. Zahorjan, “Adaptive load sharing in homogeneous distributed systems,” IEEE Transaction of Software Engineering 12, 5, pp 662-675, May, 1986 [Eager1986b]: D. L. Eager, E. D. Lazowska, and J. Zahorjan, “A comparison of receiverinitiated and sender-initiated adaptive load sharing,” SIGMETRICS Performance Evaluation Review 13, 2, Aug. 1986 [Elsasser2002]: R. Elsasser, B. Monien, R. Preis, Diffusion schemes for load balancing on heterogeneous networks, Theory Comput. Systems 35, 2002, 305–320. [Elsasser2004]: R. Elsasser, B. Monien, S. Schamberger. Load Balancing in Dynamic Networks, in Proceeding of 7th International Symposium on Parallel Architectures, Algorithms and Networking, 2004 [Ferrari1986]: D. Ferrari, and S. Zhou, “A load index for dynamic load balancing,” in Proceedings of 1986 ACM Fall Joint Computer Conference IEEE Computer Society Press, Los Alamitos, CA, pp. 684-690, 1986 [Fessant2004]: F. L. Fessant, S. Handurukande, A.M. Kermarrec, and L. Massoulie, “Clustering in peer-to-peer file sharing workloads,” in IPTPS’04 Feb. 2004. [Flocchini2007]: P. Flocchini, A. Nayak, M. Xie, “Enhancing peer-to-peer systems through redundancy,” IEEE Journal on Selected Areas in Communications, vol.25, no.1, pp.15-24, Jan. 2007 [Ganesan2004]: P. Ganesan, B. Mayank, and H. Garcia-Molina. “Online Balancing of Range-Partitioned Data with Applications to Peer-to-Peer Systems,” in VLDB, 2004.
194
[Garofalakis2009]: J. Garofalakis, T. "Load Balancing in a Cluster-Based P2P System," in Proceeding of 2009 Fourth Balkan Conference in Informatics, 2009, pp.133-138 [Godfrey2004]: B. Godfrey, K. Lakshminarayanan, S. Surana, R. Karp, and I. Stoica, “Load balancing in dynamic structured P2P systems,” INFOCOM 2004. Twenty-third Annual Joint Conference of the IEEE Computer and Communications Societies, pp. 2253-2262, vol.4, 7-11 March 2004 [Godfrey2006]: P. B. Godfrey, S. Shenker, and I. Stoica, “Minimizing churn in distributed systems,” in Proceedings of the 2006 Conference on Applications, Technologies, Architectures, and Protocols For Computer Communication, SIGCOMM '06. Pisa, Italy, September 11 - 15, 2006 [Guerraoui2006]: R. Guerraoui, S. B. Handurukande, K. Huguenin, A.-M. Kermarrec, Fabrice Le Fessant, E. Riviere, "GosSkip, an Efficient, Fault-Tolerant and Self Organizing Overlay Using Gossip-based Construction and Skip-Lists Principles," in Proceeding of Sixth IEEE International Conference on Peer-to-Peer Computing (P2P'06), pp. 12-22, 2006 [Gummadi2003]: K. Gummadi, R. Dunn, S. Saroiu, S. Gribble, H. Levy, and J. Zahorjan. “Measurement, modeling, and analysis of a peer-to-peer file-sharing workload,” in 19-th ACM Symposium on Operating Systems Principles, Bolton Landing, NY, USA, 2003 [Hui1996]: C. C. Hui. A Hydro - Dynamic Approach to Heterogeneous Dynamic Load Balancing in a Network of Computers. In Proceedings of ICPP, 1996, IEEE Computer Society, Washington, DC. [Jain1991]: R. Jain, “The Art of Computer Systems Performance Analysis,” 1991, John Wiley & Sons, New York [Karger1997]: D. Karger, E. Lehman, T. Leighton, R. Panigrahy, M. Levine, and D. Lewin. “Consistent hashing and random trees: distributed caching protocols for relieving hot spots on the World Wide Web,” In Proceedings of the Twenty-Ninth Annual ACM Symposium on theory of Computing, STOC '97. ACM, New York, NY, pp. 654-663, 1997 [Kaashoek2003]: F. Kaashoek and D. R. Karger, “Koorde: A Simple Degree-optimal Hash Table.” In Proceedings of the 2nd International Workshop on Peer-to-Peer Systems (IPTPS03), 2003. [Kremien1992]: O. Kremien, J. Kramer, "Methodical Analysis of Adaptive Load Sharing Algorithms," IEEE Transactions on Parallel and Distributed Systems, vol. 03, no. 6, pp. 747-760, Nov., 1992 [Kremien1993]: O. Kremien, J. Kramer and J. Magee. Scalable, “Adaptive Load Sharing for Distributed Systems,” IEEE Parallel and Distributed Technology, vol. 01, no. 3, pp. 62-70, Aug., 1993 195
[Krishnamurthy2001]: B. Krishnamurthy, J. Wang, and Y. Xie, “Early measurements of a cluster-based architecture for P2P systems,” In Proceedings of the 1st ACM SIGCOMM Workshop on internet Measurement (San Francisco, California, USA, November 01 - 02, 2001). [Kunz1991]: T. Kunz, “The Influence of Different Workload Descriptions on a Heuristic Load Balancing Scheme,” IEEE Transactions on Software Engineering, vol. 17, no. 7, pp. 725-730, Jul., 1991 [Ledlie2005]: J. Ledlie, M. Seltzer, “Distributed, secure load balancing with skew, heterogeneity and churn,” in Proceedings of INFOCOM 2005. 24th Annual Joint Conference of the IEEE Computer and Communications Societies. vol.2, no., pp. 14191430 vol. 2, 13-17 March 2005 [Leinberger2000]: W. Leinberger, G. Karypis, V. Kumar, R. Biswas, “Load balancing across near-homogeneous multi-resource servers,” Heterogeneous Computing Workshop, (HCW 2000) Proceedings. 9th , pp.60-71, 2000 [Li2004] J. Li, J. Stribling, T. M. Gil, R. Morris, and F. Kaashoek, “Comparing the performance of distributed hash tables under churn,” in IPTPS, February 2004 [Li2005]: J. Li, J. Stribling, R. Morris, M. F. Kaashoek, and T. M. Gil, “A performance vs. cost framework for evaluating DHT design tradeoffs under churn,” in Proceedings of the 24th INFOCOM, Mar. 2005 [Li2006]: M. Li, W.-C. Lee, A. Sivasubramaniam, "DPTree: A Balanced Tree Based Indexing Framework for Peer-to-Peer Systems," Network Protocols. ICNP '06. Proceedings of the 2006 14th IEEE International Conference on, pp.12-21, 12-15 Nov. 2006 [Li2007]: Z. Li; G. Xie; Z. Ch. Li, "Locality-Aware Consistency Maintenance for Heterogeneous P2P Systems," Parallel and Distributed Processing Symposium, IPDPS 2007. IEEE International , pp.1-10, 26-30 March 2007 [Liang2006]: J. Liang, R. Kumar, and K. W. Ross, “The FastTrack overlay: A measurement study,” Computer Networks: The International Journal of Computer and Telecommunications Networking, 50, 2006, pp. 842-858 [Liang2007]: C. Liang, Y. Guo, and Y. Liu, "Hierarchically Clustered P2P Streaming System," Global Telecommunications Conference, GLOBECOM '07. IEEE , Pages 236241, 26-30 Nov. 2007 [Liben-Nowell2002]: D. Liben-Nowell, H. Balakrishnan, and D. Karger, “Observations on the dynamic evolution of peer-to-peer networks,” in Proceedings of the First
196
International Workshop on Peer-to-Peer Systems (IPTPS ’02), Cambridge, MA, March 2002 [Liu2006]: X. Liu, J. Lan, P. Shenoy, and K. Ramaritham, “Consistency maintenance in dynamic peer-to-peer overlay networks,” Computer Networks: The International Journal of Computer and Telecommunications Networking. Vol. 50, Iss. 6, Apr. 2006, pp. 859876. [Livny1982]: M. Livny, M. Melman, “Load balancing in homogeneous broadcast distributed systems,” in Proceedings of the Computer Network Performance Symposium ACM, New York, NY, 47-55, 1982 [Lloret2006]: J. Lloret, J. R. Diaz, J. M. Jimenez, F. Boronat. “Public Domain P2P Filesharing Networks Measurements and Modeling,” in Proceedings of International Conference on Internet Surveillance and Protection, ICISP '06, 2006. [Lo1996]: M. Lo and S. Dandamudi, “Performance of Hierarchical Load Sharing in Heterogeneous Distributed Systems,” in Proceedings of International Conference on Parallel and Distributed Computing Systems, Dijon, France, 1996 [Locher2006]: T. Locher, S. Schmid, R. Wattenhofer, "eQuus: A Provably Robust and Locality-Aware Peer-to-Peer System," p2p, pp. 3-11, Sixth IEEE International Conference on Peer-to-Peer Computing (P2P'06), 2006 [Lv2002]: Q. Lv, P. Cao, E. Cohen, K. Li, and S. Shenker, “Search and Replication in Unstructured Peer-to-Peer Networks,” in Proceedings of 16th ACM International Conference on Supercomputing(ICS’02). New York, NY, June 2002. [Malkhi2002]: D. Malkhi, M. Naor, and D. Ratajczak, “Viceroy: a scalable and dynamic emulation of the butterfly.” In Proceedings of the Twenty-First Annual Symposium on Principles of Distributed Computing (Monterey, California, July 21 - 24, 2002). PODC '02. pp. 183-192. [Mohamed-Salem2003]: M.-V. Mohamed-Salem, G. v. Bochmann, and J. W. Wong, “Wide-area server selection using a multi-broker architecture,” in Proceedings of International Workshop on New Advances of Web Server and Proxy Technologies. Providence, USA, May 19, 2003. [Oram2000]: A. Oram. “Gnutella and Freenet Represent True Technological Innovation,” Whitpaper, 2000. [Pugh1990]: Pugh, W. Skip lists: a probabilistic alternative to balanced trees. Commun. ACM 33, 6, Jun. 1990, 668-676
197
[Qiao2009A]: Y. Qiao and G. v. Bochmann. “Applying a diffusive load balancing in a clustered P2P system” In Proceeding of 9th Intern. Conf. on New Technologies of Distributed Systems (NOTERE), Montreal, Canada, 2009, pp. 189-199 [Qiao2009B]: Y. Qiao and G. v. Bochmann. "A Diffusive Load Balancing Scheme for Clustered Peer-to-Peer Systems," In Proceeding of 15th International Conference on Parallel and Distributed Systems (ICPADS’09), 2009, pp.842-847 [Qiao2010]: Y. Qiao, S. Asaduzzaman, and G. V. Bochmann. “Peer-to-Peer Platforms for High-Quality Web Services: The Case for Load-Balanced Clustered Peer-to-Peer Systems”. In Ragab, K., Helmy, T., & Hassanien, A. (Eds.), Developing Advanced Web Services through P2P Computing and Autonomous Agents: Trends and Innovations. (pp. 158-177). [Qiao2011]: Y. Qiao and G. v. Bochmann. “Using Diffusive Load Balancing to Improve Performance of Peer-to-Peer Systems for Hosting Services.” In C. Isabelle, C, Alva, B. RÃmi, W. Martin, (Eds.) Managing the Dynamics of Networks and Services, Lecture Notes in Computer Science, (pp.124-135) [Qiao2012]: Y. Qiao, G. v. Bochmann. “Load balancing in a peer-to-peer system by using a diffusive approach,” In Extreme distributed systems: from large scale to complexity, the special issue of Springer Computing (accepted with revision). [Rao2003]: A. Rao, K. Lakshminarayanan, S. Surana, R. Karp, and I. Stoica. “Load Balancing in Structured P2P Systems,” In Proceeding of 2nd International Workshop on Peer-to-Peer Systems (IPTPS '03), 2003 [Ratnasamy2001] S. Ratnasamy, P. Francis, M. Handley, R. Karp and S. Shenker. A scalable content-addressable network. In Proceedings of the 2001 Conference on Applications, Technologies, Architectures, and Protocols For Computer Communications. SIGCOMM '01. ACM, New York, pp. 161-172, 2001 [Rhea2004]: S. Rhea, D. Geels, T. Roscoe, and J. Kubiatowicz. “Handling churn in a DHT.” In Proceeding of USENIX Technical Conference, June 2004. [Song1994]: Song, J. 1994. A partially asynchronous and iterative algorithm for distributed load balancing. Parallel Comput. 20, 6 (Jun. 1994), 853-868. [Roussopoulos2006]: M. Roussopoulos and M. Baker, “Practical load balancing for content requests in peer-to-peer networks,” Distributed Computing, vol. 18, num. 6, 2006. [Rowstron2001]: A. Rowstron, P. Druschel. “Pastry: Scalable, distributed object location and routing for large-scale peer-to-peer systems,” in Middleware, LNCS 2218, pp.329350, 2001.
198
[Saletore1990]: V.A. Saletore. A distributed and adaptive dynamic load balancing scheme for parallel processing of medium-grain tasks. In Proceeding of Fifth Distributed Memory Computing Conference, Apr. 1990. pp. 995-999 [Saroiu2002]: S. Saroiu, P. K. Gummadi, S. D. Gribble. “A measurement study of peerto-peer file sharing systems,” Technical Report UW-CSE-01-06-02, Department of Computer Science & Engineering, University of Washington, 2002. [Saroiu2003]: S. Saroiu, P. K. Gummadi, S. D. Gribble. “Measuring and analyzing the characteristics of Napster and Gnutella hosts,” in Multimedia Systems Journal 9, August, 2003, 170–184. [Shen2006]: H. Shen, C.Z. Xu, and G. Chen. Cycloid: a constant-degree and lookupefficient P2P overlay network. Performance Evaluation 63, 3 (March 2006), 195-216. [Shen2007] H. Shen, and C. Xu. Locality-Aware and Churn-Resilient Load-Balancing Algorithms in Structured Peer-to-Peer Networks. IEEE Transactions on. Parallel Distributed Systems. 18, 6 (June 2007), 849-862. [Shivaratri1990]: N. G. Shivaratri, P. Krueger, “Two adaptive location policies for global scheduling algorithms,” Distributed Computing Systems, 1990. Proceedings., 10th International Conference on, pp.502-509, May. 1990 [Shivaratri1992]: N. G. Shivaratri, P. Krueger, M. Singhal, “Load distributing for locally distributed systems,” Computer, vol.25, no.12, pp.33-44, Dec 1992 [Singla2001]: A. Singla, C. Rohrs, “Ultrapeers: Another Step Towards Gnutella Scalability,” Whitepaper, 2001. [Slyck2007]: http://www.slyck.com, 2007. [Stankovic1985]: J.A. Stankovic, “Stability and Distributed Scheduling Algorithms,” IEEE Transactions on Software Engineering, vol. 11, no. 10, pp. 11411152, Oct., 1985 [Stoica2001]: I. Stoica, R. Morris, D. Karger, F. Kaashoek, H. Balakrishnan, “Chord: A Scalable Peer-to-Peer Lookup Service for Internet Applications,” In Proceedings ACM Sigcomm 2001, San Diego, CA, Aug. 2001. [Stutzbach2005]: D. Stutzbach, R. Rejaie, S. Sen, “Characterizing Unstructured Overlay Topologies in Modern P2P File-Sharing Systems,” in ACM IMC, Oct. 2005. [Stutzbach2006]: D. Stutzbach, R. Rejaie, “Understanding churn in peer-to-peer networks,” in Proceedings of the 6th ACM SIGCOMM Conference on internet Measurement, IMC '06, Rio de Janeriro, Brazil, October 25 - 27, 2006.
199
[Surana2006]: S. Surana, B. Godfrey, K. Lakshminarayanan, R. Karp, and I. Stoica, “Load balancing in dynamic structured peer-to-peer systems,” Performance EvaluationVolume 63, Issue 3, , P2P Computing Systems, March 2006, Pages 217-240. [Triantafillou2003]: P. Triantafillou, C. Xiruhaki, M. Koubarakis and N. Ntarmos. “Towards High Performance Peer-to-Peer Content and Resource Sharing Systems,” in Proceeding Of CIDR, 2003. [Tsoumakos2006]: D. Tsoumakos, and N. Roussopoulos, “Analysis and comparison of P2P search methods,” in ACM 1st International Conference on Scalable Information Systems, Hong Kong, China, May 2006 [Tutschku2004]: K.Tutschku. A Measurement-based Traffic Profile of the eDonkey Filesharing Service. In Passive and Active Network Measurement, 2004, Springer Berlin/Heidelberg [Vu2007] L. Vu, I. Gupta, J. Liang, and K. Nahrstedt. Measurement of a large-scale overlay for multimedia streaming. In Proceedings of the 16th international symposium on High performance distributed computing (HPDC '07). ACM, New York, NY, USA, 241242, 2007 [Vu2009] Q. H. Vu, B. C. Ooi, M. Rinard, and K. Tan. Histogram-Based Global Load Balancing in Structured Peer-to-Peer Systems. IEEE Trans. on Knowl. and Data Eng. 21, 4, Apr. 2009, 595-608. [Wang1985]: Y. T. Wang, and R.J.T Morris, “Load Sharing in Distributed Systems,” IEEE Transactions on Computers, vol.C-34, no.3, pp.204-217, March 1985 [Willebeek-leMair1993]: M. H. Willebeek-LeMair and A. P. Reeves. Strategies for Dynamic Load Balancing on Highly Parallel Computers. IEEE Trans. Parallel Distrib. Syst. 4, 9 (September 1993), 979-993. [Xu1997] Xu, C. and Lau, F. C. Load Balancing in Parallel Computers: Theory and Practice. Kluwer Academic Publishers. [Yang2007]: X. Yang, Y. Hu. Search Enhanced by Distributed Semantic Clustering in Gnutella-like P2P Systems. 15th International Symposium on Modeling, Analysis, and Simulation of Computer and Telecommunication Systems, mascots, pp.318-324, 2007 [Yu2008]: J. Yu, and M. Li, “A proximity-aware peer clustering system in large-scale BitTorrent-like peer-to-peer networks,” Computer Communications, Volume 31, Issue 3, Special Issue: Disruptive networking with peer-to-peer systems, 25 February 2008, Pages 591-602
200
[Zaki1996]: M.J. Zaki, Wei Li, S. Parthasarathy, "Customized dynamic load balancing for a network of workstations," Fifh IEEE International Symposium on High Performance Distributed Computing (HPDC-5 '96), p. 282, 1996 [Zhao2003]: B.Y. Zhao, L. Huang, J. Stribling, A.D. Joseph, J.D. Kubiatowicz, “Exploiting routing redundancy via structured peer-to-peer overlays,” In Proceedings. 11th IEEE International Conference on Network Protocols, 2003, vol., no., pp. 246-257, 4-7 Nov. 2003 [Zhao2004] B. Y. Zhao, L. Huang, J. Stribling, S. C. Rhea, A. D. Joseph, J. D. Kubiatowicz, “Tapestry: A resilient global-scale overlay for service deployment,” IEEE JSAC, 22(1):41–53, Jan. 2004 [Zhao2006]: S. Zhao, D. Stutzbach, R. Rejaie, “Characterizing Files in the Modern Gnutella Network: A Measurement Study,” in Multimedia Computing and Networking, 2006. [Zhong2008]: Zhong, M., Shen, K., and Seiferas, J. The Convergence-Guaranteed Random Walk and Its Applications in Peer-to-Peer Networks. IEEE Trans. Comput. 57, 5 (May. 2008), 619-633. [Zhou1988]: S. Zhou, “A Trace-Driven Simulation Study of Dynamic Load Balancing,” IEEE Transactions on Software Engineering, vol. 14, no. 9, pp. 13271341, Sept., 1988 [Zhou1993]: S. Zhou, X. Zheng, J. Wang, and P. Delisle. “Utopia: a load sharing facility for large, heterogeneous distributed computer systems,” Software-Practice and Experience. 23, 12, Dec. 1993, pp. 1305-1336. [Zhu1998]: H. Zhu, T. Yang, Q. Zhang, D. Watso, O.H. Ibarra, T. Smith, “Adaptive load sharing for clustered digital library Services”. In Proceedings of 7th IEEE HPDC, 1998 [Zhu2005]: Y. Zhu, Y. Hu. “Efficient, proximity-aware load balancing for DHT-based P2P systems,” IEEE Transactions on Parallel and Distributed Systems, vol.16, no.4, pp. 349-361, April 2005
201