USING A FINE-GRAINED COMPARATIVE EVALUATION TECHNIQUE TO UNDERSTAND AND DESIGN SOFTWARE VISUALIZATION TOOLS Paul Mulhlland
Knowledge Media Institute The Open University Walton Hall Milton Keynes, UK MK7 6AA -1-441908 654506
[email protected] KEYWORDS: evaluation, design, Software Visualization, software comprehension, Prolog. ABSTRACT
Software Visualization can be defined as the use of graphical and textual formalisms to describe the execution of computer programs. A large amount of Software Visualization technology has been developed to support computer science education, using a range of interface techniques. Far less effort has been devoted to evaluating the technology. As a result, it is unclear how effective Software Visualization tools are, either for students or professional programmers. Even more worrying, it is doubtful whether lessons are being learnt in successive designs of Software Visualization tools, or whether the application of new technologies (e.g. 3D animation and the intemet) has become the primary goal, rather than the true goal of making computer programs easier to understand. To counter this problem the study reported here used protocol analysis to develop a fine-grained account of user behaviour, identifying (i) information access from the display, (ii) the use of comprehension strategies, and (iii) misunderstandings of the visualization and execution. The results were able to motivate future deigns which in turn could be compared and improved. The approach is compared to other evaluation techniques which aim to inform design. Finally, the generalizability of the approach is considered. 1.
INTRODUCTION
This paper presents a framework for the principled evaluation and design of Software Visualization (SV) technology. SV is the process of using techniques such as typography, graphic design, animation and cinematography to provide representations of a program and its execution. Though a great deal of research effort is being devoted to SV development, SVs are still not widely used in practice, either by professional programmers or within computer programming education. Price, Small and Baecker (1993) argue an important reason why the technology has not been readily taken up is because its benefits have not been clearly demonstrated. Allied to this, is the uncertainty as to whether SV technology is improving, by learning lessons from earlier systems and using these lessons to motivate designs of the future. The SV field is certainly progressing technologically, though whether it is progressing from a cognitive or educational perspective is unclear. There have been a few empirical evaluations of SV technology. These have generally been coarsegrained, measuring how quickly or successfully certain tasks can be carried out with various SVs. These studies can provide estimates as to which SV “is best” for certain tasks or users but tell us little about “why”. This paper reports on the development and application of a new methodology. The methodology uses protocol analysis (Ericsson and Simon, 1984) to gain cognitive evidence as to how SVs are used and understood. Previous research in the psychology of programming can be used to determine the types of cognitive evidence we can expect to identify within the protocols of subjects using a SV. SVs are intended to support the programmer in the tasks of program comprehension and debugging. Empirical investigations of program comprehension and debugging
91 ,
suggest the kinds of cognitive evidence that we can hope to derive about how the nature of the SV affects the ways in which it is used and understood. This cognitive evidence is divided into three broad categories, describing the three main ways in which the SV may impact on the cognition of the user: the access of information, the utilisation of strategies to support the comprehension of information, and misunderstandings that arise while using the SV. These categories guide the analysis of the verbal protocols derived from the study. The empirical study shows how this fine-grained evaluation methodology can be used to find out how well an environment rates on each of these criteria. This provides the kind of data necessary for overall performance differences between SVs to be confidently interpreted. The results of the fine-grained evaluation are used to motivate the design of a new SV which was found to be more suitable for a novice population than those previously evaluated. Overall, the process illustrates how lessons can be learnt rather than lost as SV technology progresses apace. As the methodology draws heavily on the psychology of programming literature, a programming language was chosen which has been intensively studied. It was also important that a number of SVs existed for the programming language, which could be realistically evaluated. Prolog was therefore chosen as the language. A great deal of research has considered how it is used (Taylor, 1988) and the conceptual difficulties students have encountered (Fung, Brayshaw, du Boulay and Elsom-Cook, 1990). Also, a number of SVs have been developed for the Prolog language. Four were analysed in this research. Before presenting the evaluation and design process, some related studies will be reviewed and then used to motivate the new approach. Following this, an overview of the evaluation and design process will be given. The case-study is then presented in five parts. First the SV test-bed is presented. Second, this test-bed is evaluated using a fine-grained methodology incorporating protocol analysis. Third, the results are interpreted in order to make the mapping between the features of the SV and their cognitive effects. Fourth, the interpretation is used to design a new SV. The final section of the case-study presents an evaluation of the new design. The final sections of the paper compare the approach to other evaluation techniques and consider its generalizability. 2.
COARSE-GRAINED
STUDIES
ARE NOT INFORMATIVE
There have been a few evaluation studies attempting to determine the benefits of Software Visualization systems. On the whole these have been of two main types: finding out whether using a particular SV is better than no additional intervention; or a direct comparison between a number of SVs for performing some particular task.
: - !
-.
v
.tt
i
Stasko, Badre and Lewis (1993) carried out a study to investigate whether using an SV was better than no additional intervention. They investigated the educational benefits of SV. In their study a visualization of a priority queue algorithm was used. Half of the students were provided with the visualization and the program, while the other half were just given the program. The SV was found to only slightly assist student comprehension. Another study by Brusilovsky (1994) took a slightly different approach. The study investigated the potential role of SV as a tool for novice program debugging. The experiment was carried out as part of a computer programming practical class. When students noticed their solution to a programming problem was working incorrectly, four stages of explanation were used successively until the student managed to understand the reason for the buggy behaviour. First, the student was shown the disparity between their own result and the correct result. Second, they were shown a visualization of the execution of their program. Third, a verbal simulation of the execution of the program was provided. Finally, if the student still failed to understand, the assistant used their own knowledge to explain the error. As over a third of problems were solved at the visualization stage, the results indicated a plausible role for SV within a full teaching environment.
92
Though these studies provide some insight into the potential role of SV in education they have to rely on anecdotal evidence for the interpretation of their findings. This means the results cannot diiectly explain what cognitive activities the students were performing when using the SV, whether students had any particular conceptual difficulties with the SV, or how the SV could be improved. A few studies have made a direct comparison of a number of SVs for performing specific tasks. These studies used static screen snapshots rather than the full SV, and required the subjects to derive particular pieces of information from the display as quickly and accurately as possible. For example, Patel, du Boulay and Taylor (1991) performed a direct comparison of static snapshots of three SVs for Prolog. They investigated the relative speed with which subjects could access information from static displays of three Prolog SVs. Differences were found between the SVs on particular questions though the results were difficult to interpret, relying on anecdotal evidence. Though these direct comparison studies are informative as to the issue of how easily information can be accessed from different static formats, the dynamics of a “real” SV are a crucial aspect of its design. The dynamics show how the execution of the program develops over time. The students’ ability to appreciate and understand these dynamic changes is crucial to its usability. Measuring the amount of time taken to access specific information fragments can only help explain one aspect of how the SV impacts on the cognitive activities of the user. A more detailed cognitive account would help to explain the high level performance differences between SVs. This would provide stronger evidence as to how each SV could be improved and more directly highlight their strengths and weaknesses. FINE-GRAINED 3. MISUNDERSTANDING
EVALUATION
OF
INFORMATION,
STRATEGY
AND
The evaluation and design process presented in this paper has at its centre a fine-grained approach to the evaluation of SV tools. The evaluation technique uses protocol analysis to derive a fine-grained account of how the student interacted with the SV. This section will first introduce the three kinds of cognitive evidence analysed from the protocols, and then explain how this fits into the evaluation and design process as a whole. 3.1
Information
Some studies have already considered the kinds of information that are accessed during program comprehension phases. For example, Bergantz and Hassell (1991) used protocol analysis to measure information access during Prolog comprehension using four main information types (which they termed relations): control flow, data flow, program structure and program function. Clearly these information types will have to be extended and modified to take into account the incorporation of the SV, though these outline some basic information types that are central to program comprehension and would therefore be expected during SV use. 3.2
Strategy
Some work has also looked at the use of programming strategies during program comprehension and debugging. Green (1977) considered the ease with which forward and backward reasoning strategies can be utilised given different control constructs within the program. Similarly, Katz and Anderson (1987) used the analysis of forward and backward reasoning in their discrimination between novice and expert program comprehension. It is therefore possible that forward and backward program analysis could be employed when using an SV during program comprehension. More specific strategies relating to SVs may also be observed.
: . ,
’ .,
,
.I 1 _.’ :, ;.
I 1
1 : .-,: .‘)! ::., .“
3.3
Misunderstanding
The misunderstandings category is the most language dependent of the threel. Fortunately a great deal of work has been carried out on the kinds of misunderstandings novices tend to have of the Prolog execution model (Fung et al, 1990). The protocols will give an insight into how the subject interprets the SV and execution of the program. This will allow an investigation of how misunderstandings are affected by the SV. It would be expected that using a SV would reduce many of the well documented misconceptions, though the extra demands of dealing with the SV could create new misunderstandings which have not previously been investigated. 3.4
The Evaluation
and Design
Process
The full evaluation and design process is made up of four stages: developing an SV test-bed, performing a fine-grained evaluation, interpreting the findings, and designing a new SV. Each of the four stages of the process has particular deliverables attached to it. First, the test-bed of candidate SV systems has to be assembled. During this stage, the emphasis for the evaluator/designer is on identifying the main features of the SV, in terms of the textual ad graphical constructs used in the design. These will tend to be closely related to the claims made by the original designers as to what display methods are appropriate for clearly presenting programs and their execution. The fine-grained evaluation provides the cognitive evidence as to how useful each of the SVs arc. The cognitive evidence comprises how users are able to access information from the SV, the kinds of strategies they employ to manage that information, and any misunderstandings they have of the information presented. In the third stage, the outcomes of the previous two stages are assimilated and interpreted to gain an understanding of the notational constructs of the SV in terms of their cognitive effects. Finally, this knowledge can be used in the fourth stage to develop a new SV. The previous stages will ensure that the design decisions underpinning the new SV will be based on sound evidence as to how the users’ access to, and assimilation of information needs to be supported, and what kinds of notational construct should help 4.
DEVELOPING
A SOFTWARE
VISUALIZATION
TEST-BED
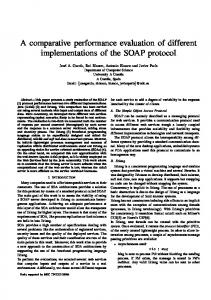
Four SVs were used in the study, which are described below. These were implemented within the same environment, the Prolog Program Visualization Laboratory (PPVL) (Mulholland, 1995). This provided an experimental laboratory allowing a number of fully implemented SVs to be compared within the same environment. PPVL provides similar interface and navigation for each SV and records all user activity at the terminal. Spy (Byrd, 1980) (figure 1, top left) is a stepwise, linear, textual SV system which adopts the Byrd Box model of Prolog execution. Spy gives a basic procedural account of the execution. The head of a clause can be thought of as a procedure and the tail treated as one or more sub procedures. Byrd’s aim in the development of Spy was to provide a basic but complete account of Prolog underpinned by a consistent execution model. PTP (Prolog Trace Package) (figure 1, top right) was developed by Eisenstadt (1984) to provide a more readable and detailed account of Prolog execution than is found in Spy. PTP aimed to make the account of execution as explicit as possible, thereby reducing the amount of interpretation required by the user. Particular areas where PTP aimed to improve on Spy was in the presentation of more specific status information and a more explicit presentation of how the program relates to the execution.
lThoughts on the generalizability of the methodology will be presented later.
94
TPM (Transparent Prolog Machine) (Brayshaw and Eisenstadt, 1991; Eisenstadt and Brayshaw,
1988) (figure 1, bottom left) aimed to provide the very detailed account provided by PTP in a much more accessible form. TPM uses an AND/OR tree model of Prolog execution. Execution is shown as a depth first search of the execution tree. Unlike the other SVs, TPM incorporates two levels of granularity. An AND/OR tree model is used to provide an overview of the execution. Fine grained views giving details relating to a particular goal within the program execution are obtained by selecting the node in question. 77T (Textual Tree Tracer) (Taylor, du Boulay and Patel, 1991) (figure 1, bottom right) has an underlying model similar to TPM but uses a sideways textual tree notation to provide a single view of execution which more closely resembles the source code. Unlike linear textual SVs such as Spy and PTP, current information relating to a previously encountered goal is displayed with or over the previous information. This keeps all information relating to a particular goal in the same location. The aim behind TIT was to provide the richness of information found in the TPM SV in a form more closely resembling the underlying source code. This approach necessitates an important trade-off in the design of the SV notation. TPM aims to show the structure and nature of the execution by using a graphical formalism to show an overall picture. For TIT, constructing a SV notation with a close affinity to the underlying source code was a primary aim. call
SPY
grandparent(-1,2)
UNIFY1
[I
1: ? grandparentI_1,-2) 2: 7 g?s3ndparent(~1, -2) [ll ? parentL1, 3) 3: +*parent(tom,liz) [l] 4: ? parenttliz, -2) 5: --parent(liz,-2) 6: A parent(tom, liz) 7: c parent(tom, liz) [ll 8: +*parent(pam,bob) 123 9: 10: ? parenttbob,-2) 11: +*parent(bob,arm) [31 12: + grandparent(pam,ann) 111
call pare&Q, -3) [-It= tom -3 = lizl UNIFY1 exit parent(tom, liz) call parent(liz, -2) fail parent(liz, -2) redo parent(tom, liz) r-1 = pam3 = bob] UNIFY2 exit parent(pam, bob) call parenttbob, -2) UNIFY3 L-2 = annI exit parent(bob, ann) exit grandparent(pam,aM
TPM
7771:
grandparent(X, Z) x=pam
1s
m
z=ann
grandparent(Xo,Zo 1
Figure 1. Software Visualization displays of a Prolog grandparent program, which infers grandparent relations from a given set of parent relations. The SVs shown are (top left) the linear textual Spy, (top right) the readable textual PTP, (bottom left) the graphical TPM showing the AND/OR tree and the fine-grained details of the grandparent node, and (bottom right) the non-linear textual TIT.
95
,:.
.,: , -. . . < P
5.
PERFORMING
A
FINE-GRAINED
EVALUATION
This section describes the fine-grained evaluation of the SV test-bed. First the study is described. This is followed by the overall performance results on the set task, and the cognitive evidence in terms of how students were able to accessinformation from the SV, the kinds of strategies they used and the occurrence of misunderstandings of what the SV was showing. ./_,
, ., ‘.
;
;, ,_
.; ;.,.
‘,, ., ; ,.,, .‘.’
-, _ (
(. 1
_-..,s :
.$
5.1. The Study To assess how well each of the four SVs could be used by students, a study was carried out involving 64 Open University residential school cognitive psychology students taking the Artificial Intelligence project. Students taking the project are required to model a simple cognitive theory in Prolog. Each residential school project lasts approximately 2.5 days.
_ ‘,i, .‘-
,: s , I
’ -,
.I ye,,:
j :
The empirical study itself required subjects to work in pairs. This was used to facilitate a naturalistic protocol. A between subjects design was used. Eight subject pairs were tested for each of the four SVs. Initially, a pre-test was administered to ensure the students understood the basics of control flow and unification before commencing the experiment. Questions covered the order in which goals and subgoals are tried and the Prolog unification algorithm. The subjects were then given five minutes to familiarise themselves with a program presented on a printed sheet. The program (see figure 2) was an isomorph of the one developed by Coombs and Stell(1985) and has been widely used to investigate difficulties students have in understanding Prolog, particularly the features of the execution model. lo~ows(joe, nick). la~ows(charles,fred). famous(mick). famous(charles) . sarcasticbnick). sarcastic(fred). unfriendly(Person) :name-dropper(Person), sarcastic(Person). name_dropperND) :knows(ND, BigShot), famous(BigShot). name_dropperbTD) :k~orvs(BigShot,ND), famous(BigShot).
Figure 2. Correct version of the Coombs and Stell(1985) isomorph. They each retained a copy of this program throughout the experiment. They were then asked to work through the visualizations of four versions of the program which had been modified in some way. Their task was to identify the difference between the program on the sheet and the one being visualized. They had no access to the source code of the modified versions. The four modifications the subjects were required to identify were a control flow change, a data flow change, a relation name change, and a change to an atom. The control flow change was either swapping the order of facts, or the order of subgoals within a rule. The data flow change was either changing a variable name or replacing a variable with a constant. The relation name change was replacing all occurrences of the word “knows” in the program with the word “likes”. The atom change was replacing all occurrences of “charles” within the program with “prince-charles”, If after exploring one of the four visualizations for five minutes the subject pair had not spotted the change, they
96
were given the opportunity to move onto the next one. A post-test questionnaire was administered to derive feedback on the SV and its role within the course. Subjects were asked questions as to how useful they perceived the SV to be and how able they felt to use it. A record was also taken of any previous programming experience the subjects had. Overall
5.2.
performance
on the task
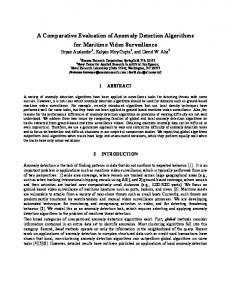
The mean number of problems solved by each subject pair in total are shown in figure 3. PTP performed the best overall. The lowest success rate was found with the graphical TPM. There was a significant main effect for SV, F(3,28) = 3.260, p c 0.05.
SPY (basic text)
PTP (readable text)
(gt$&)
(treZ)
Figure 3. Mean number of problems completed within five minutes. 5.3.
Information
A preliminary analysis of the protocols identified the kinds of information referred to by subjects. Three information types identified important differences between the SVs. These were control flow information (CFI), data flow information (DFI) and SV related information (SW). Control flow statements may refer to the order in which events happen within the execution, the status of goals within the program, or the clause number within the program with which a goal has unified. Data flow statements either referred to bindings occurring within a goal or to the sharing of values between variables contained in different goals. WI utterances related to the navigation or notation of the SV, usually relating to which button has to pressed or referring to some symbol within the notation. A more detailed account of how the protocols were coded for information types can be found elsewhere (Mulholland, 1995).
30 25
n Control
Flow Information cm IIIData Flow Information (DFI)
El
20 15 10
n Software
Visualization Information (WI)
5 0 f SPY Figure 4. Mean number of CFI, DFI and SVI utterances.
The means for CFI, DFI and WI information by SV are shown in figure 4. CFI and DFI are successful attempts to access information. SVI represents attempts to access information about the SV rather than the program itself. Subjects accessed more control flow than data flow information with each of the four SVs. By far the greatest number of utterances relating to understanding the
97
SV rather the program were found with TPM, which also had the least number of control flow and data flow utterances. As control flow and data flow are the more central information types to program comprehension, a two way mixed ANOVA was performed on this data. This revealed significant main effects for SV, F(3, 26) = 5.155, p < 0.01 and information type, F(l, 26) = 15.262, p < 0.01. A Tukey (HSD) post-hoc comparison revealed significant differences between PTP and TPM (p < 0.05) and TIT and TPM (p < 0.05). A one way analysis of variance revealed a significant main effect for SV related utterances (SVI), F(3,26) = 5.536, p c 0.01. A Tukey (HSD) post-hoc comparison revealed significant differences between PTP and TPM (p < 0.01) and TIT and TPM (p c 0.05). 5.4.
Strategies
A preliminary analysis of the protocols identified the kinds of comprehension strategies used by subjects. Five comprehension strategies showed interesting differences between the SVs. These were review control flow (REVIEW CF), review data flow (REVIEW DF), test control flow (TEST CF), test data flow (TEST DF), and mapping between the SV and the code (MAPPING). A more detailed account of how the protocols were coded for strategy types can be found elsewhcrc (Mulholland, 1995). The strategy REVIEW CF denotes reviewing some or all of the previous steps in the control flow in order to better understand the current state of the execution. A similar strategy was concerned with reviewing previous changes in data flow in order to understand or explain all or any of the current variable bindings (REVIEW DF). The mean occurrence of review strategies is shown in figure 5.
SPY
PTP
TPM
n-r
Figure 5. Mean number of control flow and data flow review strategies (REVIEW CF and REVIEW DF). The only SV to encourage data flow to be reviewed more frequently than control flow was TIT, which is consistent with what the designers claimed (Taylor et al, 1991). Subjects using PTP reviewed control flow and data flow to similar extents. Those using Spy and TPM had less review strategies, with a strong bias toward control flow.
SPY
PTP
TPM
Tl-r
Figure 6. Mean number of control flow and data flow test strategies (TEST CF and TEST DF). A two factor ANOVA comparing the four SVs across the two review strategies revealed a main effect for SV, F(3, 26) = 3.495, p < 0.05 and a significant interaction between SV and strategy, F(3, 26) = 4.304, p < 0.05. Simple effects were found for the strategy REVIEW DF, F(3, 43) =
98
5.528, p < 0.01 and the SV TIT, F(l, 26) = 9.333, p c 0.01. A Tukey (HSD) post-hoc comparison revealed a significant difference between PTP and TPM (p < 0.05). Test strategies related to the prediction and testing of future control flow (TEST CF) or data flow (TEST DF) states. When using this strategy the subjects would make some prediction as to a future control flow or data flow state and then step forward to test their prediction. The distribution of test strategies is shown in figure 6. All SVs showed more control flow test (TEST CF) than data flow test (JEST DF) strategies. TPM subjects showed the least number of test strategies. A two factor ANOVA comparing the four SVs across the two test strategies revealed a main effect for SV, F(3,26) = 3.253,~ < 0.0378. A Tukey (HSD) post-hoc comparison revealed a significant difference between PTP and TPM (p < 0.05).
Figure 7: Mean number of MAPPING strategies. Another strategy identified the mapping made between the SV and the program code (MAPPING). Often it was not clear what level of understanding was occurring during the use of this strategy. In its simplest form, the subjects could be just spotting a physical resemblance between some text in the SV and some text appearing in the source code, rather than fully understanding the context in which the information is being presented. The mean number of MAPPING strategies for each SV are shown in figure 7. In contrast to relative distribution of review and test strategies, TPM showed the greatest number of MAPPING strategies. A one way analysis of variance of the distribution of the MAPPING strategy revealed a main effect for SV, F(3, 26) = 5.656, p c 0.01. A Tukey (HSD) post-hoc comparison revealed a significant difference between ‘ITI’ and TPM (p < 0.01) and TIT and Spy (p < 0.05). Misunderstandings 5.5. A preliminary analysis of the protocols revealed four main misunderstandings of the SV. These were: making an inappropriate mapping between the visualization and the program (MAPM), deriving an incorrect model of either control flow (CFM) or data flow (DFM), or failing to appreciate the stage within the execution being presented, referred to as Time Misunderstandings (TM). A more detailed account of how the protocols were coded for misunderstanding types can be found elsewhere (Mulholland, 1995). The mean number of misunderstandings per subject pair are shown in figure 8.
SPY
PTP
TPM
Trr
Figure 8. Mean number of each misunderstanding per subject pair.
99
MAPM (Mapping Misunderstanding) refers to when part of the program is compared in an inappropriate way to a part of the SV. Essentially, this misunderstanding is an inappropriate application of the MAPPING strategy described earlier. The MAPM misunderstanding occurred, when either some part of the display and code were incorrectly compared because of some surface similarity, such as the presence of a particular word, or conversely, when some part of the code and display were thought to be unrelated because of some surface dissimilarity such as the use of different variable names in the display. CFMs (Control Flow Misunderstandings) resulted from either the subjects adopting an ad hoc false interpretation of control flow which the SV failed to counteract, or an incorrect interpretation of the SV which lead subjects to reject their correct model of control flow. Similarly, DFMs (Data Flow Misunderstandings) tended to result from a disparity between the subjects’ assumption regarding what should happen at some point in terms of data flow, and their interpretation of what the SV was displaying. Once again, the origin of the misunderstanding seemed to be either the subjects adopting an incorrect model of data flow on an ad hoc basis which the SV failed to counteract, or a false interpretation of the display leading them to reject their correct assumptions. Time misunderstandings (TM) were those resulting from a failure to appreciate the position in the execution being shown at some particular point. For example, some subjects thought the SV was faulty because a particular variable was unbound, though the stage of the execution at which it becomes bound had not yet occurred.
,:
Spy and TPM subjects exhibited the greatest number of misunderstandings, though differed in the nature of the misunderstandings exhibited. Spy subjects showed a large number of control flow and data flow misunderstandings. The misunderstandings of TPM subjects were largely time misunderstandings. Some time misunderstandings were also noticed among TTY’ subjects, MAPPING misunderstandings were noticed across all SVs.
‘; ! I 4
-., ‘r, .,~.I ‘; ‘,! ,.. . :
A one way ANOVA of the total number of misunderstandings for each subject pair revealed a main effect for SV, F(3, 26) = 3.669, p c 0.05. A Tukey (HSD) post-hoc comparison revealed a significant difference between PTP and TPM (p < 0.05).
,,I;
6.
I
INTERPRETING
THE
FINDINGS
The evaluation can be used to motivate the design principles of a new SV. The protocol evidcncc can be used to identify successful features of the SVs studied, and areas where new design features are required to support the user. Before the interpretation can begin, some agreement has to bc reached as to whether high or low ratings on various protocol measures is desirable, The misunderstandings category is the most straightforward. Regardless of the domain, minimising the number of misunderstandings is clearly a goal of the new design. Determining desirable levels for information access and strategy utilisation requires a little more thought. It could be argued that a large number of, for example, control flow utterances actually indicates that control flow is being obscured in the display, leading to the endless repetition of the same fragments of information, Similarly, subjects may make frequent but ineffective use of a particular strategy. Here, there are no hard and fast rules, though looking for interrelations between the measures and the overall performance on the task can give a good indication, as can careful consideration of the user population and experimental task undertaken. In order not to detract from the flow of the paper, further statistical analysis will not be given here, though a cursory glance through the results is sufficient to indicate the more successful SVs showed high levels of information access and strategy utilisation. The exception to this is access to Software Visualization Information (SVI) which was detrimental to performance, as it led students to talk about the characteristics of the SV rather than what it was showing them.
100
This correlation between information, strategy and overall performance can also be explained in terms of the task and user population. The subjects had very limited expertise in Prolog. An expert, having a model of what information is required in order to gain a good understanding of a program, may track down obscure information. This would result in an inverse relationship between how well a certain kind of information was presented and the number of related utterances. This did not appear to be the case in the above study. Their use of the SV was more exploratory and less goal directed. Additionally, the task, which was very characteristic of how an SV is used, required the user to explore until they found something suspicious. This provides reasonable evidence that the subjects were working with the information they could glean, rather than searching for information they could not find. In summary, a future SV design should ideally produce less Software Visualization Information (SVI) and misunderstandings, and more of the other kinds of information and strategies. Four particular areas of the design will now be considered. First, it is important that there is a clear, simple mapping between the SV and the underlying source code. The graphical TPM, which had the least affinity to the source code suffered as a result with this early novice population. The MAPPING strategy helps the student to understand the current state of the SV directly in terms of the program they wish to understand. It is though more complex than just making the SV look like the code, as this could cause the student to map inappropriately between the SV and code. This could be seen from the protocols, particularly with the textual Spy and TIT displays. Although these SVs produced an output similar to the code, there were insufficient safeguards within the notation to ensure the student did not just look indiscriminately for a surface resemblance between the code and SV, which often lead to mapping misunderstandings (MAPM). It is therefore important that as well as having a reasonable degree of affinity, the notation encourages the student to compare the SV and code in way which involves a reasonable degree of understanding. The two areas where the correct mapping between the SV and the code must be particularly emphasised is in terms of control flow and data flow. Evidence for this can once again be seen from the protocol evidence of Spy and TIT subjects. With Spy, many of the mapping problems were due to the subject failing to appreciate how the goal to be evaluated within the execution (as shown in the SV) related to part of the program. The crucial information to help them in this was shown in “UNIFY” lines within the display. These were largely misunderstood or even ignored by the subjects. This is probably because they show execution details in a way which makes it hard to relate to the source code. This lead to a number of related control flow and data flow misunderstandings (CFM and DFM). Similarly, in TIT all information relating to this is placed at the end of the line, when in fact this information is required in order to understand the goal which is shown earlier in the line. It is therefore important that the goal and status information that relates the control flow as shown by the SV to the code is emphasised to encourage correct interpretation.
In terms of how to present data flow, a difficult design decision has to made. The SV can either use variable names within the display that reflect data flow through the program (i.e. permeating high level variable names through the execution), or they can use variable names that are faithful to the source code (i.e. using variable names as they appear in local scopes within the program). ‘ITT used names related to data flow. This had its advantages as can be seen from the way TIT subjects were able to review data flow events (REVIEW DF) presented by the SV. This though had its down side, in the occurrence of data flow and mapping misunderstandings, due to different variable names appearing in the SV and the code. An improved design should present program data in way which allows the student to appreciate the pattern of datafzow through the execution, but also helps the student to associate this information with the actual variable names appearing in the program
101
A further issue that can be identified from the protocols is the tendency of time misunderstandings to occur in the protocols of TPM and TIT, though not Spy and PTP. This is because Spy and PTP develop in a linear way, the number of lines on the display giving the subject a clear indication of how far the execution had progressed. TPM on the other hand has a definite tree shape which remains throughout the execution, giving no obvious clues as to what stage of the execution has been reached. Similar problems were found for TTI’, which although is textual develops nonlinearly by moving up the display to overwrite or insert new information. The results suggest that for a novice population, it is important to give a very straightforward temporal perspective on the execution.
Finally, even subjects using PTP, which performed reasonably well, still revealed certain misunderstandings of the execution, with regard to mapping inappropriately between the SV and the code (MAPM) and data flow misunderstandings (DFM). Almost without exception these occurred during backtracking sequences during the execution which is when, on failure, the execution moves back to an earlier goal to see if it can be achieved in an alternative way. A new SV design should be able to clearly represent backtracking phases of the execution in way which avoids misunderstandings.
In summary, the new design must focus on supporting the user in: 1) mapping between control flow information in the SV and the code; 2) mapping between data flow information in the SV and the code; 3) gaining a clear temporal perspective of execution within the SV; 4) keeping track of control flow even during complex phases. 7.
DESIGNING
A NEW
SOFTWARE
VISUALIZATION
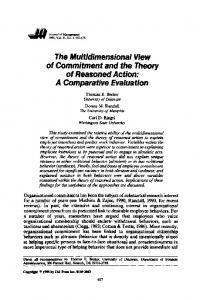
A number of SVs were designed using these motivating principles. For this case-study an SV called Plater will be considered, as this was the first SV to emerge from the design criteria and has itself been evaluated. The relation between Plater and the interpretation above is illustrated in table 1 and figure 9. The interpretation of the findings suggests four issues which the new design needs to address. These are: (i) supporting an effective mapping between the SV and the source code, (ii) presenting data flow in a way which remains faithful to the source code, (iii) providing a clear perspective on the execution history in a way which allows students to understand what has already happened, what is currently happening, and what is about to happen, and (iv) clearly showing how the execution resumes when a goal fails. These four issues and how each are tackled in the Plater design will be considered in turn. First, the issue of helping the mapping in terms of control flow was tackled by emphasising the information relating to the status of each goal and how that relates to the code. This was done by moving this information to the beginning of each line. This should encourage students to take note of it before moving onto analysing the goal itself. The intended outcome of this change is a reduction in the number of mapping misunderstandings (MAPM). These misunderstandings tended to arise when the subject lost the context for a goal shown in the SV which led to an inappropriate mapping being made between the SV and code. This change should also increase access to control flow information, and its utilisation in comprehension strategies. In figure 9, “Decision 1” shows how in line two of the visualization, the information that the first clause has been entered is shown near the beginning of the line. This is true of all lines in the visualization which relate to a goal. Second, it is important that the SV presents data flow information in way that does not prevent the user from mapping to the variables as shown in the program. This is dealt with in Plater by the use of “textual lozenges” whereby the left variable in each lozenge reflects data flow and the right variable is faithful to the underlying source code. In figure 9, “Decision 2” shows how the top level variable “B” is permeating through the execution, and is related to variable “Z” within the scope of the rule. Presenting both the data flow and code faithful variables in context is intended to
102
reduce the mapping and data flow misunderstandings and replace these with effective mapping and data flow strategies. Design goal
Design decision
Support effective mapping of control flow information to the code
Status information before term
Textual lozenge Support effective mapping of data flow information to the Linear development Provide a clear temporal perspective of program execution
Choice-point model Support the comprehension of control flow even during complex phases show Table 1. Plater SV d ;ign summary, effects.
F
Desired effects Reduce increase Control flow Mapping misunderstandings information access (CFI) and strategies (MAW. (REVIEW CF and TEST CF). MAPPING and data Mapping WW and data flow flow related strategies (REVIEW DF and misunderstandings @FM). TEST DF). Control flow Time information access misunderstandings (03) and strategies (REVIEW CF and 1TEST CF). Control flow (CFM) 1 Control flow I
design goals, design decisions and their intended
Decision 2 Decision I
Textual lozenge relates data flow to the underlying code
Status information at the beginning of the line
Linear development down the display
F
Decision 4 Special symbols used to show choice-points
. =a . .
‘0
Decision 3
grandparent (A, B) grandparent({A=XI, parent (A, Y-1) parent ({Aftoml, {Ylflizl 1 ? parent (liz, B) -m parent(liz, B) Ahhhh**AhhAhhhh