Climate 2015, 3, 1057-1078; doi:10.3390/cli3041057 OPEN ACCESS
climate ISSN 2225-1154 www.mdpi.com/journal/climate Article
Using a New Approach to Design Innovative Tools for Monitoring and Evaluating Water Policy of Burkina Faso in Response to Climate Risks Narcisse Z. Gahi 1,2,*, Kouassi Dongo 1,† and Mathieu Badolo 2,† 1
2
Unitéde Formation et de Recherche des Sciences de la Terre et des Ressources Minières, Université Felix Houphouet Boigny, 01 BP V34 Abidjan, Côte d’Ivoire; E-Mail:
[email protected] Institut d’Application et de Vulgarisation en Sciences, 01 BP 6269 Ouagadougou 01, Burkina Faso; E-Mail:
[email protected]
† These authors contributed equally to this work. * Author to whom correspondence should be addressed; E-Mail:
[email protected]; Tel.: +226-6638-0078. Received: 27 October 2015 / Accepted: 3 December 2015 / Published: 16 December 2015
Abstract: Climate change impacts on water resources have jeopardized human security in the Sahel countries for many decades, especially in achieving food security. Many strategies and policies have been made to address such impacts. However, there are still difficulties to measure progress and the effectiveness of these policies and strategies with regard to climate risks. The lack of practical and consensual monitoring tool is one of the factors that can explain gaps in policies and initiatives to overcome these impacts. To move towards filling this gap, using ClimProspect model and a participatory approach, and based on in-depth vulnerability analysis, this paper makes available some innovative integrated and coherent resilience indicators and a new index for Burkina Faso’s water resources. Taking into account both climate and disaster risks, the indicators and index developed are related to warning, responses, recovery and long term resilience. The indicators-based index applied to three sites shows that agriculture water is less resilient to a changing climate with a score varying from 22.66% to 24%. These tools can help in formulating, implementation and reviewing water policy to secure water resources under the stress of climate change. The approach and findings bring together, on one hand, social and ecological resilience to climate risks, and sciences and policy on the other.
Climate 2015, 3
1058
Keywords: agriculture water; climate risks; vulnerability; resilience; indicators; index
1. Introduction Monitoring and evaluating resilience to climate risks and changes are increasingly essential in securing ecological and human systems for sustainable development [1]. Major progress has been made so far to monitor mitigation initiatives, especially those related to reducing greenhouse gases. However, in terms of adaptation, tools to measure progress and the effectiveness of water policies are still problematic, especially for the Sahel. However, adaptation policies will be the major foundation for resilience in the region as long as socioeconomic development is still based on rainfed agriculture. Since the 1970s, the climate of the region has been experiencing regime shift characterized by unreliable rainfall that amplifies agriculture water scarcity [2–10]. Such continuous impacts question the relevance of the current adaptation policies. In Burkina Faso (BF), 86% of the population depend on agriculture. Droughts and floods severely impact on agricultural water (AgWater) and food security [11–16]. Therefore, diverse options are implemented to address water resources vulnerability to the changing climate in order to secure livelihoods. At the national level, these mechanisms and strategies include integrated water resources management (IWRM), the revitalization of meteorological and hydrological services, the cloud seeding programme (SAGA programme) and the National Adaptation Programme of Actions (NAPA). At the local and community level, the most notable of these strategies are the water control strategies focused on the creation of dams and small reservoirs, promoting indigenous water and soil conservation techniques. BF is also an active member of the Inter-State Community for Drought Control in the Sahel [17], and transboundary basin authorities like Volta Basin Authority [18]. At the global level, there are indicator-based index methods developed in order to assess the effects of climate risks on water resources. There are, inter alia, the DPSIR method (or Drivers, Pressures, State, Impacts, Response) [19], Agricultural Water Poverty Index [20], Index of Social Vulnerability to Climate Change [21], Climate Vulnerability Index (CVI) [22], Social vulnerability Index to shocks [23]); Tracking Adaptation and Monitoring Development Framework (TAMD) [24]. However, the extent to which policies and initiatives contribute to reduce or reinforce water resources vulnerability or resilience for the benefits of communities is still not well-known. Notwithstanding the recognition of monitoring and evaluation as relevant tools to measure policy effects, the climate change (CC) adaptation challenge in BF as well as in the Sahel lacks a consensual tool to measure progress in adapting to climate risks and change. Dealing with such an issue can help support policy makers, planners and users measuring the effectiveness and changes induced by policies. In addition, water resources management for the poor farmers under climate change requires an explicit link between AgWater policy, climate effect reduction strategies and farmers’ social living conditions. Indicators, for example, can provide information on four main functions [20,21,25,26]: (i) synthesizing a large volume of information, (ii) showing the current situation in comparison to the desired one, (iii) informing on progress related to the expectation, and (iv) giving relevant information to stakeholders and assisting them in policy formulation referring to the norms. This calls for a development of tools to measure adaptation effectiveness to support climate resilience.
Climate 2015, 3
1059
This paper aims at providing a prototype for monitoring and evaluation of AgWater resilience to climate risks and change in BF. It can serve as a starting point to build a consensual standard framework to measure progress and understand water resilience to climate risks. 2. Method 2.1. Study Field BF is a landlocked country of West Africa that covers an area of about 274,000 km2 with 86% of inhabitants depending on agriculture. It is characterized by a tropical climate with a mono-modal rainfall pattern of variable duration and increase in temperature from the North to the South. The short rainy season usually goes from June to October and the long dry season goes from November to May [27,28]. The mean annual rainfall ranges from 1100 mm to 500 mm from the southern to northern areas. During dry seasons, the temperature can exceed 40 °C. The country is entirely covered by three cross-border basins including the Volta basin covering 63% of the total area of the country [14]. It includes the Nakanbe sub-basin, which is the reference field for this study. Evaporation rate in the basin is 2m/year in water bodies while groundwater levels may fall down between 0.5 to 0.6m during the dry season [29,30]. Increase in temperature, changes in rain regime, and extreme event intensities and frequencies are likely to cause AgWater scarcity [31]. Figures A1–A3 in Appendix show both spatial and temporal variation of the three climate parameters (rainfall, temperature, evaporation) at Ouagadougou (Soudano-Sahelian zone). The main sources of AgWater are rainwater, rivers and water bodies (ponds, lowlands, lakes, dams and reservoirs) and groundwater (wells, boreholes). The current AgWater management strategy is a part of the IWRM. IWRM has been adopted as the water resources governance model in Burkina Faso since 2001. 2.2. Data Two types of data were collected to assess vulnerability and develop the monitoring tools. They include sociological and biophysical data. The former was collected through semi-structured interviews among 20 key water resources management stakeholders (policy makers, NGO, farmers’ organizations, scientists) and experts. The information collected is related to direct and indirect impacts, potential water vulnerability factors to current climate with focus on AgWater, and response to cope with (beyond this study). Additionally, a household survey was conducted among 75 households to inform about AgWater resilience index to climate risks. Farmers interviewed cultivate the same field quasi-permanently for 10 years at least. The latter are hydro-climatological data (temperatures, rainfall, and evaporation). The triangulation method and expert knowledge have been used to analyse data. The techniques of triangulation and expert knowledge have helped in data analysis. These two methods have already been used by authors such as [32–34].The content analysis method was used to analyze the interviews. The household survey data, grouped according to the classes of resilience indicators, have been codified and then submitted to a statistical analysis (percentage). The score gained by each of the resilience indicator classes is put within the Agricultural Water Resilience Index to Climate Risks (AWaRIC) equation to determine the AgWater resilience level. Tanagra1.4.5 software was used in statistical analysis (percentage) for household survey data.
Climate 2015, 3
1060
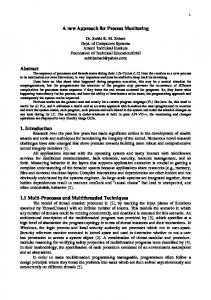
2.3. ClimProspect Model 2.3.1. Overview of the Model and Its Application to the AgWater Vulnerability Analysis The ClimProspect model as shown by Figure 1 is the reference methodological tool that has been used to elaborate the AgWater monitoring and evaluation resilience tools for climate risks and change (CC&R). It has been developed by “Institut d’Application et de Vulgarisation en Sciences” in Ouagadougou [35]. (2a) Couple (AgWater, future climate risks)
(1a) Couple (AgWater, current climate risks)
(1b) Direct and indirect impacts on the AgWater
(2b) Future climate direct and indirect impacts on AgWater
(1c) AgWater vulnerability to Climate risks
(1d) Solutions to reduce AgWater vulnerability to the current climate
(1e) Monitoring AgWater vulnerability
(2c) Solutions to reduce AgWater vulnerability to future climate
Reference framework to reduce AgWater vulnerability to climate risks nge
Figure 1. The ClimProspect model conceptual framework applied to agricultural water (AgWater). ClimProspect model is a tool used to assess vulnerability and identify response to climate risks. It requires a three-stage approach to assess vulnerability of a given system to climate risks. The term “Couple” in the Figure 1 refers to both agricultural water and one of the climate risks at least. The first stage includes: a. the specification of both the system vector (ES) and risk vector (R). The system vector is the system targeted, here AgWater. The risk vector includes the most important climate risks experienced in the area where system is located. In the Nakanbébasin, these risks are droughts, floods and heat weaves; b. R impact assessment on ES. It is matter of identifying impacts of each climate risks on the targeted system; c. ES vulnerability assessment. It consists of identifying for each impact the key vulnerability factors that make the targeted system to be vulnerable to the climate risks.
Climate 2015, 3
1061
The second stage assesses the future climate impacts on ES using three qualitative climate scenarios (very dry, very wet and fluctuation scenarios), and the third one is related to developing an adaptation framework to secure ES. With regard to the aim of this paper, only the first step has been used. Figure 2 summarizes the research approach based on the ClimProspect model applied to AgWater. In other words, it is the components of the model that has been used for the research.
Couple (AgWater, current climate risks)
Direct and indirect climate risk impacts on AgWater
AgWater vulnerability to climate risks
AgWater policy monitoring under climate risks
Figure 2. Research approach synthesis. ClimPropect is chosen as it is well-adapted to the context of the Sahel region and specifically for Burkina Faso. The model is easy to be understood, managed and used, particularly by policy makers and planners as tested during many workshops. Its qualitative analysis also allows making in-depth vulnerability assessment for a given system with regard to climate risks. In terms of uncertainty, the model is flexible and takes into account uncertainties on rainfall as reported by authors [3,27] for the future climate impact assessment. For that, the model encourages “no regret” options for climate adaptation. It also includes explicitly an analysis on monitoring (vulnerability indicators) that is one of the aims of this research. ClimProspect model is a qualitative model which has been designed, referring to the fact that the climate quantitative models disagree on the future of rainfall in the Sahelian region. For example, on the one hand, it has taken into account the outputs of the existing models, which are regional climate models. Some of these models are Regional Climate Model’s (RCMs), the Climate Local Model (CLM), the Hadley Centre Regional Climate Model, version 3, with improved physics parameterizations (HadRM3P), the Regional Atmospheric Climate Model (RaCMO). On the other hand, it integrates the needs of adaptation of the region in terms of facing uncertainties. For example, sustainable adaptation strategies are needed by policy makers, planners and users to secure investment for future generations. In a way, the model helps identify no/low regret solutions as aforementioned. It has been validated through many regional training workshops that aimed to strengthen regional stakeholders’ adaptive capacity, especially policy makers and planners, to address climate risks and change (CC&R) effects. It is used within some research programmes such as the project “Appui aux Capacités d’Adaptation àla VariabilitéClimatique, aux Evénements Climatiques Extrêmes et aux Changements Climatiques dans le Contexte Urbain et Périurbain de la Ville de Ouagadougou”, jointly funded by the International Development Research Centre and the Department for International Development. It has been also used in master theses and in working papers.
Climate 2015, 3
1062
2.3.2. Definition of Vector ES and Vector System Risk R Using ClimPropect model requires replacing the studied system ES, here AgWater, by a k-dimension system vector e [35] as follows: [ES = es (e1, e2, … , ek)]
(1)
These components of the vector e are the k dimension of the studied system, which is likely to be significantly impacted by climate risks R. The components of the risk vector so-called R are the main climate risks which mostly affect ES. The vector R formally looks like this: [R = r (r1, r2, … , rp)]
(2)
where R = risk vector; r = components of R; p = number of risks In BF, the components of the vector risk R for ES (agricultural water) include droughts, floods, and heat waves such as: [r1 = droughts; r2 = floods; and r3 = heat weaves]
(3)
These risks are the most important climate risks both mentioned by scientific literature and by stakeholders. In this paper, based on the ClimPropect approach, AgWater will be considered as a dynamic system so-called S. Let E be the set of states of the System S. A specific state of S, so an element of E will be represented by four dimensional vector so-called e, such that [𝐞 = (e1, e2, e3, e4) ]
(4)
These components of this vector e are the four dimensions of AgWater (AgWater supply, quality, demand and managerial frameworks), which are likely to be significantly impacted by the climate risks r1, r2 and r3 as follows: [𝑒 = (𝑒1, 𝑒2, 𝑒3, 𝑒4) = (AgWater supply, quality, demand, managerial frameworks)]
(5)
With e1: AgWater supply, refers to the quantity of water for irrigation. It includes Bagré dam, Mogtédo Reservoir and non-permanent Nakanbe river strictosensus (Nakanbess). Bagré dam, with an initial storage of 1700 million cubic meters (Mm3), has both hydro-agricultural and hydropower functions. Mogtédo reservoir has an initial storage of 6.5 Mm3 [36,37] is for irrigation only. Both Mogtédo Reservoir and Bagrédam are fed by the river Nakanbess and its tributaries. NakanbéRiver is shared with Ghana, a neighbouring country; e2: water quality includes sedimentation and siltation in the aforesaid water sources. Although, there is pollution from the use of fertilizers, sedimentation represents the major water problem in the sense of quality for the country (contribution of water turbidity, siltation, etc). Therefore, it is considered as a major issue to be solved to the face of climate risks. e3: water demand refers to the crop water needs, including major crops in growing season (rice) and dry season vegetable like onion;
Climate 2015, 3
1063
e4: the management system which refers to the managerial frameworks, namely Ministry of Water, General Directory of Water Resources (DGRE), Nakanbé Basin Board (NBA) and the Water Local Committee (CLE). 2.3.3. Impacts of Vector R on Vector Es The second step of the ClimProspect approach consists of assessing direct and indirect impacts of vector R on vector ES. Practically, it is a matter of drawing an impact chain up for each couple (ei, rj), I = 1, 2, …, k et j = 1, …, p, as presented by Figure 3. To identify a given impact, the impact assessment should to be done several times in order to ensure that one does not fail. In fact, the final aim of the model is to build “no regret adaptation”. First, one identifies a set of immediate drawbacks related to environmental, economic, social, technological, human, political and institutional aspects. Second, the significant impacts are selected. Finally, to draw impact chain, these impacts are selected by order of importance. Couple (ei,rj) I = 1, 2, ..., k; j = 1, 2, ...
Direct impact (d0) from climate risks rj on the systems components ei
First indirect impact (d1) = the most important immediate consequence of d0
Indirect impact of importance 2 (d2) = the most important immediate consequence of d1
Indirect impact of importance 3 (d3) = the most important immediate consequence of d2
Indirect impact of importance n (dn) = the most immediate consequence of dn−1
Figure 3. Approach to draw the chain of impacts. 2.3.4. ES Vulnerability to R There are many different definitions of vulnerability [25,38].The ClimProspect approach considers that “vulnerability” of a given system comes from characteristics of the system itself or characteristics of the environment in which the system is located. These characteristics explain the impacts on the system if risks occur. In practice, it is a combination of a series of vulnerability factors. The first vulnerability factor includes vulnerability factors based on features or characteristics of the system itself. The second one is related to ecological, social, economic, technological, institutional and political aspects. Figure 4 shows the steps to identify, for a given impact—the two types of vulnerability factors. In practice, to formulate a set of the vulnerability factors, four vulnerability classes are used. Thus, the vulnerability factors identified will be split into these classes that are: a. b. c. d.
vulnerability linked to early warning so-called vulnerability class V1, vulnerability linked to response so-called vulnerability class V2, vulnerability linked to recovery so-called vulnerability class V3, and structural vulnerability so-called vulnerability class V4.
Climate 2015, 3
A given impact (d) of rj (j = 1, …, p) on ei (i = 1, 2, …, k;
1064 Features of a given system’s component ei that explains the specific impact ri when the risk has occurred
Selection of the features of the component explaining the predominant impact
Features of the environment of the system component (ei) that explain a specific impact ri when the risk has occurred
Selection of the features of the environment explaining the predominant impact
Figure 4. Process to identify vulnerability factors. 2.3.5. Monitoring Vulnerability and Resilience Indicators To identify resilience indicators, vulnerability indictors are identified first, in accordance with the four vulnerability classes aforementioned. These vulnerability factors are based on impacts. The main question to identify these vulnerability factors is: “What can explain the impacts when the risk occurred?” In this exercise, the vulnerability factors are identified for each impact referring to ecological, social, economic, technological, institutional and political aspects. Finally, resilience indicators are formulated, considering that resilience is the opposite of vulnerability. 2.4. Integrated AgWater Monitoring Index An index for integrated assessment of water resilience policy and strategies has been described. The method used is based on the previous research [23,39] and is the following: —Assuming each resilience class is a component of the index, let us give Equation (6) in which AWaRIC is the Agricultural Water Resilience Index to Climate Risks and Xi the weighting for each class. —considering that the structural vulnerability (resilience) underpins the cyclical vulnerability (resilience) [40] and taking into account the fact that both local experts and policy makers expressed that a reduction of climate vulnerability should primarily focus on structural vulnerability, greater weighting (equal 2) is given to the structural resilience; [𝑋aA + 𝑋𝑟RP + 𝑋𝑟𝑒RE + 2𝑋𝑠S = AWaRIC , 0 ≤ AWaRIC ≤ 1 ]
(6)
where A, RP, RE, S are respectively warning, response, recovery and structural resilience sub-index, and 𝑋a, 𝑋𝑟, 𝑋𝑟𝑒, 𝑋𝑠, their respective weighting, such that: [𝑋𝑎 + 𝑋𝑟 + 𝑋𝑟𝑒 + 2𝑋𝑠 = 1]
(7)
Then, Equation (6) can be rewritten as follows: 𝑋aA + 𝑋𝑟RP + 𝑋𝑟𝑒RE + 2𝑋𝑠S ] 𝑋𝑎 + 𝑋𝑟 + 𝑋𝑟𝑒 + 2𝑋𝑠 Assuming that, in practice,𝑋a,𝑋𝑟,𝑋𝑟𝑒, 𝑋𝑠 are equal, the Equation (8) can be rewritten as follows: [AWaRIC =
[AWaRIC =
𝑋𝑖 ( A + RP + RE + 2S) ] 5 𝑋𝑖
(8)
(9)
Climate 2015, 3
1065
Or [AWaRIC =
1 5
(A + RP + RE + 2S)]
(10)
Finally, the Equation (6) can formally be as follows: [𝐀𝐖𝐚𝐑𝐈𝐂 = 𝟎. 𝟐𝐀 + 𝟎. 𝟐𝐑𝐏 + 𝟎. 𝟐𝐑𝐄 + 𝟎. 𝟒𝐒] In addition, referring to the previous studies aforementioned and expert knowledge, a framework to categorise the score was designed as presented by Table 1. Table 1. AgWater resilience index assessment framework. Value Range
In Percentage
Classification
≥ 0.9%
≥90%
0.7 - < 0.9%
70 - < 90%
High tohigher resilience
0.5 - < 0.7%
50 - < 70%
Moderate to high resilience
Moderate or high resilience. Efforts in specific classes are required
0.2 - < 0.5%
20 - < 50%
Low to moderate resilience
Moderate or low resilience. Significant efforts are required.
≤ 0.2%
≤20%
Higher to steady resilience
Severe vulnerability
Interpretation Water resources resilience to climate risks and change (CC&R) is very high. However, it requires preventive monitoring. Water resources are more or less resilient. Both reactive and proactive initiatives are strongly needed.
Water resources are extremely vulnerable to CC&R. It calls for urgent efforts at all levels
2.5. Application of the Index at Three Agriculture Sites in Burkina Faso Three sites of market garden have been selected based on climate criteria (Sudanian or Sudano-Sahelian zone), the source of AgWater used in priority (groundwater or surface water) and reliability over the year (permanent or not). The first one is the sites of “market garden” in Bobo-Dioulassoor “BoboJardin” in the Sudanian zone. It is crossed by a perennial river, which is the only AgWater source used by the farmers for irrigation. The two other sites are the sites of Tanguin and Boulimiougou in the Sudano-Sahelian area (Ouagadougou). On the former site, groundwater (wells) is primary used by the market gardener. On the later site, a small reservoir is used for irrigation. On the site of Tanguin, in dry seasons, market gardeners use as the second option the dams of Tanguin 1 and 2. These dams are normally built for drinking water supply in Ouagadougou. Unlike the Tanguin site, groundwater is supposed to be used by the market gardeners at Boulimiougou like an alternative source (in dry periods). 3. Results 3.1. Vulnerability Mapping Table 2 presents the direct and indirect impacts of risk vectors R (or r1, r2, r3 = droughts, floods, heat weaves) on the components of the AgWater ES (or (es1, es2, es3, es4 = water supply, water quality, water demand, water managerial frameworks). Overall, the analysis shows the three considered climate risks have similar socioeconomic impacts regarding e1, e2, and e3.
Climate 2015, 3
1066
Table 2. Impacts of the climate risks vector (R) on the system vector (ES). The Components of the Vector e
r1 (Droughts)
r2 (Floods)
r3 (Heat Weaves)
Direct Impacts
Indirect Impacts
Consequences on Agricultural Productivity (a) and on Farmers (b)
—Overflow of the river from
e1 (Water supply)
its banks;
Evaporation
Reduction in
—loss of
from water
stored water
storage
sources causing
volume
capacity by
a reduction in
damage to the
water supply
dam and reservoir —Increase in silting concentration e2 (Water quality)
in the water sources due to reduction in water amount
—Increase in
—Evaporation
silting in the
from water
water sources
sources;
due to soil
—increase in
erosion
silting
—reduction in
concentration
stored water
in the water
for irrigation
sources
(a): —Food productivity cycle shortening —planting destruction (flood) or a failure in crop growth —reduction in arable land area —Reduction in
—decrease in yield
water stored for
—decrease in or loss of food
irrigation
production
—deficit in
(b)
functioning of the
—Changes in agricultural practices
dam and reservoir
(increase in works load, field
due to silting
desertion)
—water supply
—food price increase
restriction for
—loss of incomes
food production
—food shortage —poor nutritional quality
—Crop water —Imbalance
demand
e3 (Water
between water
becomes too
demand)
supply and
low due to
demand
higher
—asset liquidation and debt —Increase in
—increase in rural exodus and
crop water
migration towards coastal countries
demand
(Cote d’Ivoire and Ghana)
humidity —Increase in conflicts among users. e4 (water managerial frameworks)
—inefficiency of water management frameworks (failure in their initiatives); —amplification of stakeholder’s solicitation to decision makers
—AgWater development financing reallocation to face conflicts and food crisis —difficulties to implement IWRM
(a) —Decrease in food production (b) —Low participation of farmers in IWRM; —conflicts among users —desertion of farmer social network —assets liquidation and debt —rural exodus and migration intensification
In BF, the different factors that can explain the impacts from droughts, floods and heat weaves on AgWater are ranked into four classes of vulnerability as follows: V1 = {Deficits in early warning systems related to water availability and prevention against conflicts} V2 = {lack of the alternative water sources to the NakanbéRiver, Mogtédo reservoir and Bagrédam to supply crops in dry seasons; deficits in the agricultural water allocation mechanisms in dry
Climate 2015, 3
1067
seasons; deficits in the conflict management strategies; inadequacies in the mechanisms to face food shortages} V3 = {Deficits in the recovery mechanisms and devices in response to climate risks for the farmers} V4 = {Deficits in the water source planning to respond to climate risks; poor agricultural practices around the water bodies and the river; deficits in mainstreaming climate risks into the design, implementation and management of the water sources; land degradation in the Nakanbé basin; inefficiency of water saving strategies and techniques as regards heat waves and droughts; deficits in integrating climate risks in designing and implementing the water management frameworks for crop production; deficits in mainstreaming climate risks into the water policy and regulations} 3.2. AgWater Resilience Indicators AgWater resilience indicators were identified. The result is an indicator matrix including four agricultural water resilience classes of climate risks as shown in Table 3. Table 3. AgWater resilience indicators matrix under climate risks. Vulnerability Classes
Vulnerability Factors (VF)
Vulnerability Indicators
Resilience Indicators
1. Proportion of farmers that have
1. Proportion of farmers that have
Lack of robust warning concerning
no access to early warning
access to early warning
water availability
2. Proportion of climate risks
2. Proportion of climate risks
occurred without warning
preceded by warning
warning (VF = 2)
Gap in early warning system on water related-conflicts (information
Proportion of conflicts related to
gathering, processing
agricultural water shortage
and dissemination)
Lack of reliable alternatives to NakanbéRiver, Bagrédam and
Recovery (VF = 4)
from early warning 1. Proportion of water sources
without alternative water in the
having alternative to water crops
dry season
in the dry season
2. Proportion of farmers without
in the dry season
alternative water sources to irrigate their farms in the dry season
(VF = 3)
seasons without conflicts with help
1. Proportion of AgWater sources
Mogtédo reservoirs to irrigate farms
Response
Proportion of water shortage
2. Proportion of farmers having alternative water sources to irrigate their farms in the dry season
1. Proportion of the dry season
1. Proportion of the dry season
(water shortage) with conflict
(water shortage) without conflict
Deficits in the AgWater allocation
2. Proportion of AgWater sources
2. Proportion of AgWater sources
mechanisms during dry periods
without reliable water
having reliable water
allocation model
allocation model
Deficit in conflict management
Proportion of AgWater shortage
Proportion of AgWater shortage
mechanisms related to AgWater use
with conflict
without conflict
Proportion of farmers whose needs
Proportion of farmers whose needs
for recovery from climate risk have
for recovery from climate risk
not been met utterly
have been met utterly
Lack of climate
Proportion of farms not having
Proportion of farms having access
assurance mechanisms
access to climate assurance
to climate assurance
Gap in food safety net
Climate 2015, 3
1068 Table 3.Cont.
Vulnerability Classes
Vulnerability Factors (VF) Lack of access to AgWater
Recovery (VF = 4)
for recovery Deficit in access to fertilizers and seeds for recovery
Vulnerability Indicators
Resilience Indicators
Proportion of farmers not having
Proportion of farmers having
access to AgWater source
access to AgWater source
for recovery
for recovery
Proportion of farms not having access to fertilizer and seeds for recovery
Proportion of farms having access to fertilizer and seeds for recovery
Proportion of the water sources in
1. Proportion of the water sources
which silting rate increase
in which silting rate decrease
per year
per year
Proportion of the water sources of
Proportion of the water sources of
which the safety zone (100m) is
which the safety zone (100m) is
occupied by farms
not occupied by farms
Deficits in mainstreaming climate
Proportion of the AgWater
Proportion of the AgWater
risks into the design and
infrastructure not working properly
infrastructure working properly in
management of the water sources
in case of climate risks
case of climate risks.
Deficits in the water source planning to face the silting Poor agricultural practices (around the water bodies and rivers)
1. Proportion of the degraded area (non covered by trees) at the
1. Proportion of the area covered by trees at the basin level
Land degradation in the
basin level
NakanbéBasin
2. Proportion of non agro-
2. Proportion of agro-ecological
Structural
ecological farm area in the basin
farm area in the basin
vulnerability (VF
1. Proportion of farm whose yield
1. Proportion of farm whose yield
Low use of water saving and
decrease per
increase per
productivity strategies, mechanisms
agricultural campaign
agricultural campaign
and techniques as regards the heat
2. Proportion of farmers with
2. Proportion of farmers whose
waves and droughts
unmet AgWater demand in the
AgWater demand has been met in
dry season
the dry season
= 7)
Deficits in integrating climate risks in designing and running of the water managerial frameworks for crop production (CR Department, climate information device…) Deficits in mainstreaming CC into the water policy and regulations of Burkina Faso
Proportion of the WR frameworks that have not explicitly taken into account climate change and risks (CCR) Proportion of the water policy and regulations documents which have not explicitly taken into account climate change
Proportion of the water managerial frameworks with CC resilience mechanisms or devices
Proportion of the water policy and regulations documents which have clearly integrated CCR
3.3. AgWater Resilience Index Based on the resilience indicators, an integrated novel index has been built to assess AgWater Resilience to Climate variability and change. The proven methods of weighting, aggregation, and sensibility analysis have been applied [39,41,42]. Additive methods have been used for aggregating. According to [42], use of an additive structure has been reported more transparent and acceptable to different stakeholders than other aggregation functions. Additive methods also have the advantage that
Climate 2015, 3
1069
the index can be calculated when components take zero or data are not available. Normalization was easily done as all the indicators have been expressed in percentage. This index so-called Agricultural Water Resilience to climate risks and change (AWaRIC) is shown by the Equation (11). 𝐀𝐖𝐚𝐑𝐈𝐂 = 𝟎. 𝟐𝐀 + 𝟎. 𝟐𝐑𝐏 + 𝟎. 𝟐𝐑𝐄 + 𝟎. 𝟒𝐒
(11)
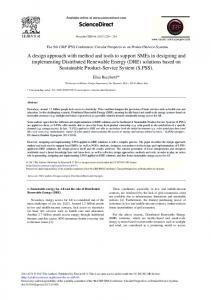
where A, RP, RE, and S are warning, response, recovery and structural resilience sub-index. In this equation, structural resilience weights approximately two times more than each of other sub-indices. Indeed, based on expert knowledge and literature review, we assume that to set the agricultural water system ES in the steady resilience state, efforts should primarily be focused on increasing the structural resilience. It is this kind of vulnerability that underpins the early warning, response and recovery needs. The new index has been applied to three agricultural sites. A survey was conducted from May to June in 2014 among a random sample of 75 heads of farmers’ households, taken from a number of 300 household gardens. Table 4 and Figure 5 presents the results of this assessment. They show that all agricultural sites are very vulnerable to climate risks and change. It is worth noticing that no AgWater site has put in place an early warning system. Tanguin got the highest score of structural resilience (33.83), and BoboJardin got the highest response score of 50. The score for Tanguin can be explained by the fact that alternative strategies have been developed, as opposed to BoboJardin which has a permanent river for the time being. Table 4. AgWater resilience level to climate risks and change to three agricultural sites in Burkina Faso (detailed results). Indice
Weight
BoboJardin
Warning Response Recovery Structural resilience Indice value/100 Resilience class
1 1 1 2
0 50 23.3 20 22.66 Low
Tanguin 0 40 24.2 33.83 26.37 Low
Boulimiougou 0 35 37.32 24.22 24.15 Low
NB. Structural resilience score has been multiplied by 2 for determining the indice value.
Figure 5. Agricultural water resilience to climate risks in BoboJardin, Tanguin and Boulimiougou.
Climate 2015, 3
1070
4. Discussion The analysis shows that droughts, flood and heat weaves still have harmful effects on WR. They significantly impair agricultural activities and production, contributing to the degradation of Burkina farmers’ living conditions [9,13,43]. Such impacts have already been highlighted by several scientists over the last two decades [3,9,27,44]. These impacts confirm that a little progress has been made in terms of climate risk adaptation though many initiatives including endogenous ones have been undertaken to address such risks. Up to now, it is difficult to know with certainty where and the extent to which policies are wrong. It clearly calls for putting in place standard tools to measure progress in addressing climate risks. Indeed, such tools can help know how policies have worked so that they can be improved. For example: a. to overcome lack of robust warning delivery, there is a need to put in place indicators to measure progress in delivering early warning; b. to meet AgWater demand calls for response indicators; c. to assure food security after risks requires recovery indicators, and d. to reduce land degradation and deficits in mainstreaming CC into the water policy and regulations call for structural indicators. Thus, the developed indicator matrix and index can be a starting point to elaborate a standardised resilience assessment framework regardless of the adaptation initiative itself. The identified resilience indicators reveal that vulnerability is related to multiple and diverse sources depending on the specific context. Moreover, it is easier to compare resilience classes with each other, since all indicators are converted into the same unit (percentage). This is another originality of this study. Regarding the index, the fact that BoboJardin, though having a permanent river, did not get the high score can be explained by the fact that the farmers of this site have not developed alternative strategies to face climate extreme events. Thus, having the permanent river in the BoboJardin site makes the farmers not develop the long-term resilience strategies. This result indicates that current resilience can induce, in a way, vulnerability in the future if farmers and stakeholders are not aware or they lack capacity to face the future climate effects.The fact that there is no formal early warning strategy on the three sites shows lack of anticipative and proactive resilience in AgWater management strategies. This illustrates that current practices in terms of climate resilience seem to be business-as-usual, despite expected climate effects. The index elaborated shows that this could contribute to reduce by 20% the AgWater resilience level. Of course, this cannot be considered for the whole country as some projects include early warning system. However, warning usually stops at the end of each project confirming that practices are not planned for the long term. Another fact can be explained by the absence of a standard tool to measure their contribution in reducing AgWater vulnerability to CC&R. In this sense, the tools elaborated (indicators, index) constitute useful and helpful tools to assess such inputs. The paper presents two major originalities in terms of science and policy. Scientifically, a new relevant and coherent method to assess vulnerability and elaborate indicators and index is designed. It is different from the usual approach that consists of gathering social and economic development indictors from literature or expert knowledge to design index as in [19,20,22,23,39,41,42,45–51]. Indeed vulnerability is associated with a specific system and context. Therefore, specific indicators should be
Climate 2015, 3
1071
identified for each social or ecological system. As recommended by [46], the proposed indicators include both physical and social variables for measuring resilience for the ecological system. On the one hand, the indicators also allow for spatial (context) and temporal scales. On the other hand, technical, environmental, human, social, economic and political issues are taken into consideration. The indicators are also a new way of thinking as they quite differ from those usually used to evaluate water sensibility to climate or WR vulnerability to climate [6,52,53]. The approach used brings together science and policy at the national level where policies are made and the local level in which policies are implemented. Thus, the indicators and index can be helpful in assessing resilience locally and nationally. However, nationwide evaluation hides local specificities. Consequently, priority should be given to the local level to monitor WR resilience to CC&R. Despite growing needs to evaluate progress and the effectiveness of the adaptation policies for WR, there is no standardised approach to do it. Furthermore, the approach used may serve as a benchmark to develop a WR scientific-based method in line with socio-economic development of BF. It is worth noticing that [54] suggested that it is necessary to establish the frame for the work and the conditions. To this end, the paper has included vulnerability to droughts, flood and heat weaves and applied to AgWater. These risks are the preponderant ones in the country, referring to both the scientific literature review and stakeholders. Concerning policies and strategies, contributions of the findings are manifold. First, the indicators and the index are strong tools to identify and rank priorities in the climate vulnerability relief efforts for WR and farmers. Second, the indicators mapping and index are a new framework for monitoring WR resilience policies of BF under both climate change and disaster risks. Third, they take into account farmer social conditions, and are also cross-sector. Otherwise, they go beyond a unique water sector and explicitly include forestry and agriculture. Informing about such indicators requires synergy among different stakeholders and institutions depending on WR. That is a good point for IWRM of BF, which requires a holistic vision. These tools can be used to infer the impacts of adaptation interventions on AgWater system in warning, responding to, recovering from, and adapting to climate variability and change. They could help reinforce WR system information and support policy-makers and planners to identify priorities, improve and plan policy. It is a tool for enabling comparison of interventions between the Basin Agencies in terms of AgWater security under CCR; measuring contribution of a given project related to AgWater in CC adaptation field, especially over longer periods than project lifetimes (how does the increasing of resilience secure WR, farmer food security and well-being?); and advocacy from humanitarian organizations, Basin Agencies. They can also serve as tools for task forces in coping with climate risks. Typically, each of the different resilience classes will help draw up specific resilience photography. Warning indicators will help measure progress of meteorological and hydrological services and other extension services in terms of dissemination and exchange of agro-meteorological information for risk preparedness in farmer communities. It is a tool to monitor communication, information sharing and awareness of the water users. Therefore, it will help account for effectiveness of initiatives to prevent direct and indirect climate risks impacts on WR. These involve agricultural activities planning linked to rainfall patterns (e.g., seeds depending on the beginning and the duration of the wet season, and irrigation). Doing so will clearly show the importance of meteorological service (which is still not well known by farmers to be useful in agriculture) in planning of agricultural development. Response indicators will provide valuable information on how agricultural communities are prepared to cope with
Climate 2015, 3
1072
climate effects on WR, and how mechanisms and strategies effectively contribute to farmer resilience. These kinds of mechanisms are supposed to meet AgWater demand especially in period of shortage through alternative water supply. Indicators for recovery will measure performance of rehabilitation policy at different levels. This can be measured, for example, through the way water users feel secure, after climate risks. In other words, it is matter of assessing water security during the droughts or after floods. Understanding “indicators for recovery” includes accessing climate insurance-mechanism and meeting the needs to recovery from these risks. It is worth noticing that indicators related to warning, response and recovery should help measure effectiveness and performance of contingency plans and response mechanisms in the country. The structural resilience indicators are assumed to monitor progress in reducing long-term effects. These indicators show that water-saving technologies are not enough to reduce vulnerability for a given hydro-agrosystem. These techniques should take into account their internalization by farmers, increase in productivity, water sources planning, and satisfaction of AgWater demand in any season. Those are related to forest and land management. Moreover, soft indicators that are changes in practices (compliance with protection standards), improvement of current policies and management systems are suggested too. The tools integrated on the one hand ecological resilience (water) and social resilience (livelihoods); and passive and transformation resilience on the other as defined by [55]. These two kinds of resilience are “no regrets” solutions, and show that the indicators and the index are relevant and useful for the long term. A population that is affected by risks will first need time to bounce back to the “normal state” and recover before being able to move forward [56]. This shows that the results are valuable, not only for monitoring and evaluation, but even better in building the effectiveness of the resilience of global socioecological systems. There are useful guides for policy makers in identifying the vulnerable areas and farmer groups so that they can decide about proper coping strategies to effectively deal with adverse climate effects. The indicators selected in this paper are SMART (Specific, Measurable, Achievable, Relevant and Timely). In addition, combining the different indicators into a unique index can contribute to reducing such insufficiencies [48]. These tools can help meet the growing demand from stakeholders, and share information about the best practices in adapting to climate variability and change impacts and measuring progress and effectiveness of WR commitments [57]. In fact, the indicators and index quantify something that cannot be directly measured so far (how policy and strategies contribute to reinforce resilience to climate variability and change). Assessment of these indicators periodically can provide accurate information to know to what extent policies and initiatives sustainably help in reducing water and farmers’ vulnerability or enhance resilience. However, to assess all indicators is not required for a given initiative. Indeed, the indicators should be relevant for the initiative itself. These standard and consensual tools should measure the impact of a given initiative in terms of reducing vulnerability or reinforcing resilience to climate risks, regardless of the initiative’s indicators itself (inputs, outcomes), as done in business-as-usual. They also constitute an important foundation on which the future water monitoring tools and policy under climate change can be built. 5. Conclusions The aim of this study was to elaborate about tools for monitoring AgWater resilience to climate risks and change in BF. Based on vulnerability analysis, four resilience indicator classes including early warning, response, recovery and long-term resilience have been identified. They serve to design a new
Climate 2015, 3
1073
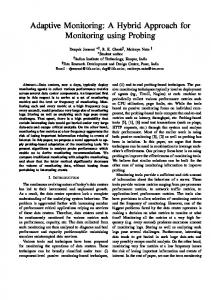
index for integrated evaluation. They have allowed for climate and disaster risks and bring science and policy together. On the one hand, they can help in adjusting current water policy of BF with regard to climate risks for sustainable food security. On the other hand, they can serve as a starting point to build a consensual reference framework to measure progress and understand water resilience to climate risks. The approach used can also help put in place a consensual method to measure progress in policy implementation. In this vision, water policy can be shifted from reactive to proactive vision. Therefore, the tools are an important foundation on which water monitoring policy can be built. However, a reliable database is required to assess indicators. Future research will focus on elaborating on an evaluation framework and informing about the proposed tools on a large scale. Acknowledgments The authors are grateful to the West Africa Economic and Monetary Union (UEMOA) for giving a PhD research Excellence Fellowship to the lead author. They would also like to thank National Meteorological Service of Burkina Faso, General Directorate of the Water Resources and Volta Basin Authority for providing the hydroclimatic and hydrological data free of charge. Thanks go to “Institut d’Application et de Vulgarisation en Sciences” (IAVS) for hosting the lead author during the period of collecting and preliminary analysis of data. They also feel grateful to stakeholders, especially the experts, decision makers and the farmers’ communities for having taken a great interest in this research. Thanks to Shani Haruna (Institute for Environment and Sanitation Studies, University of Ghana) for helpful comments on early versions of the paper. Last but not least, the authors would like to give their sincere thanks to the reviewers for their insightful comments. Author Contributions Narcisse Z. GAHI designed the work and processed all data. He was initiated to the ClimProspect model by Mathieu Badolo, who is the designer of the model. Kouassi Dongo contributed to formulating the questionnaire and data analysis. Both Mathieu Badolo and Kouassi Dongo corrected the paper. Conflicts of Interest The authors declare no conflict of interest. Appendix Rainfall and Temperature Trends during 1952–2012 at Ouagadougou Figures A1–A3 show both spatial and temporal variation of the three climate parameters (rainfall, temperature, evaporation) at Ouagadougou (Soudano-Sahelian zone). Overall, the rainfall decreases from 1970s to 2012. The last decade, rainfall seems to increase again. This has caused the greening of the Sahel [58]. Maximum and minimum temperatures go up increasingly over the years.
Climate 2015, 3
1074 1400.0 1200.0
P (mm)
1000.0
y = -3.5557x + 899.58 R² = 0.1715
800.0 600.0
P (mm)
400.0
Linear (P (mm))
200.0
1953 1958 1963 1968 1973 1978 1983 1988 1993 1998 2003 2008
0.0 Years
Figure A1. Rainfall trends during 1953–2012 at Ouagadougou. 24.0
Tmin (°C)
23.0 22.0
y = 0.0333x + 21.121 R² = 0.7227
21.0
T min°C
20.0
Linear (T min°C)
1960 1964 1968 1972 1976 1980 1984 1988 1992 1996 2000 2004 2008 2012
19.0 Years
36.5 36.0 35.5 35.0 34.5 34.0 33.5 33.0 32.5
y = 0.0187x + 34.55 R² = 0.377
T max°C Linear (T max°C)
1960 1964 1968 1972 1976 1980 1984 1988 1992 1996 2000 2004 2008 2012
Tmax (°C)
Figure A2. Minimum temperature trends during 1960–2012 at Ouagadougou.
Years
Figure A3. Maximum temperature trends during 1960–2012 at Ouagadougou. References 1.
2. 3.
Engle, N.L.; de Bremond, A.; Malone, E.L.; Moss, R.H. Towards a resilience indicator framework for making climate-change adaptation decisions. Mitig. Adapt. Strateg. Glob. Change 2014, 19, 1295–1312. Ibrahim, B.; Karambiri, H.; Polcher, J. Hydrological impacts of the changes in simulated rainfall fields on Nakanbe Basin in Burkina Faso. Climate 2015, 3, 442–458. Intergovernmental Panel of Climate Change. Climate Change 2014: Synthesis Report; IPCC: Geneva, Switzerland, 2014.
Climate 2015, 3 4. 5. 6.
7. 8.
9.
10.
11.
12.
13. 14.
15.
16. 17. 18. 19. 20.
1075
Sarr, B. Present and future climate change in the semi-arid region of West Africa: A crucial input for practical adaptation in agriculture. Atmos. Sci. Let. 2012, 13, 108–112. United Nations Environment Programme. Livelihood Security: Climate Change, Conflict and Migration in the Sahel; UNEP: Nairobi, Kenya, 2011. Mahe, G.; Diello, P.; Paturel, J.E.; Barbier, B.; Karambiri, H.; Dezetter, A.; Dieulin, C.; Rouche, N. Baisse des pluies et augmentation des écoulements au Sahel : Impact climatique et anthropique sur les écoulements du Nakambe au Burkina Faso. Sécheresse 2010, 21, 330–332. Hein, L.; Marc, J.; Metzger, J.M.; Leemans, R. The local impacts of climate change in the Ferlo, Western Sahel. Clim. Change 2009, 93, 465–483. Serigne, T.; Kandji, S.T.; Verchot, L.; Mackensen, J. Climate Change and Variability in the Sahel Region: Impacts and Adaptation Strategies in the Agricultural Sector; United Nations Environment Programme: Nairobi, Kenya, 2006. Barbier, B.; Yacouba, H.; Karambiri, H.; Zoromé, M.; Somé, B. Human vulnerability to climate variability in the Sahel: Farmers’ adaptation strategies in Northern Burkina Faso. Environ. Manag. 2009, 43, 770–803. Ludeke, B.K.; Moldenhauer, O.; Petschel-Held, G. Rural poverty driven soil degradation under climate change: The sensitivity of the disposition towards the Sahel Syndrome with respect to climate. Environ. Model. Assess. 1999, 4, 315–326. Morris, J.; Barron, J. Agricultural Water Management Technology Expansion and Impact on Crop Yields in Northern Burkina Faso (1980–2010): A Review; CGIAR Research for Development Series, R4D Series 10; International Water Management Programme: Colombo, Sri Lanka, 2014. Barry, B.; Obuobie, E.; Andreini, M.; Andah, W.; Pluquet, M. Comprehensive Assessment of Water Management in Agriculture: Comparative Study of River Basin Development and Management; International Water Management Institute: Colombo, Sri Lanka, 2005. Sanfo, S.; Gérard, F. Public policies for rural poverty alleviation: The case of agricultural households in the Plateau Central area of Burkina Faso. Agric. Syst. 2012, 110, 1–9. Volta Basin Authority. Assessment of the Basin’s Socio-Economic and Environmental Situation And Analysis of the Problem Areas and Issues Regarding Sustainable Management of Water Resources; Volta Basin Authority: Ouagadougou, Burkina Faso, 2012. World Bank. Inondations du 1er Septembre 2009 au Burkina Faso: Evaluation des Dommages, Pertes et Besoins de Construction, de Reconstruction et de Relèvement, Rapport Restitué de l’Evaluation Conjointe du 19 Octobre au 6 Novembre, 2009. Available online: http://documents.banquemondiale.org/curated/fr/2010/04/13188840 (accessed on 20 October 2015). De Condappa, D.; Chaponnière, A.; Lemoalle, J. A decision-support tool for water allocation in the Volta Basin. Water Int. 2009, 34, 71–87. Permanent Interstate Committee for Drought Control in the Sahel. Available online: www.cilss.bf (accessed on 20 August 2015). Volta Basin Authority. Available online: www.abv-volta.org (accessed on 18 August 2015). Huang,Y.; Cai, M. Methodologies Guidelines. Vulnerability Assessment of Freshwater Resources to Environmental Change; Peking University of China: Beijing, China, 2009. Forouzani, M.; Karami, E. Agricultural water poverty index and sustainability. Agron. Sustain. Dev. 2011, 31, 415–432.
Climate 2015, 3
1076
21. Katharine, V. Creating an Index of Social Vulnerability to Climate Change for Africa; Tyndall Centre for Climate Change Research: Norwich, UK, 2004. 22. Sullivan, C.; Meigh, J. Targeting attention on local vulnerabilities using an integrated index approach: The example of the Climate Vulnerability Index. Water Sci. Technol. 2005, 51, 5. 23. Garth, A.; Brett, C.; Harris, M.; Romney, A.; Mario, R.; Zollweg, J.; Vodacek, A.; Tomaszewski, B. Modeling Social Vulnerability in Burkina Faso. Available online: http://www.esri.com/news/ arcuser/0112/modeling-social-vulnerability-in-burkina-faso.html (accessed on 21 October 2015). 24. Brooks, N.; Anderson, S.; Burton, I.; Fisher, S.; Rai, N.; Tellam, I. An Operational Framework for Tracking Adaptation and Measuring Development; International Institute for Environment and Development: Edinburgh, UK, 2013. 25. Nazari, S.; Rad, G.P.; Sedighi, H.; Azadi, H. Vulnerability of wheat farmers: To a conceptual framework. Ecol.Indic. 2015, 52, 517–532. 26. Cruz, S.; Paulino, S. Public service innovation and evaluation indicators. J. Technol. Manag. Inonv. 2013, 8, 13. 27. Ibrahim, B.; Polcher, J.; Karambiri, H.; Yacouba, H.; Ribstein, P. Changes in rainfall regime over Burkina Faso under the climate change conditions simulated by 5 regional climate models. Clim. Dyn. 2014, 42, 1363–1381. 28. Secrétariat Permanent du Conseil National de l’Environnement et du Développement Durable. Programme d’Action National d’Adaptation à la Variabilité et aux Changements Climatiques; Ministère de l’Environnement et du Cadre de Vie: Ouagadougou, Burkina Faso, 2007. 29. Sandwidi, J.P. Groundwater Potential to Supply Population Demand within the KompiengaDam Basin in Burkina Faso. Ph.D. Thesis, Rheinischen Friedrich-Wilhelms-Universität, Bonn, Germany, 2007. 30. Ministère de l’Environnement et de l’Eau. Etat des Lieux des Ressources en Eau et de Leur Cadre de Gestion. Available online: http://www.eaugourma.bf/spip.php?article137&lang=en (accessed on 23 October 2015). 31. Ibrahim, B.; Rockel, B.; Polcher, J.; Karambiri, H. Characterization of the rainy season in Burkina Faso and it’s representation by regional climate models. Clim. Dyn. 2012, 39, 1287–1302. 32. Asare-Kyei, D.; Forkuor, G.; Venus, V. Modeling flood hazard zones at the sub-district level with the rational model integrated with GIS and Remote Sensing approaches. Water 2015, 7, 3531–3564. 33. European Food Safety Authority. Guidance on expert knowledge elicitation in food and feed safety risk assessment. EFSA J. 2014, 12, 3734. 34. Bauwens, A.; Brussel, U.Z. The use of method triangulation in probation research. Eur. J. Prob. 2010, 2, 39–52. 35. Badolo, M. Aspects Théoriques et Méthodologiques de la Gestion des Effets des Risques et Changements Climatiques: Approche Opérationnelle pour l’Elaboration du Cadre de Référence pour l’Adaptation au Climat et à ses Changements; Institut d’Application et de Vulgarisation en Sciences: Ouagadougou, Burkina Faso, 2014. 36. Sally, H.; Lévite, H.; Cour, J. Local water management of small reservoirs: Lessons from two case studies in Burkina Faso. Water Altern. 2011, 4, 365–382. 37. Cecchi, P.; Meunier-Nikiema, A.; Moiroux, N.; Sanou, B. Towards an Atlas of Lakes and Reservoirs in Burkina Faso. IRD: Montpellier, France, 2008.
Climate 2015, 3
1077
38. Miller, F.; Osbahr, H.; Boyd, E.; Thomalla, F.; Bharwani, S.; Ziervogel, G.; Walker, B.; Birkmann, J.; der Leeuw, S.V.;Rockström, J.; et al. Resilience and vulnerability: Complementary or conflicting concepts? Ecol. Soc. 2010, 15, 11. 39. Sullivan, C.A.; Meigh, J.R.; Giacomello, A.M.; Fediw, T.; Lawrence, P.; Samad, M.; Mlote, S.; Hutton, C.; Allan, J.A.; Schulze, R.E.; et al. The water poverty index: Development and application at the community scale. Nat. Res. Forum 2003, 27, 189–199. 40. Badolo, M. Ajustement des Schémas de Gestion de la Vulnérabilité Actuelle de la Sécurité Alimentaire au Sahel pour la Réduction des Coûts d’Adaptation aux Changements Climatiques: Aspects Théoriques et Approches Méthodologiques. Available online: http://www.iavs-bf.org/ notes_de_recherche.html (accessed on 20 October 2015). 41. Emerson, J.W.; Hsu, A.; Levy, M.A.; de Sherbinin, A.; Mara, V.; Esty, D.C.; Jaiteh, M. Environmental Performance Index and Pilot Trend Environmental Performance Index; Yale Center for Environmental Law and Policy: New Haven, CT, USA, 2012. 42. Garriga, G.; Foguet, P. Improved method to calculate a Water Poverty Index at local scale. J. Environ. Eng 2010, 136, 1287–1298. 43. Boelee, E.; Yohannes, M.; McCartney, M.; Hagos, F.; Cecchi, P.; Laamrani, H. Options for water storage and rainwater harvesting to improve health and resilience against climate change in Africa. Reg. Environ. Change 2013, 13, 509–519. 44. Brown, O.; Crawford, A. Assessing the Security Implications of Climate Change for West Africa: Country Case Studies of Ghana and Burkina Faso; International Institute for Sustainable Development: Winnipeg, MB, Canada, 2008. 45. DasGupta, R.; Shaw, R. An indicator based approach to assess coastal communities’ resilience against climate related disasters in Indian Sundarbans. J. Coast Conserv. 2015, 19, 85–101. 46. AZurieta, I.; Sithole, B.N.; Hunter-Xenie, H.; Campbell, B.; Donohoe, P.; Brown, J.; Wilson, L. Developing indicators for monitoring and evaluating joint management effectiveness in protected areas in the Northern Territory, Australia. Ecol. Soc. 2011, 16, 9. 47. Fussl, H.-M. How inequitable is the global distribution of responsibility, capability, and vulnerability to climate change: A comprehensive indicator-based assessment. Global Environ. Change 2010, 20, 597–611. 48. Sullivan, C.; Meigh, J.; Lawrence, P.Application of the Water Poverty Index at different scales: A cautionary tale. Water Int. 2006, 31, 412–426. 49. Adger, W.B.; Brooks, N.; Kelly, M.; Bentham, G.; Agnew, M.; Eriksen, S. New Indicators of Vulnerability and Adaptive Capacity; Tyndall Centre for Climate Change Research: Norwich, UK, 2004. 50. Kaly, U.L.; Pratt, C.R.; Mitchell, J. The Demonstration Environmental Vulnerability Index (EVI) 2004; SOPAC Technical Report; South Pacific Applied Geoscience Commission: Suva, Fiji, 2004. 51. Sullivan, C. Calculating a Water Poverty Index. World Dev. 2002, 30, 1195–1210. 52. Koshida, G.; Cohen, S.; Mortsch, L. Climate and water availability indicators in Canada: Challenges and a way forward. Can. Water Res. J. 2015, 40, 1–13. 53. Mekis, E.; Vincent, L.A. An overview of the second generation adjusted daily precipitation dataset for trend analysis in Canada. Atmos. Ocean 2011, 49, 163–177.
Climate 2015, 3
1078
54. Sullivan, C.; Byambaa, E. The application of the Climate Vulnerability Index in Mongolia. In Proceedings of the 2013 Workshop of Climate Adaptation, Geneva, Switzerland, 25–26 June 2013. 55. O’Connell, D.; Walker, B.; Abel, N.; Grigg, N. The Resilience, Adaptation and Transformation Assessment Framework: From Theory to Application; CSIRO: Sydney, NSW, Australia, 2015. 56. United Nations Environmental Programme; Cologne University of Applied Sciences. Background Materials to the MOOC: Disasters and Ecosystems: Resilience in a Changing Climate, Approaches for Operationalizing Resilience. Unit 19; UNEP & CUAS: Geneva and Cologne, Switzerland and Germany, 2015. 57. Harley, M.; Horrocks, L.; Hodgson, N.; van Minnen, J. Climate Change Vulnerability and Adaptation Indicators; European Topic Centre on Air and Climate Change: Bilthoven, The Netherlands, 2008. 58. Olsson, L.; Eklundh, L.; Ardo, J. A recent greening of the Sahel-trends, patterns and potential causes. J. Arid Environ. 2005, 63, 556–566. © 2015 by the authors; licensee MDPI, Basel, Switzerland. This article is an open access article distributed under the terms and conditions of the Creative Commons Attribution license (http://creativecommons.org/licenses/by/4.0/).