May 2001
Technical Report TR-16
Using a New Statistical Model for Testlets to Score TOEFL
Howard Wainer Xiaohui Wang
Using a New Statistical Model for Testlets to Score TOEFL
Howard Wainer Xiaohui Wang
Educational Testing Service Princeton, NJ
RR-01-09
®
® ®
Educational Testing Service is an Equal Opportunity/Affirmative Action Employer. Copyright © 2001 by Educational Testing Service. All rights reserved. No part of this report may be reproduced or transmitted in any form or by any means, electronic or mechanical, including photocopy, recording, or any information storage and retrieval system, without permission in writing from the publisher. Violators will be prosecuted in accordance with both U.S. and international copyright laws. EDUCATIONAL TESTING SERVICE, ETS, the ETS logos, GRE, TOEFL, and the TOEFL logo are registered trademarks of Educational Testing Service.
Abstract Standard item response theory (IRT) models fit to examination responses ignore the fact that sets of items (testlets) often are matched with a single common stimuli (e.g., a reading comprehension passage). In this setting, all items given to an examinee are unlikely to be conditionally independent (given examinee proficiency). Models that assume conditional independence will overestimate the precision with which examinee proficiency is measured. Overstatement of precision may lead to inaccurate inferences as well as prematurely ending an examination in which the stopping rule is based on the estimated standard error of examinee proficiency (e.g., an adaptive test). The standard three parameter IRT model was modified to include an additional random effect for items nested within the same testlet (Wainer, Bradlow, and Du, 2000). This parameter, γ, characterizes the amount of local dependence in a testlet. We fit 86 TOEFL testlets (50 reading comprehension and 36 listening comprehension) with the new model, and obtained a value for the variance of γ for each testlet. We compared the standard parameters [discrimination (a), difficulty (b), and guessing (c)] with what is obtained through traditional modeling. We found that difficulties were well estimated either way, but estimates of both a and c were biased if conditional independence is incorrectly assumed. Of greater import, we found that test information was substantially over-estimated when conditional independence was incorrectly assumed.
Key words: Gibbs sampling, local dependence, listening comprehension, reading comprehension, Bayesian model fitting
i
The Test of English as a Foreign Language (TOEFL®) was developed in 1963 by the National Council on the Testing of English as a Foreign Language. The Council was formed through the cooperative effort of more than 30 public and private organizations concerned with testing the English proficiency of nonnative speakers of the language applying for admission to institutions in the United States. In 1965, Educational Testing Service (ETS®) and the College Board assumed joint responsibility for the program. In 1973, a cooperative arrangement for the operation of the program was entered into by ETS, the College Board, and the Graduate Record Examinations (GRE®) Board. The membership of the College Board is composed of schools, colleges, school systems, and educational associations; GRE Board members are associated with graduate education. ETS administers the TOEFL program under the general direction of a policy board that was established by, and is affiliated with, the sponsoring organizations. Members of the TOEFL Board (previously the Policy Council) represent the College Board, the GRE Board, and such institutions and agencies as graduate schools of business, junior and community colleges, nonprofit educational exchange agencies, and agencies of the United States government.
✥
✥
✥
A continuing program of research related to the TOEFL test is carried out under the direction of the TOEFL Committee of Examiners. Its 11 members include representatives of the TOEFL Board, and distinguished English as a second language specialists from the academic community. The Committee meets twice yearly to review and approve proposals for test-related research and to set guidelines for the entire scope of the TOEFL research program. Members of the Committee of Examiners serve three-year terms at the invitation of the Board; the chair of the committee serves on the Board. Because the studies are specific to the TOEFL test and the testing program, most of the actual research is conducted by ETS staff rather than by outside researchers. Many projects require the cooperation of other institutions, however, particularly those with programs in the teaching of English as a foreign or second language and applied linguistics. Representatives of such programs who are interested in participating in or conducting TOEFL-related research are invited to contact the TOEFL program office. All TOEFL research projects must undergo appropriate ETS review to ascertain that data confidentiality will be protected. Current (2000-2001) members of the TOEFL Committee of Examiners are: Lyle Bachman Diane Belcher Micheline Chalhoub-Deville Jodi Crandall (Chair) Catherine Elder Glenn Fulcher Antony J. Kunnan (Ex-Officio) Ayatollah Labadi Richard Luecht Merrill Swain Richard Young
University of California, Los Angeles The Ohio State University University of Iowa Peace Corps/Kiribati University of Auckland University of Surrey California State University, LA Institut Superieur des Langues de Tunis University of North Carolina at Greensboro The University of Toronto University of Wisconsin-Madison
To obtain more information about TOEFL programs and services, use one of the following:
E-mail:
[email protected] Web site: http://www.toefl.org
ii
Acknowledgments This study is but one part of a larger project on the development of testlet response theory, which is supported by the Committees on Research for the TOEFL and GRE Programs as well as the research allocation of the Educational Testing Service and the College Board/ETS Joint Staff Research & Development Committee. We are delighted to be able to acknowledge this support. The testlet analyses were performed on a computer program that Zuru Du wrote as part of his doctoral dissertation (Du, 1998); we thank him for its use. Last, this manuscript profited greatly from careful reading of Dan Eignor, Catherine Hombo, and two anonymous referees who helped us to focus our arguments and also discovered one subjunctive verb that had escaped our attention. Last we are grateful to Pat Carey for helping us obtain the data and Marna Golub-Smith, whose sharp eyes found errors that others had missed and who thus helped us better understand the TOEFL data we fit.
iii
Table of Contents Page Introduction ............................................................................................................... 1 The Model.................................................................................................................... 3 The Results .................................................................................................................. 4 Listening Comprehension Results .................................................................. 7 Reading Comprehension Results..................................................................... 9 Information............................................................................................................... 12 Remaining Questions and Future Directions ........................................ 18 CAT, the Principal Use for the New Model.................................................. 20 References.................................................................................................................. 22
List of Tables Page Table 1
The structure of the data set............................................................. 4
iv
List of Figures Page Figure 1
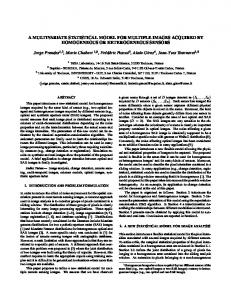
Distribution of the variance of the testlet effect for two kinds of TOEFL testlets.............................................................. 6
Figure 2
The discriminations for listening testlet items are underestimated when local dependence is ignored.................... 7
Figure 3
The difficulties for the listening items are well estimated even if dependence is ignored............................................................ 8
Figure 4
The guessing parameters for listening items are slightly overestimated when local dependence is ignored ....................... 9
Figure 5
The discriminations for reading comprehension testlet items are overestimated when local dependence is ignored .. 10
Figure 6
The difficulties for the reading comprehension items are well estimated even if local dependence is ignored................... 11
Figure 7
The guessing parameters for reading comprehension items are overestimated when local dependence is ignored.............. 12
Figure 8
Information curves for listening item 206.................................. 13
Figure 9
A distribution of information functions for listening item 206................................................................................................. 14
Figure 10 The information curve for listening item 206 is more platykurtic than suggested by the local independence model ...................................................................................................... 15 Figure 11 Weighted information functions.................................................... 16 Figure 12 Information from listening testlet 8.2 (items 206-210) ........... 17 Figure 13 Information from listening testlet 10.0 (items 231-240)......... 18
v
Introduction Implicit in the descriptions of the character of what TOEFL will become in the 21st century is the need for a new kind of psychometrics; a psychometrics that is aimed at more complex test items built to directly measure more complex behavior. Measuring more complex behaviors is commonly accomplished in many current standardized educational tests through tasks that are coherent groups of multiple-choice items based on a single stimulus. Such groupings, usually called testlets (Wainer & Kiely, 1987), are used for many reasons, principal among them are time and cost constraints. The basic idea is that the processing of the stimulus by the examinee requires a considerable amount of mental processing and hence time; therefore, by pairing such a stimulus with more than a single test item the marginal time for gathering additional information is reduced. Examples of testlets can be found in TOEFL’s reading comprehension section (the stimulus is the reading passage) as well as the listening comprehension section. Although it is well known that testlet items are not conditionally independent because of their reliance on a common stimulus, it is usually assumed they are; that is, given an examinee’s proficiency, the responses to items are independent. This incorrect assumption is made because it facilitates straightforward analyses of multiple-choice responses. Obviously, when multiple-choice items are composed into testlets, the assumption of conditional independence (CI) becomes more tenuous. Some reasons that have been offered for why testlet obtained responses violate CI are: subject matter expertise, misdiagramming of the stimulus, fatigue, etc. (Yen, 1993). The effect of this violation is that items that are nested within the same testlet will have a dependence structure that is not exhibited across items from different stimuli. It has been repeatedly shown (Sireci, Wainer, & Thissen, 1991; Wainer, 1995; Wainer & Thissen, 1996; Wainer & Lukhele, 1997a,b; Yen, 1993) that this dependence structure, if ignored by applying standard IRT models with a CI assumption, will result in an overstatement of precision of proficiency estimates as well as a bias in item difficulty and discrimination parameter estimates. In earlier research (Wainer & Lukhele, 1997a,b), we showed that the practice of ignoring the excess local dependence in TOEFL’s reading comprehension section yielded an overestimate of the section’s reliability that corresponded to a test 30 to 40 percent longer than it was. The bias in the estimation of listening comprehension’s reliability was somewhat smaller (6 to 13 percent too large) but still enough to be worrisome. How should a test composed of testlets be scored to avoid the biases that result from unmodeled local dependence? We believe that building extensions onto the framework of the psychometrics that has served us well for hundreds of years is a prudent strategy. This belief has led us to investigate one class of
1
extensions: a fully Bayesian approach to item response theory extended to cover coherent groups of items (testlets). Our initial investigations have yielded fruit in the form of a generalization of Birnbaum’s two-parameter model (Bradlow, Wainer, & Wang, 1999). This extension proved the practical viability of this approach. The second stage of this research developed the testlet generalization of Birnbaum’s three-parameter model (Wainer, Bradlow, & Du, 2000). The model, and a computer program that implements it, was tested within the context of simulations as well as on a GRE data set (Du, 1998). The results obtained were instructive, but, because the GRE is not yet a primarily testlet-based test, the full impact of the new model was not apparent. The nature of language testing is such that testlets are a natural format; reading and listening comprehension have traditionally been testlets. In addition, essays scored by more than a single judge on more than a single criterion are also naturally thought of as testlets. Thus, it is clear that TOEFL is an obvious candidate to be scored by the new model. There are other plausible alternative scoring models. In the past we have advocated using polytomous IRT models to score testlets (Sireci, Wainer, & Thissen, 1991; Wainer, 1995; Wainer & Thissen, 1996). This approach has worked well in the situations for which it is appropriate, but has two shortcomings: 1. Because it fits the total number correct obtained on the testlet, it loses whatever information is contained in the precise pattern of responses the examinee generates. 2. Because each examinee might have a different set of items associated with the same testlet stimulus (i.e., in reading comprehension, a different set of questions associated with the same passage), it is inappropriate if the test is administered adaptively. What is generally termed “linguistic ability” is, in fact, a complex mixture of interrelated proficiencies. Obtaining an accurate assessment of each of these proficiencies is difficult, time consuming, and expensive. To do such an assessment under plausible practical constraints requires that all information in an examinee’s responses be extracted, that the assessment instrument be administered efficiently (e.g., adaptively), and that the information obtained be combined in as optimal a fashion as possible. The testlet model that we used in this study is an important step toward fulfilling the first two of these. Optimal estimation of subscores is a separate topic, but an empirical Bayes approach has shown great promise in producing highly reliable subscores useful for diagnostic purposes (Wainer, Sheehan, & Wang, 2000).
2
The Model The three-parameter logistic model (3-PL) was proposed by Allan Birnbaum in 1968, and has the following mathematical form,
p( yij = 1) = c j + (1 − c j )
exp[ a j ( θ i − b j )] 1 + exp[ a j ( θ i − b j )]
(1)
where yij is the score for item j received by examinee i, and hence p(yij =1) is the probability that examinee i answers item j correctly θi is the trait value (e.g., ability or proficiency) of examinee i, aj denotes the discrimination parameter of the item j, bj is the difficulty parameter of test item j, and cj denotes the pseudo-chance level parameter of item j For a full explication of this model see the usual sources (e.g., Hambleton & Swaminathan, 1985; Lord, 1980; Wainer & Mislevy, 1990). The new testlet model adds a random effect to the logit of equation (1) that is an interaction of person i with testlet g(j), the testlet that contains item j. This model, formally, is
p( yij = 1) = c j + (1 − c j )
exp[ a j ( θ i − b j − γ ig( j ) )] . 1 + exp[ a j ( θ i − b j − γ ig( j ) )]
(2)
Estimates of the unknown model parameters were obtained by drawing samples from their posterior distributions via the Gibbs sampler (Gelfand & Smith, 1990). To implement the Gibbs sampler we drew, in turn, from the set of conditional distributions of each unknown parameter (or a subset of them) conditional on the previously drawn values of all other parameters and the data. After a determined number of complete cycles the Gibbs sampler obtains draws from the correct target posterior distribution, thus yielding proper estimates of the parameters of interest. The general framework for implementing the Gibbs sampler for IRT models was initially described for binary educational data in Albert (1992) and for the more general polytomous data setting in Albert & Chib (1993). This work was focused on the less general two-parameter model for which all conditional distributions to sample from are in closed form due to the availability of a natural conjugate structure. This is not true for the model in equation (2) because it includes a guessing parameter. The estimation of this model requires a more computationally-intensive procedure that samples over the full grid of parameter values. The details involved in using this procedure for the model in equation (2) are presented elsewhere (Du, 1998; Wainer, Bradlow, & Du, 2000)
3
and will not be repeated here. The key ideas to be kept in mind in interpreting this model are: 1. The three standard parameters (a, b and c) are identical in value and interpretation in this model as they are in the traditional 3-PL IRT model.
2. The testlet parameter γig( j) is a random effect and its sum (over examinees), within any testlet, is zero. It works its effect through its variance. If its variance is zero it means that there is no excess local dependence within that testlet; the items in the testlet are conditionally independent. As its variance grows, so too does the amount of local dependence.
The Results We fit pretest data for TOEFL testlets in reading and listening comprehension. The pretest calibrations were done on domestic sample sizes of approximately 2,000 examinees on the listening portion and about 500 on the reading. These multiple samples were connected to one another through a common (equating) portion which were the actual operational test items. The sample sizes for the operational items were about 27,000. All data were from the April 1998 administration. There were 50 13-item reading comprehension testlets and 36 listening testlets whose size was either 10 or 5 items. Although different examinee samples were administered different testlets, they all were administered the entire set of equating items. These were discrete for the listening comprehension items and testlets for the reading comprehension. The structure of the data set is shown in Table 1.
Table 1. The structure of the data set
Number of equating items
Reading Comprehension 49
Listening Comprehension 50
Number of testlets Number of items in testlets Total items
50 650 699
36 240 290
Estimation sample sizes 26,977 26,977
Equating items Median sample size per testlet
544
4
2,182
We normalized the parameterization by establishing the ability distribution as normal with mean equal to zero and standard deviation equal to one. The operational items were fit with the var(γ) set equal to zero and were used as the equating link among the different forms.1 This meant that the parameters for all testlet items were on the same scale without any further manipulation. The justification for using such an equating link lies not in the unidimensionality of the test, for the heterogeneous nature of TOEFL’s examinee population precludes that, but in the fact that whatever construct multidimensionality exists is only modestly related to the item format (see Schedl, Thomas, & Way, 1995, and especially the factor analytic appendix to that report which showed that the principal multidimensionality was what they called an “end of test factor” due to the speededness of the test). We also fit these data using the standard 3-PL model assuming conditional independence of all items using the computer program BILOG (Mislevy & Bock, 1983). We found, contrary to earlier findings (Wainer & Lukhele, 1997a,b), that the amount of local dependence was greater in the listening testlets than for the reading comprehension testlets. This was not due to the difference in the scoring model, for when we refit the data used by Wainer & Lukhele with the new model, we essentially duplicated their findings. We will discuss this apparent anomaly at the end of this paper. In Figure 1 is a schematic representation of the distribution of the variance of γ, in which the boxes represent the middle 50 percent of the estimated values of the variance of γ, the large dot in the center represents the median, and the extreme dots represent the largest and smallest values of the variance of γ.
1
This approach is appropriate for the purposes of equating, since equating uses primarily the difficulty of the equating items and the estimate of difficulty is essentially unaffected by the size of the testlet effect (Wainer, Bradlow, & Du, 2000). We used this approach because of a misunderstanding on our part of the character of the operational items (we believed, incorrectly, that they were all independent items). Were we to redo the analyses now we would estimate the var(γ) rather than fix its value at zero.
5
Figure 1
Box and whisker plots showing the distribution of the variance of γ for 50 reading comprehension testlets and 36 listening comprehension testlets.
As is evident, the amount of local dependence, as measured by the variance of γ, is both larger and more variable in the listening comprehension testlets than in reading comprehension. We have no explanation for this at this time, but the samples of both examinees and testlets were sufficiently large for us to judge that this is not a statistical artifact. We shall discuss the consequences of this amount of local dependence in the Information section. When local dependence is ignored, errors of estimation occur in the item parameters. These range from being negligible for difficulty to more substantial for discrimination and guessing.
6
Listening Comprehension Results In Figure 2 are the estimated discriminations using the testlet model (estimated using a Gibbs Markov Chain Monte Carlo procedure) for the listening items. The filled circles represent independent items, the open circles the testlet items. The Gibbs estimates are compared with those obtained from BILOG. We note that the independent items are estimated almost identically (r = 0.97) with the two procedures (as they should be), but the discriminations for the testlet items are somewhat underestimated by BILOG.
Figure 2
A comparison of the estimated values of the discrimination parameter (a) for listening comprehension items, both testlet-based and independent. Estimates either account for local dependence (Gibbs a), or ignore it (BILOG a).
In Figure 3 are the estimated difficulties for the listening items. The estimates for both independent and testlet items are essentially identical (r = 0.99) with the two procedures. This is happy news, suggesting that item difficulty estimates are unaffected by local dependence and that current procedures are sufficient for this purpose.
7
Figure 3
A comparison of the estimated values of the difficulty parameter (b) for listening comprehension items, both testlet-based and independent. Estimates either account for local dependence (Gibbs b), or ignore it (BILOG b).
Figure 4 shows the estimated value of the guessing parameter for the listening items. As with the other parameters the independent items are estimated almost identically (r = 0.96) with the two procedures. It appears that the value of the guessing parameter is overestimated when local dependence is ignored.
8
Figure 4
A comparison of the estimated values of the guessing parameter (c) for listening comprehension items, both testlet-based and independent. Estimates either account for local dependence (Gibbs c), or ignore it (BILOG c).
Reading Comprehension Results In Figure 5 are the estimated discriminations for the reading items. As before, the independent items are estimated almost identically (r = 0.98) with the two procedures, but this time the discriminations for the testlet items are somewhat overestimated by BILOG. We have no explanation for this at this time.
9
Figure 5
A comparison of the estimated values of the discrimination parameter for reading comprehension items, both testlet-based and independent. Estimates either account for local dependence (Gibbs a), or ignore it (BILOG a).
In Figure 6 are the estimated difficulties for the reading items. As with listening, the estimates for both independent and testlet items are essentially identical for the two procedures.
10
Figure 6
A comparison of the estimated values of the difficulty parameter (b) for reading comprehension items, both testlet-based and independent. Estimates either account for local dependence (Gibbs b), or ignore it (BILOG b).
Finally, in Figure 7 the estimated value of the guessing parameter for the reading items looks just like the parallel result for listening. The independent items are estimated almost identically (r = 0.97) with the two procedures and the guessing parameter is overestimated when local dependence is ignored.
11
Figure 7
A comparison of the estimated values of the guessing parameter (c) for reading comprehension items, both testlet-based and independent. Estimates either account for local dependence (Gibbs c), or ignore it (BILOG c).
Information Thus far we have shown that there are small but reliable biases in the estimated values of the item parameters of TOEFL testlet items when conditional independence is incorrectly assumed. Avoiding these biases is in itself a sufficient reason for adjusting the estimation method. However, it is critical to indicate the extent to which inferences, based on these incorrect values, are incorrect. Since inferences from any test typically, and most importantly, focus on the estimate of the examinee’s proficiency ( θˆ in the model), let us focus our discussion on the accuracy of such estimates. The accuracy of the estimate of the parameter θ is commonly described by the model-based standard error. For a variety of reasons, not the least of which were the cumbersome calculations required to determine the standard error of a composite, Fisher (1922) preferred to use a transformation of standard error he termed “information.” Fisher Information is the inverse of the square of the standard error. When the standard error is small, information is large, and vice versa. Fisher Information is a staple of item response theory and is yielded directly from the asymptotic value of the likelihood (see Wainer & Mislevy, 1990, p. 78).
12
How does the new model affect an item’s information function? The short answer is that in general this model lowers it for the group that is administered a testlet which contains that item. We can easily understand why this is the case through consideration of the formula for information (from equation 3 in Wainer, Bradlow, and Du, 2000)
I( θ i ) = a
2 j
(
exp( t ij ) 1 + exp( t ij )
)
2
1 − cj c j + exp( t ij )
(3)
where t ij = a j ( θ i − b j − γ id ( j ) ) for the testlet d(j) that includes item j. The key element in equation (3) is the logit tij. The addition of the testlet parameter γ merely relocates the mode of the information function. For example, in Figure 8 is shown the information curves for a more difficult than average listening item. The dashed curve represents what we would have thought the information was if we ignored the testlet effect. The solid line shows the actual information for a typical examinee for this testlet-based item. Note that the amount of information that is contained in the item is the same; it is just translated by an amount equal to γ to the right for this examinee.
Figure 8
The information curves for listening comprehension item 206 if we treat it as an independent item (dashed curve) or if it has a value of γ=1.1 (solid curve). The information is the same for both, but it is shifted to the right by the value of γ for the curve generated by the testlet model.
13
But all examinees have their own information curves. Listening item 206, depicted in Figure 8 yields a sheaf of information curves that correspond to a distribution of γ that has a mean of zero and a variance of 1.14. A selection from that sheaf of curves is shown in Figure 9 (once again the dashed line is the information curve corresponding to a zero testlet effect).
Figure 9
A sheaf of information curves for listening comprehension item 206 showing the distribution obtained when γ has a mean value 0.0 and a variance of 1.14.
We can summarize the information in item 206 by averaging across all of the curves shown in Figure 9. When we do this the spread out character of the diversity of information functions generated by the nonzero variance of γ means that the resulting information curve will have the same area under it (the same total information) as the curve generated by ignoring the local dependence, but it will be more platykurtic; more spread out. Such a curve is shown in Figure 10.
14
Figure 10
The information curves for listening comprehension item 206 if we treat it as an independent item (dashed curve) or if we average the entire sheaf of curves shown in Figure 9 (solid curve). The information is the same for both, but is more platykurtic (flatter) for the curve generated by the testlet model.
We are almost done examining the differences between these two approaches. The two curves in Figure 10 both depict the same amount of information. The key difference is that the curve that takes into account the local dependence among the items in item 206’s testlet is more platykurtic. If the areas under these two curves are the same, how does the model (correctly) depict the fact that there is less information in a testlet-based item than would be expected under conditional independence? The answer is that when we averaged the sheaf of curves we ought to have weighted those curves near θ = 0 more than those at more extreme values, since there are more people in the region of θ = 0. In effect this means integrating the information function given in equation (3) over the ability distribution. When this is done we find the anticipated result; when the conditional dependence is fit, we find that there is less information. This result is shown in Figure 11.
15
Figure 11
The weighted information curves for listening comprehension item 206 if we treat it as an independent item (dashed curve) or as a testletbased information curve (solid curve). Both curves are weighted by the Gaussian proficiency distribution (normal with mean zero and variance one). The information is overestimated for the curve generated by the model that ignores local dependence.
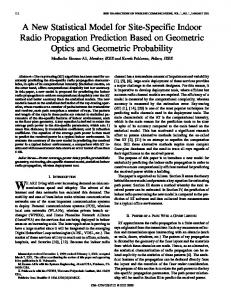
Of course what we have shown in Figure 11 is just for a single item; in this case item 206. If we repeat this for all of the items in a testlet and sum them, we obtain the testlet information curve. In Figure 12 are the information curves for listening testlet 8.2 which is composed of five items, numbers 206 through 210. As before, the dashed curve reflects the information reported by the model if conditional dependence is ignored. The solid curve is the more accurate depiction of the amount of information in this testlet. This shows that when γ is 1.14, a relatively large value in this data set, information will be overestimated by as much as 15 percent when proficiencies are in the 0 to 1 logit range if conditional dependencies are ignored; it will be underestimated for lower proficiency levels.
16
Figure 12
The weighted information curves for listening comprehension testlet 8.2 if it is treated as a set of independent items (dashed curve) or as a testlet (solid curve). The information is overestimated for the curve generated by the model that ignores local dependence by as much as 15 percent for some ability levels. Testlet 8.2 has a large value of γ (= 1.14).
By way of contrast, listening testlet 10.0, which is composed of items 231 through 240, has a low level of conditional dependence (variance of γ = 0.19). The information curves for this testlet are shown in Figure 13 and shows, as expected, almost no difference.
17
Figure 13
The weighted information curves for listening comprehension testlet 10.0 if it is treated as a set of independent items (dashed curve) or as a testlet (solid curve). The information is about the same for the two test scoring models. Testlet 10.0 has a small value of γ (= 0.19).
Remaining Questions and Future Directions This initial examination of TOEFL testlets using a scoring model especially built for this circumstance has provided some insights and provoked some new questions. We have seen what is the range of conditional dependence within TOEFL reading and listening testlets as they are currently written (Figure 1). We have seen that while conditional dependence seems to have almost no effect on the estimation of item difficulty it tends to yield an overestimate of the guessing parameter and a bias on the estimation of discrimination (Figures 2-7). We have also seen that ignoring conditional dependence has an effect on testlet information that, within this sample of testlets, is about 15 percent too high under the worst of circumstances (Figures 12 and 13).
18
The biggest question that remains is “why?” 1. Why do some testlets have much higher conditional dependence than others? 2. Why does the bias in the estimation of discrimination shift direction from reading comprehension to listening? 3. Why was there greater conditional dependence among these listening testlets than among these reading comprehension testlets when an earlier study (albeit of different testlets and using a different methodology) found exactly the opposite? Answering these questions completely is beyond the range of the current investigation, but that does not diminish their importance. The answer to the first and third questions requires an examination of the content and physical characteristics of the testlets to see what causes excess conditional dependence. There are some obvious characteristics (e.g., ratio of passage length to number of items) but since those are often tightly controlled we must also look into deeper characteristics of the testlet. From a recent (November 1998) report by Sheehan, Ginther, & Schedl, some plausible candidate characteristics are: •
degree of redundancy in the passage
•
existence of overt markers in the passage to guide examinees
•
extent of metaphorical language.
Obviously there are other possible characteristics that might be helpful predicting within-testlet dependency, but these three surely would provide us with a beginning. We understand much more about what makes an item hard than we do about what makes it dependent. This is surely because, from the beginning, all item-response models have parameterized difficulty, but until recently we have not had a formal model that parameterizes dependence. Now that such a parameter is available we can study what causes it more rigorously. Our reanalysis of the same TOEFL data set, that previously showed reading comprehension having greater dependence than listening comprehension with the new model confirmed that earlier finding. It also eliminates mode of analysis as a possible cause of the anomaly. We must look elsewhere for an explanation. A plausible one is that there is great variability in the amount of dependence and what we previously observed was due to that. If this is true, we will need to fit many more data sets to fully comprehend the distribution of dependence as a function of testlet type. The current results, based as they are, on many more 19
testlets, provide a somewhat more sturdy estimate of the likely direction of the difference. But that still does not tell us why. The answer to that will require a deeper linguistic analysis. The second question, the direction of the bias in the estimation of item discrimination, might also be illuminated through the study of testlet characteristics. The key difference will be the dependent variable. For the first and third questions it will be var(γ) and in the second it will be a. CAT, the Principal Use for the New Model The new testlet model stated in equation (2) can be used as a general IRT model for dichotomous items. When items stand alone (“discrete” is a common term used for an item that is not part of a testlet) the testlet effect [var(γ)] will be zero. When items are part of a testlet, their conditional dependence will be modeled. This approach has some advantages over traditional methods which fit polytomous models to testlet items. We suspect that in most practical situations the advantage in increased information will be small. Certainly this is what we have observed on the limited number of data sets we have fit using both models. The interpretative advantage the model yields by providing familiar parameters is one that is hard to quantify, and we will not try. But the big advantage is in adaptive testing when testlets are built on-thefly. We know that conditional independence is not violated by the mere fact of using an adaptive item selection algorithm (Mislevy & Chang, 1998), but this is not true if the items selected are a part of a testlet. Indeed this is the circumstance that we had in mind when we developed this model in the first place. It is also the reason why we did not compare its performance with a polytomous alternative in this paper. There simply is no way for a polytomous model to be built that would suit this circumstance. To be more specific, suppose a testlet is constructed that has a common stimulus (e.g., a reading passage) and 15 or so items relating to that stimulus. The items may vary widely in difficulty, but because of the interdependency among them, after some subset of them have been administered, the amount of information obtained from an examinee begins to reflect the law of diminishing returns. Thus, it is hoped that the item selection algorithm can choose a suitable subset of the items for any particular examinee. Let us say that diminishing returns calculations suggest testlets should contain between five and seven items. This means that if we use a polytomous model to characterize each 15 15 15 testlet, we will need to calibrate + + = 14, 443 testlets. A daunting 5 6 7 task. Moreover, the testlet selection algorithm will have to decide, on the basis of information available before picking one, which of these 14,443 testlets is most suitable. While such a methodology is conceivable, its complexity is likely to
20
doom it from the start. How much easier to make up the testlet on the fly, as per current practice, and then be able to score it properly. We believe that, for this task, there are no current competitors to the class of models we have employed.
21
References Albert, J. H. (1992). Bayesian estimation of normal ogive item response curves using Gibbs sampling. Journal of Educational Statistics, 17, 251-269. Albert, J. H. & Chib, S. (1993). Bayesian analysis of binary and polychotomous response data. Journal of the American Statistical Association, 88, 669-679. Birnbaum, A. (1968). Some latent trait models. Chapter 17 in F. Lord & M. Novick’s Statistical Theories of Mental Test Scores. Reading, Mass.: Addison Wesley. Bradlow, E. T., Wainer, H., & Wang, X. (1999). A Bayesian random effects model for testlets. Psychometrika, 64, 153-168. Du, Z. (1998). Modeling conditional item dependencies with a three-parameter logistic testlet model. Unpublished doctoral dissertation, Columbia University. Fisher, R. A. (1922). On the mathematical foundations of theoretical statistics. Philosophical Transactions of the Royal Society of London A, 222, 309-368. Gelfand, A. E. & Smith, A. F. M. (1990). Sampling-based approaches to calculating marginal density. Journal of the American Statistical Association, 85, 398-409. Hambleton, R. K. & Swaminathan, H. (1985). Item response theory: Principles and applications. Boston: Kluwer. Lord, F. M. (1980). Applications of item response theory to practical testing problems. Hillsdale, NJ: Lawrence Erlbaum Associates. Mislevy, R. J. & Bock, R. D. (1983). BILOG: Item and test scoring with binary logistic models [computer program]. Mooresville, IN: Scientific Software. Mislevy, R. J. & Chang, H. H. (1998). Does adaptive testing violate local dependence? ETS Research Report 99-33. Princeton, NJ: Educational Testing Service. Samejima, F. (1969). Estimation of latent ability using a response pattern of graded scores. Psychometrika Monographs, (Whole No. 17). Schedl, M., Thomas, N., & Way, W. (1995). An investigation of a proposed revision to the TOEFL test. TOEFL Research Report No. 47. Princeton, NJ: Educational Testing Service.
22
Sheehan, K. M., Ginther, A., & Schedl, M. (1998). Understanding performance on the TOEFL reading comprehension section: A tree-based regression approach. Paper presented at the annual conference of the American Association of Applied Linguistics, Stamford, CT. Sireci, S. G., Wainer, H., & Thissen, D. (1991). On the reliability of testlet-based tests. Journal of Educational Measurement, 28, 237-247. Wainer, H. & Kiely, G. (1987). Item clusters and computerized adaptive testing: A case for testlets. Journal of Educational Measurement, 24, 185-202. Wainer, H. & Lukhele, R. (1997a). How Reliable is the TOEFL Test? TOEFL Technical Report No. 12. Princeton, NJ: Educational Testing Service. Wainer, H. & Lukhele, R. (1997b). How reliable are TOEFL scores? Educational and Psychological Measurement, 57(5), 749-766. Wainer, H. & Thissen, D. (1996). How is reliability related to the quality of test scores? What is the effect of local dependence on reliability? Educational Measurement: Issues and Practice, 15(1), 22-29. Wainer, H. (1995). Precision & differential item functioning on a testlet-based test: The 1991 Law School Admissions Test as an example. Applied Measurement in Education, 8(2), 157-187. Wainer, H. & Mislevy, R. J. (1990). Item response theory, item calibration, and proficiency estimation. Chapter 4 in Wainer, H., Dorans, D.J., Flaugher, R., Green, B. F., Mislevy, R. J., Steinberg, L., & Thissen, D. (1990). Computerized adaptive testing: A primer. (Pps. 65-102). Hillsdale, NJ: Lawrence Erlbaum Associates. Wainer, H., Bradlow, E. T., & Du, Z. (2000). Testlet response theory: An analog for the 3-PL useful in adaptive testing. In Computerized adaptive testing: Theory and practice (W. J. van der Linden & C. A. W. Glas, Eds.). Boston, MA: Kluwer-Nijhoff. Wainer, H., Sheehan, K., & Wang, X. (2000). Some paths toward making Praxis scores more useful. Journal of Educational Measurement, 37, 113-140. Yen, W. (1993). Scaling performance assessments: Strategies for managing local item dependence. Journal of Educational Measurement, 30, 187-213.
23
®
TOEFL is a program of Educational Testing Service Princeton, New Jersey, USA
57906-008519 • Y51M.7 • Printed in U.S.A. I.N. 989083