It is shown how the CRT-display of an ordinary personal computer can be ..... course, the sensor must then be mounted at a fixed distance from the screen to ..... The facilities put at my disposal within the Science Laboratory at Department of ...
Using a Personal Computer as a Visual Colorimeter Pehr Sällström Department of Physics, Stockholm University, Sweden
Abstract It is shown how the CRT-display of an ordinary personal computer can be used as a simple visual colorimeter. By help of this anybody wanting to learn about the principles of colorimetry can get a direct experience of colour matching and what is meant by "measuring colour". The set up has been tested on a group of students within a course in the science of light and colour.
Background Colorimetry is a method of specifying, in numerical terms, the optical properties of light sources, transparencies, materials, from the point of view of their capacity to make up our coloured environment. It is based on fundamental insights about human colour vision, foreshadowed by Isaak Newton, Thomas Young and others, and developed and summed up into an elegant theory by the young genius James Clerk Maxwell towards the end of the nineteenth century. Later on colorimetry was standardized by an international optical committee (C.I.E. - "Commission Internationale d'Eclairage") and adopted as the ultimate reference for the standardization of colour materials, in connection with various techniques for colour production and reproduction (dyeing of textiles, painting, printing, photography, video, computer graphics etc.) as well as in connection with colour vision research. In view of this broad spectrum of applications of the CIE-system, it seems important that people, touching upon colour issues in their work, have an idea about the general principles behind this standard - including awareness of what it stands for and what not. If two samples are reported as having the same colorimetric co-ordinates X,Y,Z - what can be concluded from that? In education, colorimetry is often treated as a theoretical subject, the X,Y, Zvalues being the result of calculations involving certain functions, given in numerical form. Even more: the calculations are usually performed automatically by the measuring instrument, which just reads out the X,Y,Z-values, together with certain other variables, calculable from these (such as x,y,L, correlated colour temperature, u,v, L,a,b etc.). As a consequence of this, colorimetry has come to be regarded as difficult and boring. However at the very bottom colorimetry is based on subjective visual experiences - so called "colour matching". Empirical data lie behind the numerical functions used in the automatized procedures. Thus, to get an intuitive understanding of colorimetry, making it possible to appreciate the use of the chromaticity diagram and the X,Y,Z-values, it is recommendable for educational purposes to use a visual colorimeter of some kind, so that the students have an opportunity to experience what is meant by saying that two different colour stimuli are chromatically equivalent. It turns out that the colour monitor of an ordinary PC is an excellent means for that end. 1
The idea behind colorimetry Addressing the uninitiated reader, I should like to say a few words about the basic ideas behind the system of colorimetry. In fact, colorimetry can be regarded as an advancement of photometry. So, let me start by touching upon photometry. Photometry How can we compare the strength of different light sources? Well, this can be done, in principle, by comparing the illumination they give on a surface under identical geometrical conditions. So, let us imagine an arrangement of the kind sketched in figure 1. A prismatic body, with two identical white surfaces, mounted at right angle towards each other and with a sharp edge, is placed so that each one of the sources, to be compared, illuminates one of the surfaces. The observer looks through a tube at a region around the edge. Thus in general he will see two half-fields: To the left and to the right are the surfaces illuminated by the one and the other illuminant. If the illumination on one side is weaker than that on the other, this is seen as a difference in lightness of the two halves of the circular field. When the illuminations are exactly equal, the edge (that is, the border between the two halffields) virtually disappears. If the geometrical conditions on both sides are identical, this condition of perfect match means that the two light sources have the same strength.
Figure 1. Arrangement to compare light sources by visual matching
Thus, we adopt the same method of measurement as the one in the paradigm case of using a balance to measure the weight of material bodies. The matching apparatus and procedure described can be regarded as a kind of "light-balance". Given this "light-balance", we can construct a system for measuring the strength of sources, as follows. Choose some well-defined source as the standard unit. This source is said to have strength 1. Using the balance we can then select a number of identical sources, all having strength 1. Next, apply the principle of superposition of illuminations - which says that the illumination resulting from two independent sources is just the sum of the illumination from the one and the other. According to this principle, two identical sources will give an illumination twice as strong as
2
one of them. So if a certain light-source X turns out to be balanced by say 3 unit sources, then X can reasonably be said to have strength 3. By studying how the illumination varies with distance to the source (which results in the well-known inverse square law) one can use ratios of measured distances to get the source strength, when this is not a multiple of the given unit. From photometry to colorimetry There is one evident short-coming with this method of "measuring" light. In many cases it turns out that it is impossible to bring the two halves into match, because they have different hues. For instance one is blue, the other one yellow. Thus, as a matter of fact only sources which give illuminations of the same colour (hue and saturation) can be matched. Or else, you have to accept imperfect matching which implies an uncertainty in the measurement. (Let be, that you still get a rough measure of the strength, sufficient for many practical purposes.) A way of tackling the problem would be to use a number of standard sources of different hues. Say that we define two standard sources: one is yellow, the other one blue. Then, by adjusting the proportion between them (for instance by adjusting the distance from the illuminated surface for each one of them independently) the mixture can be made to match a given unknown source X. Not even this is perfectly true, however, because there may remain a hint of red or green, influencing the appearance of the two halves of the test field. We have to add a third standard source, to take care of this discrepancy. This turns out to be sufficient - at least to a high degree of approximation. Say that we choose an orange-red, a yellow-green and a blue standard source. Then virtually any light source can be matched by some mixture of these three "primaries". (In order to be able to match certain extreme sources, such as lasers, you have to use a generalized matching procedure, invented by Maxwell. See appendix) The fact that the use of three standard sources is sufficient, is referred to as the principle of trichromaticity. This is one of the governing principles behind human colour vision. We have now arrived at the starting point for building up a system of colorimetry. It is a question of defining three standard sources and a matching procedure, like the one sketched above. (The fact that the matching procedure can be automatized by help of photoelectric devices is an important simplification in practice, but does not change anything in principle.) Choosing homogenous light of three welldefined wavelengths as reference, light of a number of other wavelengths can be measured (using the method of Maxwell). As a result three matching functions (one for each of the reference lights) are obtained. Using these, the colorimetric co-ordinates of an arbitrarily given light of any spectral composition can be calculated by weighted integration over wavelength. Thus the C.I.E. system consist essentially of the three matching functions, representing a "standard observer". It is empirically based on matching performed at 2 degrees of visual angle of the test field.
3
For certain theoretical and practical reasons the finally calculated values X,Y,Z of the C.I.E. system (which are always positive) do not refer to the original reference system (based on the use of homogenous light at three wavelengths). In fact, it does not refer to any real, physical, standard sources what-so-ever. But that does not matter, since measurements done with a physical set of reference sources, can - according to basic principles - be transformed linearly into the X,Y,Z- reference system. Chromaticity A light source (or an illumination falling onto a white screen) may vary considerably in terms of strength, while maintaining one and the same hue and chromaticness (saturation, or purity). If the hue aspect is the interesting one it is only the relative values of X,Y,Z that count. The trivial dimension of "strength" (i.e. the absolute level of illumination) has to do with the distance from source to illuminated surface, whereas the remaining two dimensions, called the chromaticity, has to do with the particular kind of light source involved and the kind of media the radiation has to pass on its way from the source. Chromaticity (x,y) is defined by the formulae: x = X/(X+Y+Z) and y = Y/(X+Y+Z) As a measure of the dimension of "strength" (i.e. the luminance of the test field) Y is used. It was defined by C.I.E. in such a way as to correspond to traditional photometry, giving illumination in units of lux. The measurement of colour samples Not only light sources, but material colour samples as well, can be measured in terms of the system of colorimetry. It follows from the principles outlined above that this presupposes a certain illumination, falling onto the sample. (Note that it is always light fluxes that are related by the matching procedure!) That is to say: it is only a colour sample in conjunction with a given illumination, that can be characterized by a certain X,Y,Z-triple. As soon as that same sample is illuminated by some other kind of light source, the X,Y,Z-values will in general change more or less. So, in this case you also need a set of "standard light sources". Standard source A corresponds to incandescent light; standard sources B and C to different aspects daylight. There have further been defined (numerically) a series of "standard daylights", D65 being the most commonly used when specifying samples nowadays. For unambiguous measurement the geometry of the situation must also be standardized, since the X,Y,Z will depend on the orientation of the surface relative to the light source and the observer. Usually chromaticity (x,y) and luminance Y are preferred to (X,Y,Z) when specifying the sample - or corresponding variables of recent reference systems, such as (L,u,v) or (L,a,b). Consult the Appendix for further details.
4
The use of a CRT-display as a visual colorimeter Since the CRT-display (Cathode Ray Tube display) used in PC monitors, as well as television sets, uses colour mixing by superposition of the light emitted by three given phosphors, it can tentatively be used as a set of standard sources for colorimetry. The three phosphors are referred to as R (orange-red light), G (yellow-green) and B (deep-blue). A patch on the screen, where only the R and G phosphors emit radiation, is seen as yellow. If B is added, with successively increasing strength the patch becomes a less saturated yellow, finally white or even changing over into bluish white. Analogously, G and B together form colours such as cyan, light blue, turquoise, bluish-green and pure green (i.e. a green colour, that is neither yellow-green nor blue-green). R and B together make up purple, violet and pure red (a red colour that is neither purple-red nor orange-red). Colour temperature of an illumination If you want to compare the visual radiation emerging from the CRT-screen with the radiation from some other light source, you can use the same matching procedure as the one outlined above. That is you let the two light fluxes fall as illumination on two identical white surfaces, one oriented towards the screen, the other one towards the source to be measured. You then arrange it such that you can observe the corner where the two illuminated surfaces meet as a sharp boundary between two fields:
PC-monitor
observer
This is a way of determining the correlated colour temperature of an illumination or a light source - given that you have calibrated your CRT-monitor. (More about calibration below). Colour samples If you have colour samples which you want to measure relative to the RGBsystem of your monitor, it is a slightly more complicated task. In this case, you have to arrange it such that you can observe, side by side, a part of the screen and the sample. This is a bit tricky, because at one and the same time the sample must be illuminated and the screen not illuminated from outside. 5
To solve this practical problem, you can mount a piece of cardboard, with a small hole in it, a couple of inches in front of the surface of the monitor screen. Through the hole a small area of the screen is seen. Then the sample is held so that it partly covers the hole and its colour can be directly compared with the colour of the display screen. (See photographs, figure 3!) The necessary illumination on the sample is arranged as falling obliquely from one side, so as to avoid it from falling on the observed spot of the display screen behind.
Fig 3. An attachment to a computer screen, which makes it possible to use the computer as a visual colorimeter. The upper picture shows its framework from behind. It is made from pieces of centafoam glued together to form a rigid structure. Below it is fitted onto the monitor. At the centre you see the small opening at which the colour matching is done.
6
Matching procedure Next, you have to be able to vary the colour of the patch on the display screen. This is accomplished by varying the steering voltage to the three electron guns, exciting the phosphors, R, G and B respectively. For this purpose you have to use some computer program, that controls the palette, for instance as a result of your pressing one or other of the keys on the computer keyboard. The DAC ("Digital to Analogue Converter") palette used in standard 256 colour SVGA screen modes has 18 bits per colour, giving you 64 excitation levels for each channel. Thus you have at your disposal 64x64x64 = 262144 different nuances to choose among. For educational purposes, this seems to be optimal. You can rapidly move around in colour space and position yourself with accuracy. (For fine adjustment of certain matches it would be desirable to have access to a 24 bit DAC palette which gives 256 levels per channel and thus almost 17 million combinations. The ideal would be a program which allows you to toggle between 64 and 256 levels.) By making a note of the digital code for the excitation levels of R, G and B respectively, at match, you get a triple of integers (r g b) which denotes the position of the measured colour sample in the RGB-system. So far this is, so to say, a private system of colorimetric measurement. It makes it possible for you to compare different samples by help of your computer. In order to make more generally compatible measurements, however, you have to calibrate your system against some standard. The usual one is the above-mentioned C.I.E. system. Calibration To be able to calibrate the particular reference system of your PC against the C.I.E. standard reference system you have to know a number of facts about the PC and particularly its graphics driver and monitor. 1) You have to know the chromaticities (x,y) for R, G and B, pertaining to the three phosphors of your screen. In addition to this, you have to know the whitepoint (or colour balance), that is (x,y) for the case when all three phosphors are fully excited, in other words at (63 63 63), or (255 255 255) in case of 8 bit DAC. 2) You have to know the relationship between the digital code (r g b), used to set up the video signal that governs the excitation of the phosphors, and the intensity of the emitted radiation, as measured according to the basic conventions for photometry, described above. In general this relationship is not linear. An example is shown in figure 4. For a monitor of good quality the three processes should follow the same curve. The diagram tells us that, in this case, half of the maximum emission of any of the phosphors is obtained at excitation level 46. The relative excitation functions can be determined by help of a photometer. Of course, the sensor must then be mounted at a fixed distance from the screen to give a proportional measure of the emitted radiation.
7
1 0.9 0.8 0.7 0.6 0.5 0.4 0.3 0.2 0.1 0 0
8
16
24
32
40
48
56 64
Figure 4. Relative excitation function for the primaries R,G,B. Horizontally the digital code for the level of excitation. Vertically the relative luminance of a small area at the centre of the screen.
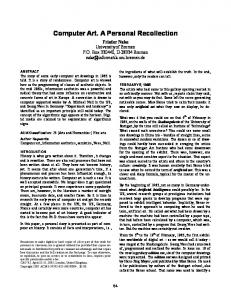
Given all these data, a transformation can be set up, to take our measurement in terms of (r g b) into the (X,Y,Z) of the C.I.E. system, and further into (L,u,v) or (L,a,b) if you prefer that. The formulas are given in the appendix. Observe that the excitation function is valid for a given (and optimal) setting of the brightness and contrast controls on the screen. Take care to use the same settings when the screen is used as visual colorimeter as when the excitation functions were measured! The light emitted from colour CRTs varies considerably from one part of the screen to another. This fact does not need to bother us, however, since we keep to a small area at the centre of the screen. But there are other factors that may influence the gamut of colours. If the brightness control is set to high, you loose the dark nuances. It should be adjusted so that you do really get a true "black" at the excitation code (0 0 0). On the other hand the low excitations, such as (2 2 2) must be faintly visible against the black. The contrast control may very well be set at high values, but you must avoid saturation, i.e. that the excitation function curve tends towards an S-shape. Another effect of too high contrast level (or bad focusing of the electron beams) is over-spread between the three channels R, G and B, which should ideally be completely independent. (For a thorough discussion of the technical and colorimetric properties of the colour CRT, see Cowans article.) Chromatic equivalence classes How do the three primaries R, G and B look, if you see them one at a turn? Well, to be precise, R is orange-red, G is yellow-green and B is just blue; not light blue, but perhaps rather what Newton called indigo. On the other hand, what do they look like from the point of view of physics? The relative spectral energy distributions of the three phosphors of a typical computer monitor - as measured by help of a Spectra Scan photometer with 8 nm resolution - are shown in figure 5. As you see, the distributions are quite broad, and partly overlapping. The G emission, in fact, extends more or less over the whole of the visible range. Its
8
maximum lies about where the sensitivity of the eye is known to be greatest (i.e. at 555nm) Because of this, the luminance of the screen is mainly governed by G.
Spectral power distributions of the radiation from the three phosphors B,G,R of an ordinary CRT-monitor, as measured by a Spectra Scan photometer
Interestingly enough, the power distribution of R at closer scrutiny turns out to be a line spectrum. This can be seen if you look at a portion of the screen through a hand spectroscope, colour set at (63 0 0). The lines are positioned at about 630 and 620 nm, together with faint lines at about 590 and 540 nm and further down, these latter ones making the emitted light less red than it should else have been. Any light, emitted from the screen, has an SPD ("spectral power distribution") which is simply a linear combination of these three curves. Due to the principle of trichromaticity this set of SPD:s can be used to represent a huge part of the totality of all physically possible SPD:s. Each combination thus corresponds to a great number of SPD:s, all of which it might replace. Colour matching means grouping all spectral distributions into equivalence classes. This particular partitioning into equivalence classes, is a characteristic of human colour vision. Each class can be represented by any of its members - in our case a particular combination of R,G,B.
Limitation of the RGB-system I said "a huge part of", since there are quite a number of lights that cannot be matched by any combination of R,G and B. These are the lights that are spectrally purer than the three primaries. For instance, the deep ruby red colour of a laser at 630 nm cannot by far be matched on a computer screen! But there are also intense colours of paints, pigments, textile dyes and flowers which cannot be matched that is, cannot be reproduced on any electronic video screen based on threeprimaries-mixing. In the colorimetric XYZ-space R,G and B can be represented as vectors, spanning a triangular pyramid. All lights that can be replaced by combinations of R, G and
9
B are represented by points inside this pyramid. Points outside of it represent lights that cannot be replaced by any combination of the three primaries. If we look upon the issue in terms of chromaticity (defined by the equations above) the three primaries are represented by three points, spanning a triangle in the chromaticity diagram. All possible combinations of the primaries lie within this colour triangle. (See figure 6!) It is alternatively called the colour gamut area of the RGB-system. By choosing spectrally pure lights as primaries, the gamut area can be made bigger, but never such as to include all possible lights. However, as long as we keep to naturally occurring lights - which do generally have quite broad SPD:s - the RGB-system is a good compromise.
10
Implementation of the idea of a PC based visual colorimeter The idea outlined above has been implemented at the Institute for Physics at Stockholm University. Four computers were temporarily changed into "visual colorimeters" - one of them is seen in figure 3. The procedure was tested as an item of the curriculum for a general 5 weeks course on the theory of light and colour. The pupils, being higher degree students at the university, came from various disciplines, mainly history of art, but also philosophy, architecture and design, as well as mathematics, physics, geology and astronomy. Preliminaries Four attachments were made of centafoam, giving a rigid, light-weight structure, that could easily be mounted on the computer monitor. They were designed to fit onto the monitors of the Dell computers, used in the Science laboratory at the Institute of Physics. (See figure 3!) The electric light fittings at the ceiling of the room were equipped with fluorescent tubes of the Daylight kind and high colour rendering index (Osram Lumilux de Luxe 12, Ra = 97, nominal correlated colour temperature 5400 K). The room was solely artificially lighted. Illumination fell onto the screens of the "colorimeters" mainly obliquely from above. As colour samples to be matched a set of 8 chips were chosen from the NCS colour atlas. (Table 1) In addition to these, a chip of white carton was used as "white reference". The luminance of this during the measurements, in absolute terms, was 80-90 cd/m². colour name
NCS-code
chromaticity x y
white yellow orange red magenta blue cyan green yellow-green
-------0550 -Y10R 0560 -Y50R 1070 -R 2050 -R40B 2065 -R90B 1050 -B30G 1060 -G 2060 -G50Y
0.350 0.450 0.509 0.547 0.380 0.193 0.252 0.286 0.400
0.361 0.448 0.396 0.327 0.274 0.219 0.347 0.459 0.505
Relative luminance 1.000 0.742 0.471 0.201 0.205 0.132 0.385 0.371 0.355
Computer program To be able to vary the colour of a patch on the CRT-display use was made of the computer program "RGB 1.1", developed by the author in collaboration with J.A.M.Production Ltd. This is an educational interactive program, consisting of a number of tableaux, demonstrating various psycho-physical phenomena - such as afterimages, simultaneous colour contrast, brilliance etc. It does also include a tableau intended for use of the display as a visual colorimeter. 11
In this program, the (r g b) for a colour patch at the centre of the screen is adjusted by help of the keys R, G, B (and T, H, N) to increase (or decrease) the level of excitation of respective phosphor. When a match is considered satisfactory is pushed and then the (r g b) code is stored and the computer ready for the matching of next sample. At the end of the session, the operator pushes S, with the result that the data are stored as a file on the hard disc. Each matching series may contain up to 64 samples and up to 8 separate sessions are automatically given different names when stored away. The data files were used as input to a small program, written as a page in Mathcad, where the data were plotted in a chromaticity diagram, in terms of (u, v) and could be compared with the "correct" data (see below). During the matching procedure, the observer should be seated so as to look straight onto the hole from half a meters distance. (Actually "onto", not "into"! The point is that when you do really fix your gaze at the hole - and not the surface of the screen behind it - you can manage to perceive the colour of the monitor screen as aperture colour, i.e. as situated at the plane of the hole, which is the same as the plane of the colour chip to be matched.) Calibration in this particular case The arrangement was calibrated by help of a Spectra Scan PR650 photometer. (The calibration session was in March 1998). The fluorescent tubes in there fittings were measured and found to have a chromaticity of (0.341 0.354), corresponding to a correlated colour temperature of 5160 K. The three primaries of the monitor screen, R,G and B where measured, one at a time. The excitation function was determined, as well as the SPD from which the chromaticity was automatically calculated. The excitation functions, after normalization, were found to be reasonably alike and followed a power function course, see figure 4. The white point of the screen of the Dell computers could be adjusted to a number of pre-selected nominal values. The nominal value 6000 K was chosen, being the one coming nearest to that of the room lighting. The SPD of the emitted light, with all three phosphors well activated, i.e. digital excitation (63 63 63), was measured. It coincided with the sum of the measurements of the separate primaries, which shows that the independence of the three electron guns was satisfactory. The white point, as measured with the Spectra Scan instrument, was (0.3232 0.3386) as a mean value of three measurements. The corresponding correlated colour temperature was 5900 - 5990 K. Further, for each one of the nine colour samples, a careful match was made by the author. At match, the sample as well as the screen (i.e. the two halves of the hole that defined the matching field) were measured by help of the Spectra Scan photometer.
12
From the (r g b) values at match the chromaticity (x,y) could be calculated, as well as the luminance of the sample relative to that of the white reference. The calculated values of the chromaticities on the screen came close to the values measured by the Spectra Scan instrument. This showed that the calibration of the computer was reliable - as far as could be wished, for such a relatively simple arrangement as the one here described. Moreover, the matched values in their turn came reasonably close to the chromaticities of the coloured chips, as measured directly by the Spectra Scan device. (See figure 6) This shows that this very simple method of matching could profitably be used for educational purposes. (To use a computer screen as a colorimeter for professional purposes is not recommendable - for a number of reasons - but that is another story!)
Figure 6. Results of four independent matching sessions of the 8 standard samples, plotted in the (u,v) reference system. Crosses mark the chromaticities as measured with the Spectra Scan photometer. Black points are the results, calculated from visual matching.
Results As mentioned above the simple "visual colorimeter" was tested by the students of a general high level course in the science of light and colour. Two thirds of them were students coming from the humanities or students in art and design, the others were science students. The colorimetric session was attended by 16 persons, 7 men and 9 women. They worked in groups of two. So there were in total 8 matching series.
13
The only training in matching they had, before the colorimetric session, was about half an hours work with the above mentioned interactive computer program "RGB 1.1" which presents the RGB-system for colour mixing, including a training session, where the student has to find the appropriate (r g b) to match 10 patches of given colour, successively presented on the screen.
Figure 7 Matching result for a couple of untrained pupils. Crosses mark the chromaticities as measured with the Spectra Scan photometer. Black points are the results, calculated from visual matching.
Despite their brief experience the students did well. A typical example of the result of a matching session is shown in figure 7. The most prominent deviation was for the blue sample, which was systematically regarded as having more content of B than it should. A general tendency is also to exaggerate purity slightly. In fact, the samples had been chosen so that none of them could appropriately be matched by only two of R, G and B. Nevertheless, many of the pupils tended to be satisfied with matchings based on only two primaries. This was the case for the yellow and orange samples. A tendency in the same direction was apparent also for the magenta sample. (It should be remarked that the pupils agreed with the "correct" matchings, when shown these. Thus, the deviations in their matchings were not caused by individual differences in colour vision, but rather by a lack of training in doing careful colour observations.) The dimensions of lightness and hue are relatively easy to see and feel sure about, whereas the dimension of colorimetric purity (which is most closely related to the perception of chromaticness, or saturation, or chroma, of the sample) is much more difficult to observe with the same degree of accuracy. When estimated subjectively I think it is more floating and dependent on circumstances, than the other two parameters.
14
Conclusions The attempt to use a computer CRT display as a visual colorimeter for educational purposes was rewarding. The students, who did not know anything about colorimetry before, and had never done "colour matching" in this way, found it quite amusing and were successful in obtaining results that were in relatively good agreement with the correct values. Besides the introduction to the principles of colorimetry, students get other valuable experiences. They get to know what really careful observation of colour nuances means. The experience that it is relatively easy to find samples that cannot be matched with any colour on the computer screen is also of importance, since it makes one conscious about the limitations of the gamut area of conventional electronic displays. At the same time it is rather though-provoking to observe that a colour sample can seemingly be faithfully reproduced as a patch on the screen, when the two colour areas are compared at a distance from each other. Whereas when seen side by side they suddenly look quite different. And, as I said, this concerns first and foremost the dimension of saturation. I am myself still a bit puzzled by the convincing distinctness of this effect.
Acknowledgements The facilities put at my disposal within the Science Laboratory at Department of Physics, Stockholm University, are gratefully acknowledged. My thanks are due to Lennart Högman who shared my interest in finding out the reliability of electronic displays for experiments in colour perception and let me use his Spectra Scan photometer for the calibration of the displays used in the present study. The study was supported by the FLIP project (Flexible Learning in Physics).
15
Appendix The trichromatic principle Radiation from a light source, perceived as illumination, can have various qualities. It can be bright or dim, it can be hard or diffuse, it can be colourless or coloured. From the point of view of physics, radiation is characterized by its direction of propagation, its intensity, its spectral power distribution and state of polarization. An operation of fundamental importance in the physical theory of light is the superposition of light fluxes. Given two fluxes, we can bring them together to form a new flux. Superposition is of fundamental importance because it can be described mathematically as pure addition. Let us denote various kinds or states of light by capital letters A B C D etc. Then the superposition of light A and light B to make light D can be written symbolically D = aA + bB where a and b are coefficients taking care of the possibility of varying the relative intensity of the two lights in the superposition. Two different lights, which are not identical physically, may nevertheless look identical to the human eye. Perceived as illuminations, side by side, they can be brought to complete match. We denote the fact that lights A and B match A «» B The principle of trichromaticity says that any light D can be matched by some superposition of three given lights A, B and C. The three "primaries" can be arbitrarily chosen, except that they should be linearly independent, in the sense that it should be impossible to match anyone of them with any combination of the other two. Then, for any D there are coefficients a, b and c such that D «» aA + bB + cC
.................(1)
The triple of numbers (a, b, c) can be used as a kind of "chromatic measure" of light D. So far, the coefficients are assumed always to be positive numbers, since they represent real, physical intensities. However, if the rule above should be true for all possible lights D, even negative values of the coefficients must be permitted, because it might happen that D is a spectrally more pure light than what can be obtained by any combination of the primaries A, B and C. In such a case, a match can still be obtained if one or two of the primaries are superimposed with D and the resultant light compared with the remaining one (or ones). That is, it might for instance happen that a match of the following kind is possible: D + eC «» aA + bB
..................(2)
which could consistently be denoted as in (1), if we put c = -e In addition to (1) - which has been called "Grassman's first law" - the trichromatic principle includes a number of statements concerning the logical properties of the
16
relation «». That it should be symmetric is trivial. Less trivial is that it should also be transitive: If A «» B and B «» C then A «» C
...................(3)
Since it is symmetric and transitive it is an equivalence relation. The field of such a relation may be divided into mutually exclusive classes. Classes of what, in this case? Well, classes of lights, or light states. The totality of possible light states is partitioned into equivalence classes, with respect to chromatic equivalence. Each equivalence class corresponds to a particular colour. This is what the term "colour" means from the point of view of colorimetry. Furthermore, colorimetry is based on Grassmans' third law, which says: If A «» B then
A+ C «» B + C
...................(4)
This means that chromatic equivalence works well together with the fundamental operation of superposition of light fluxes. You may combine (3) with (4) to get: If A «» B and C «» D then A+C «» B+D
................(5)
Change of primaries What happens if we want to use a different set of lights as reference, in making the visual matches? It follows from the properties of the matching relation, stated above, that it will still lead to the same equivalent classes. Which is the same as to say that the choice of reference lights is a matter of convenience. The fundamental classification of lights into colours is untouched, but the numerical values, the co-ordinates denoting the classes, change. Say, that we want to use the three phosphors R, G, B of an electronic display as primaries, instead of the primaries of some other reference system. Call these other primaries A, P and C. Say further, that we match a light F in terms of R,G,B: F «» rR + gG + bB
...................(6)
where (r g b) are the "chromatic co-ordinates" of F in the system RGB. Then, to find the corresponding co-ordinates (a p c) of F in the APC-system, we have to investigate what the position would be of each one of our primaries R, G and B separately, in the APC – system: R «» tRAA + tRPP + tRCC G «» tGAA + tGPP + tGCC B «» tBAA + tBPP + tBCC By application of the laws (3) and (4) we put this into (6) to get an expression for the superposition of lights A, P and C which matches F. F «» (rt RA+ gtGA + btBA )A + ...... etc. if this is compared with 17
F «» aA + pP + cC it is seen that the coefficients (a p c) are determined by a linear transformation of (r g b)
........................(7) The transformation matrix T gets its elements tik from the determination of the coordinates of the primaries R, G and B in the APC-system. Here APC was just an arbitrary example of a reference system, but let us now assume that it denotes the C.I.E. colorimetric standard system. Then (7) shows how the computer can be calibrated against this standard. We will apply this in a while. The matching functions of the C.I.E. standard observer Historically, the first step in establishing a standard system of colorimetry was to let a number of observers make colour matches under carefully controlled conditions. As reference sources spectrally pure lights at wavelengths 700 nm, 546.1 nm and 435.8 nm were used. Now, if the task would be to match any light that could possibly occur, you could go on matching lights for ever. But luckily physicists have agreed that in general an arbitrary light flux can be treated as equivalent with a superposition of lights of pure wavelengths. The so called "spectral power distribution", SPD, is a function which gives the weights of the series of wavelengths in the spectral composition. For chromatic purposes it is sufficient to regard the range of wavelengths from 380 to 760 nm. So, what the pioneers did was to determine the coefficients for a series of monochromatic lights, that is light with all energy concentrated around one particular wavelength, in terms of the set of primaries, let us denote it {S700 S546 S436}. This means that the corresponding coefficients were determined as functions of wavelength, . These are the three so called matching functions: s700( s 546( and s436( . They can be used to calculated the coefficients of an arbitrary light F, provided that we know the spectral composition of this light, call it F(). By reiterated application of rule (5) above we find that the coefficients of F can be calculated by integration as: r = F() s700 ( d
g = F() s546( d
b = F() s436( d
The three numbers r g b are the co-ordinates of F in system {S700 S546 S 436}. The matching functions were established as characteristic of a "standard observer". After that, instead of doing visual matchings, one can measure SPD, using a spectrophotometer, and by help of calculations (as above) determine whether two lights F and G
18
belong to the same chromatic equivalence class or not. That is to say, to tell whether for instance G can be used to reproduce F. Thus, instead of using three reference sources we may use the three matching functions as the basis for colorimetry. Since any linear transformation of them would do as well i.e. establish the same equivalence classes of lights - instead of s 700( s546 ( s436( it has been agreed on a certain combination of these, with desirable properties. They are denoted x( y( z( and the corresponding coefficients X, Y Z. These three matching-functions are positive for all . Furthermore Y = F()y( d gives the luminance, as defined by the so called V-curve used in photometry, i.e. in units of candela/m2 . This is the C.I.E. 1931 standard system of colorimetry. It has since 1931 been modified in various respects, but these modifications do not concern its basic features. Thus, in principle it is still used as a standard for colour technology. (For instance when it comes to calibration, trying to get the colours on your computer screen to agree with those coming out on your printer.) As mentioned in the main text, instead of X, Y, Z one often prefers x, y and Y, i.e. the chromaticity and the luminance. (x,y) can be conveniently plotted in the chromaticity diagram. Instead of using the variables x, y, Y the so called Luv-system is often preferred. The variables L, u and v can be calculated from the former ones by the formulas:
with
L=Y u = 4x/(x+15y+3z) v = 9y/(x+15y+3z) z = 1-x-y
The plots in figure 6 and 7 show the chromaticity diagram in terms of (u,v). The curved boundary, within which the chromaticity of all possible lights must lie, is the so called "spectral locus" and is given by the matching functions. It looks the way it does for empirical reasons. It mirrors the properties of the receptors of the human retina. Calibration To be able to translate the digital code (r g b) into (X Y Z), to begin with one has to linearize r, g and b by help of the excitation function (shown in figure 4). Having done this we use formula (7), which in this case looks:
where denotes the relative excitation function (assumed to be the same for the three channels). The matrix consists of the (X,Y,Z)-co-ordinates in the C.I.E. system of the three phosphors at maximum excitation, i.e. when = 1. The matrix can either be put together directly from spectro-photometric measurements of R, G and B. Alternatively, the (relative) matrix elements can be calculated from
19
knowledge of the chromaticities of the three phosphors and the white-point (i.e. the colour balance). In fact, the matrix can be separated into two factors:
so that the first part is given by the chromaticities of the three phosphors, the second part is calculated from knowledge of the chromaticity of the white-point (xw ,yw) by the following, a bit tedious expressions: SR = {(x w - x 3)(y2 - y3) - (x2 - x 3)(yw - y 3) }/{(x1 - x 3)(y2 - y3) - (x2 - x 3)(y1 - y3)} SG = {(x 1 - x3)(yw - y3) - (xw - x 3)(y1 - y3)}/{(x 1 - x3)(y2 - y 3) - (x 2 - x3)(y1 - y 3)} SB = 1 - SR - SG since the absolute luminance of the screen is unknown in this case (which is quite OK for our purpose, i.e. to determine chromaticities and relative luminances of a number of colour samples). For the Dell computers, as used for the matching exercise, the matrix for transformation from linearized r,g,b to the standard X,Y,Z looked as follows:
In measuring colour samples, as described in this report, the function F() is the spectral power distribution of the light, reflected from the sample. Actually F() is the product of the SPD of the illumination falling onto the sample and the spectral reflectance of the sample. The spectral reflectance is a property of the sample, but it is not independent of geometrical conditions, i.e. the angle and angular spread of the infalling flux of light, as well as the angle from which the sample is observed. In our case, when a CRT monitor is used as a visual colorimeter, the illumination is relatively diffuse and falling obliquely from the sides onto the sample. The angle of observation is at right angle to the plane of the sample. Other applications In other applications you may have to go the other way round, i.e. to start with a known SPD of some light and calculate what (r g b) should be used to produce a colour on the display, showing how the light in question would look to the standard observer, under standard conditions. Then you should use the inverted matrix, to the one above. From this you get the demanded light intensities of the three phosphors and searching up these in the excitation function you finally get the corresponding digitalized levels r, g and b.
20
21
References P.J.Bouma:
Physical Aspects of Colour, Philips, Eindhoven 1971
M.Brill and G. Derefeldt:
Comparison of Reference-White Standards for Video Display Units. Color Research and Application, Vol.16, febr1991 p 26-29
William Cowan:
Colour Television. In P.Gouras (ed.): The Perception of Colour. Vision and Visual Dysfunction, Vol. 6 Macmillan Press Ltd 1991
Pehr Sällström:
Colour and Physics. Some remarks concerning the physical aspects of human colour vision USIP Report 73-09, Stockholm 1973
Pehr Sällström:
Om återgivning av färger på datorbildskärm. Internal report 96-06-17. Dept. of Physics, Stockholm University
Gunnar Tonnquist:
Färgsystemanalys Byggforskningsrådet, Stockholm 1995
G. Tonnquist and Li Heng: Application of colour video displays to colour research. Displays, July 1989 p 171-180 W.D.Wright:
The Measurement of Colour. In P.Gouras (ed.) The Perception of Colour (Vision and Visual Dysfunction, Volume 6) Macmillan Press Ltd 1991
22