Mar 2, 2006 - computing industry towards mobile devices like handhelds, PDAs, cellphones and laptops. .... of these points without affecting user experience.
Using Annotations to Facilitate Power vs Quality Trade-offs in Streaming Applications ∗ Radu Cornea Alex Nicolau Nikil Dutt Donald Bren School of Information and Computer Science University of California, Irvine, CA 92697-3425 {radu,nicolau,dutt}@ics.uci.edu
CECS Technical Report #06-02 March 2006
Abstract Modern applications for mobile devices, such as multimedia video/audio, often exhibit a common behavior: they process streams of incoming data in a regular, predictable way. The runtime behavior of these applications can be accurately estimated most of the time by analyzing the data to be processed and annotating the stream with the information collected. We introduce a software annotation based approach to power optimization and demonstrate its application on a backlight adjustment technique for LCD displays during multimedia playback, for improved battery life and user experience. Results from analysis and simulation show that up to 65% of backlight power can be saved through our technique, with minimal or no visible quality degradation.
∗
This work was partially supported by NSF award ACI-0204028.
Contents 1 Introduction
4
2 Background/Related Work
4
3 Software Annotation
5
4 Annotations for Backlight 4.1 Theoretical Background . . . . . . . . . . . . . . . . . . . . . . . . . . . . . 4.2 Quality Evaluation . . . . . . . . . . . . . . . . . . . . . . . . . . . . . . . . 4.3 Technique for Annotations . . . . . . . . . . . . . . . . . . . . . . . . . . . .
7 8 8 9
5 Experimental Flow and Results 5.1 Power Savings . . . . . . . . . . . . . . . . . . . . . . . . . . . . . . . . . . .
12 13
6 Summary
15
A Other Experimental Results A.1 Backlight Variation for Other PDAs . . . . . . . . . . . . . . . . . . . . . . . A.2 Survey of Brightness Variation in Video Clips . . . . . . . . . . . . . . . . .
16 16 17
2
List of Figures 1 2 3 4 5 6 7 8 9 10 11 12 13 14 15 16 17 18 19 20 21 22
System model . . . . . . . . . . . . . . . . . . . . . . . . . . . . . . . . . . Compensation validation with a digital camera . . . . . . . . . . . . . . . . Image histogram properties . . . . . . . . . . . . . . . . . . . . . . . . . . . Original (full backlight) frame vs compensated (50% backlight) frame - camera snapshots . . . . . . . . . . . . . . . . . . . . . . . . . . . . . . . . . . . . . Quality trade-off shown in a histogram . . . . . . . . . . . . . . . . . . . . . Scene grouping during playback . . . . . . . . . . . . . . . . . . . . . . . . . Brightness variation with backlight . . . . . . . . . . . . . . . . . . . . . . . Brightness variation with white level . . . . . . . . . . . . . . . . . . . . . . LCD power savings (simulated) . . . . . . . . . . . . . . . . . . . . . . . . . Total power savings (measured) . . . . . . . . . . . . . . . . . . . . . . . . . Brightness variation with backlight . . . . . . . . . . . . . . . . . . . . . . . Brightness variation with white level . . . . . . . . . . . . . . . . . . . . . . Brightness variation with backlight . . . . . . . . . . . . . . . . . . . . . . . Brightness variation with white level . . . . . . . . . . . . . . . . . . . . . . Brightness variation for akiyo . . . . . . . . . . . . . . . . . . . . . . . . . . Brightness variation for coastguard . . . . . . . . . . . . . . . . . . . . . . . Brightness variation for container . . . . . . . . . . . . . . . . . . . . . . . . Brightness variation for foreman . . . . . . . . . . . . . . . . . . . . . . . . Brightness variation for hall . . . . . . . . . . . . . . . . . . . . . . . . . . . Brightness variation for mobile . . . . . . . . . . . . . . . . . . . . . . . . . Brightness variation for news . . . . . . . . . . . . . . . . . . . . . . . . . . Brightness variation for silent . . . . . . . . . . . . . . . . . . . . . . . . . .
3
7 9 10 10 11 11 13 13 14 14 16 16 16 16 17 17 18 18 19 19 20 20
1
Introduction
Recent technological advances in processor and wireless technology have caused a shift in the computing industry towards mobile devices like handhelds, PDAs, cellphones and laptops. At the same time, we find that these devices are increasingly being used in multimedia streaming type applications, common examples being on-demand movie streaming and video conferencing. In spite of technological advances, battery life still remains a major limitation of portable devices. The main power consuming components of a mobile device are the CPU, display and network interface. Running multimedia applications further aggravates the situation, as these programs are known to be both CPU and network intensive. However, while the CPU and network may benefit from advanced power management techniques, the LCD display needs to be on at all times and thus limit the possibilities for saving power without severely impacting the user experience. Various research on display power optimization has been done in recent years, but there is a limited gain that can be achieved from a static perspective. Variations in the input data stream present us with new ways to optimize dynamically, based on content.We present a new approach for backlight power saving through runtime power vs quality trade-offs based on data analysis and software data annotation. Annotations prove beneficial because they can be done “off-line” (statically) while saving the mobile device from the burden of analyzing the data at runtime. The paper is organized as follows: we start by presenting some background and related work. Next, we describe data annotation and its possible applications. We then introduce our approach to annotations in a LCD backlight scaling technique, starting with a brief theory, followed by our work flow and experimental results. We present power results from both simulation and measurements from our implementation on a real PDA. The last section summarizes the paper.
2
Background/Related Work
Multimedia workloads are characterized by quasi regular patterns in their execution. This regular behavior is confirmed by recent research [13]. The only changes are introduced by variations in the input data [9] and the algorithm itself. Knowledge of data patterns in the stream can be exploited in a multimedia application, and is especially important for portable devices where battery life plays an important role. Other efforts to study data patterns include those of the Aspire research group that looks at various data-shaping algorithms for mobile multimedia communication. In their paper [11] the image data is compressed according to dynamic conditions and requirements. Chandra performs an informed quality-aware transcoding in [1], based on image characteristics. In [2], the authors analyze the characteristics of images available on web sites and classify them for applying various transcoding techniques. At the same time, there is an increased research effort towards minimizing power consumption for LCD displays. Choi describes in [6] a number of techniques for low-power 4
TFT LCD display, including one which applies backlight luminance dimming with appropriate brightness and contrast compensation. Subsequent work from Choi, Chang, Shim and Pedram in [3] [5] [14] further study and implement dynamic luminance scaling (DLS), dynamic contrast enhancement (DCE) or a combination of the two. Because of the computation involved when performing DLS and DCE on a small device, these techniques are not suitable for a software implementation, therefore a hardware approach is preferred. Some of the techniques can only be applied for still images or low-framerate video. In contrast, our technique delegates most of the work from the client to the server or proxy node, freeing the client and allowing a software-only implementation. The technique can be applied to existing devices, through minor changes in software. More recently other techniques have been proposed. [10] takes advantage of how the human eye perceives brightness and devises a backlight scaling technique based on that. An application of backlight power optimization for streaming video applications is presented in [12]. The adaptation is coordinated by a middleware layer running on both the client and an intermediary proxy node. In [4] the backlight scaling technique proposed tries to minimize quality degradation (PSNR) while dimming the backlight. Additionally a smoothing technique is presented that prevents frequent backlight switching. Our approach avoids a postprocessing step by limiting backlight changes. For evaluating quality we use histograms, which better capture the overall change without comparing individual pixels. Most of the work mentioned focuses on CCFL (Cold Cathode Fluorescent Lamp) as a backlight source. However, more recently white LEDs are increasingly being used in small devices (phones, PDAs and digital cameras). CCFL requires a high-voltage AC supply for operation and is better suited for larger LCD displays. On the other hand white LEDs have simpler drive circuitry, while offering longer life and lower power consumption with a faster response time. In our experiments we found that measured luminance response to backlight level (set by software) is not always linear and is influenced by the quality and type of the display. Our scheme allows us to tailor the technique to each PDA for better power savings, by including the display properties in the loop. We start with the observation that many video clips (movies and other entertainment media) contain frequent few points or spots. In many cases we can reduce the luminance of these points without affecting user experience. We propose a new approach for runtime power vs quality trade-off based on data analysis. Our approach makes aggressive use of annotations to convey information about each frame or scene to the client so that there is minimal work involved at runtime. Another benefit is that aside from the information sent through annotations, we can also apply different heuristics (more or less aggressive) depending on the nature of the video and the quality trade-off level chosen by the user.
3
Software Annotation
Annotations have been used before in other ways. In compilers, annotations are sometimes used for retaining part of the original semantics in the program. A programmer can also annotate the source code to pass information or hints to the compiler [8]. For example, 5
register assignment for variable in C falls in this category. Other examples include the use of ’pragma’ directives (C, C++, Ada). The process of annotating the data stream can be either automated (performed statically, through an analysis step) or under user supervision (for example, the user may specify which parts or objects of the video stream are more important in a power-quality trade-off scenario). We define data annotation as the process of analyzing a stream of data and supplementing it with a summary of the information collected; this information will later be used at run-time for data-aware optimizations. Annotations typically capture patterns or trends in the data stream that are difficult or expensive to gather at run-time on the handheld device and that can be exploited later for power or performance benefits. The annotations can be performed either statically (for example offline annotation/profiling in case of online media serving, where the information is preprocessed and saved on media servers) or dynamically (in case of live streams, the annotation can be done on-the fly by an intermediary proxy node). Annotations can be used either at the client side, for an increased user experience, or at a proxy node, which performs various on-the-fly operations on the data stream to adapt it to the capabilities of the client (transcoding, etc.). These annotations may prove useful in estimating the required bandwidth for communication, estimating computation or applying more aggressive QoS trade-offs based on image content. Multimedia applications are typically studied at different abstraction layers: application, middleware/network, OS, hardware. Each of these layers can use, and benefit from, additional information on the data stream. In this paper we focus our attention at the OS/hardware level. Moreover, we assume that the annotation is performed off-line, by profiling an extensive data set, representative for the application domain. We focus on multimedia streaming in particular, and on annotations that are relevant to this domain. The advantage of annotating the data in advance is two-fold. First, there is no overhead for doing all the work at runtime by the client. Second, because the information is available even before decoding the data, more optimizations are possible than would otherwise be possible at runtime (for example network packet optimizations). Optimizations like frequency/voltage scaling can be applied before decoding is finished, because the annotated information is optimizations (like frequency/voltage scaling) can be applied before decoding is finished, because the annotated information is available early from the data stream. Without annotations, the client application would first need to decode the data before analyzing it or use a history-based prediction (where only a small window of data is available at one time). This limited knowledge can have serious consequences (severe quality degradations) if prediction proves wrong. It would also place a heavier load on the mobile device, thereby reducing its battery life. We assume the system model depicted in Figure 1. The system entities include a multimedia server, an (optional) proxy node that can perform various operations on the stream (transcoding), the users with low-power mobile devices and other network equipment. The server stores media content and streams videos to clients upon user requests. The communication between the handheld device and the server can be routed through a proxy node – 6
C Transcoder, etc.
S
P
Server
Proxy WAN
C Switch
Access Point
USERS
Annotation
C
WI RED ETHERNET WI RELESS
Figure 1: System model a high-end machine with the ability to process the video stream in real-time, on-the-fly (example in videoconferencing). In this case the proxy node also performs inline profiling and annotation of the stream. for real-time video streaming (videoconferencing is an example of such an application). Note that for our scheme either the proxy or the server node suffices. The annotations can be generated and added to the video stream at either the server or proxy node, with no changes for the client.
4
Annotations for Backlight
On a typical PDA the backlight dominates other components, with about 25-30% of total power consumption. In reality, the relative importance of backlight is even higher: while the processor and network interface can make use of advanced power management techniques when there is no computation or communication required, the display has to be on at all time while the device is being used. However, there are situations where the backlight can be dimmed by some amount, if the image to be displayed is modified to allow the same level of user experience. Handheld devices are increasingly being used in video streaming, where they receive content from media providers. Our technique annotates the video stream with information that is used later, during playback, for adjusting backlight level. Video clips consist of sequences of scenes (groups of frames with similar content and minimal changes). Many of these scenes do not use the entire dynamic luminance range; this allows us to increase the brightness of the image while simultaneously dimming the backlight for reduced power usage. This process is called image compensation in the following discussion. The video clips available for streaming at the servers are first profiled, processed and annotated with data characterizing the luminance levels during various scenes. The next subsections present the approach we take in extracting this information and using it at the client to decrease backlight according to the compensation step at the server, in order to maintain the same overall result.
7
4.1
Theoretical Background
On a back-lit LCD screen, the perceived intensity of pixels is given by the formula: I = ρ × L × Y , where ρ is the transmittance of the LCD panel, while L and Y are the luminance of backlight and displayed image respectively. The luminance of a pixel is computed from the RGB values through the formula: Y = rR + gG + bB, where r, g, b are known constants and R, G, B are fundamental color values. LCD displays are of three types: reflective, transmissive and transflective. Most recent handhelds use transflective displays, which perform best both indoors (low light) and outdoors (in sunlight). For reducing the power consumption during playback, we dim the backlight while at the same time compensate by increasing the luminance of the displayed image. There are two ways for achieving this: • Brightness compensation, in which a constant value is added to each pixel’s value in the image: C 0 = min(1, C + δC), where C and C 0 are normalized RGB values before and after compensation. Each RGB value needs to be compensated by same amount to maintain original colors. • Contrast enhancement, in which all pixels in the image are multiplied by a constant amount: C 0 = min(1, C ∗ k), where C and C 0 are normalized RGB values before and after compensation. We use this method in our work and we select a k value to maintain the same perceived intensity I (keep the product of L and Y constant, i.e. k = L/L0 ). The compensation can be performed for each individual pixel color (R, G, B), as above, or for the computed pixel luminance Y. Regardless of the technique, the compensation may distort the original image. Since pixel values for most LCDs are in the range 0-255, after multiplication by a constant value some pixels cannot be represented within this range any more (pixels become saturated and clipping occurs or colors change). The user decides if some quality can be traded for more power savings. The quality determines the maximum percentage of pixels that can be clipped. Our scheme can be applied without any degradation to the original video sequence (smaller power savings) or with a minimal degradation (hardly noticeable during playing), but with significantly increased power savings in the display. Note that the observable degradation may be different for very bright video clips, where only a limited smaller percentage of pixels can be clipped without degrading quality.
4.2
Quality Evaluation
Versions of the above equations have been used by related projects to compute the necessary compensation of the image. However, the results are typically validated through display 8
simulation or human surveys. In other cases, the degradation in quality is estimated by computing pixel level difference between the images or using an illuminometer. These methods have drawbacks in term of accuracy and relevance of results. We introduce an alternative, novel way of validating the results with a digital camera. By taking a picture of the PDA displaying the original frame (reference snapshot) and comparing it with a picture of the same frame after adjustment (compensated snapshot), we can objectively estimate how close the resulted image on the PDA is to the original one (Figure 2). The picture taken by the camera incorporates the actual characteristics of the handheld display, which are not otherwise captured by a simulation. Therefore, the results are more realistic, while and easier to obtain than through human observation. A digital camera has a monotonic non-linear transfer function[7] and allows us to objectively estimate the similarity between two images. Original Frame
Phase 1
PDA Screen Snapshot (reference)
Annotated Video Stream
PDA Phase 2
Processing
Quality Result Evaluation
PDA Screen Snapshot (compensated)
Compensated Frame PDA
Figure 2: Compensation validation with a digital camera We estimate the difference between the LCD snapshots by computing their histograms. The histogram was chosen as a metric because it represents both the average luminance and dynamic range for an image, as shown in Figure 3. Typically, brightness and contrast adjustment will result in a shift of average luminance and a change in dynamic range. We use histograms to help us understand how backlight reduction and brightness compensation affect the original image and to validate our technique. A loss-less scheme allows for minimal power savings while preserving the quality of the video clip virtually unchanged. If the user accepts a lower quality level the savings can be substantially higher. The user specifies the quality level when he requests the video clip from the server and the system tries to maximize power savings while maintaining the quality of service above the given threshold.
4.3
Technique for Annotations
During video playback, the entire dynamic luminance range is not always completely used: for example a large number of scenes in movies have dark scenes, i.e. scenes in which only a few or no pixels are very bright. This allows us to increase the brightness of the image while simultaneously dimming the backlight for reduced power consumption. An example from a 9
No. of Pixels
Average Point
Dynamic Range
Pixel Value
Figure 3: Image histogram properties news video clip is presented in Figure 4, which shows the image and corresponding histogram for the original and compensated image frame. The differences between the images displayed on the PDA screen are hardly noticeable for a human (on the paper it is not obvious), however the camera detects the slight changes between them.
Avg Brightness = 109
Avg Brightness = 107
Figure 4: Original (full backlight) frame vs compensated (50% backlight) frame - camera snapshots We use annotations for storing the luminance information for different scenes in a video stream. For reducing the power consumption during playback, we dim the backlight while at the same time compensate by increasing the luminance of the video stream sent to the client. Our technique uses a simple heuristic to find the scenes in a movie, where maximum luminance levels do not vary significantly. Then, for each scene the required level of backlight is computed and annotated to the video stream. Depending on the level of quality requested by the user, the compensation algorithm may go even further and trade-off quality for a longer run time. Since in many cases a small number of pixels amount for the high luminance 10
No. of Pixels
Actual Pixels Lost
Pixel Value Clipped (Lost) Luminance Values
Figure 5: Quality trade-off shown in a histogram levels and are sparsely distributed within the frame, we can safely allow clipping for some of these pixels without noticeable quality loss on the video watched on the PDA (Figure 5). Different heuristics for determining the amount of clipped pixels are possible. In our scheme we allow a fixed percent of the very bright pixels to be clipped. This heuristic works well for most videos, except end credits where it may distort the text if too many pixels are clipped and the background is uniform (this is subject of future study). For the experimental part, quality degradation levels (percent of high luminance pixels clipped) were set to 0, 5, 15 and 20.
Normalized Luminance
Scene Max. Lum.
Normalized Power
Max. Luminance
Backlight Power Saved
Time (seconds)
Figure 6: Scene grouping during playback 11
Figure 6 presents our backlight adjusting technique during a short video clip. It shows the original max luminance for each frame and the max luminance value for the entire scene. It also plots the instantaneous power savings for the LCD backlight during playback. For this particular example, we grouped frames into scenes based on their maximum luminance levels: a change of 10% or more in frame maximum luminance level is considered a scene change, but only if it does not occur more frequently than a threshold interval. Sometimes, better results are obtained if we allow backlight changes for each frame (but it may introduce some flicker). Both these thresholds were experimentally set for minimizing visible spikes. A maximum luminance level is computed for the entire scene, as shown. The resulted value is later plugged into the backlight-luminance function for computing the required backlight level for each scene. The example presented corresponds for a 10% quality degradation, which means that we allow 10% of the pixels in the high luminance range to be clipped (their luminance is replaced by a lower value). The server (or proxy node) provides a number of different video qualities as exemplified above (5 in our case), same for all types of PDA clients. Device specific are the actual backlight levels to be set at runtime. These can be computed by either the server/proxy (client characteristics are sent during the initial negotiation phase), or by the client itself (involves a simple multiplication, followed by a table look-up). Because adjustments are not performed very often, the amount of work is negligible.
5
Experimental Flow and Results
We start by first characterizing the display and backlight of our PDAs. This is performed by displaying images of different solid gray levels on the handhelds and capturing snapshots of the screen with a digital camera. Three devices with different LCD technology were used in our experiments: iPaQ 3650 and Zaurus SL-5600 (reflective display, CCFL backlight) and iPaQ 5555 (transflective display, LED backlight). For actual implementation and power measurements, we chose the iPaQ 5555, which is the newest and has a more efficient backlight technology. We noticed that for this particular handheld, the measured luminance was almost linear with the luminance of the image (Figure 7), but not linear with the backlight level (Figure 8). Each display technology showed a different transfer characteristic. Results from other PDAs can be found in the appendix A.1. The luminance-backlight transfer function allows us to compute the backlight level needed to achieve a desired luminance level during playback and is essential in order to minimize the degradation introduced by the compensation scheme. From our experiments we also determined that the power consumption of the LCD is almost proportional to backlight level, but little dependent of pixel values, allowing us to analytically estimate the power savings through simulation. For the next step, we detect scenes in the video clip with similar illumination and for each scene we compute the best trade-off between backlight level (power consumption) and brightness compensation (quality degradation) depending on the quality level requested by the user. The computed backlight levels for the actual PDA type are added to the stream 12
Backlight=255 (max)
250
250
200
200 Measured Brightness
Measured Brightness
White=255 (max)
150
100
50
150
100
backlight=255 backlight=128
50
0
0 0
50
100
150
200
250
300
Backlight Value
0
50
100
150
200
250
300
W hite Value
Figure 7: Brightness variation with backlight Figure 8: Brightness variation with white level as annotations. The annotations are RLE compressed, so the overhead is minimal, in the order of hundreds of bytes for our video clips which are on the order of a few megabytes. To reduce the load on the client device at runtime, the compensation of the frames in the video stream is performed at either the server or the intermediary proxy node. The only extra operation that the device has to perform during playback is to adjust the backlight level periodically, according to the annotations in the video stream.
5.1
Power Savings
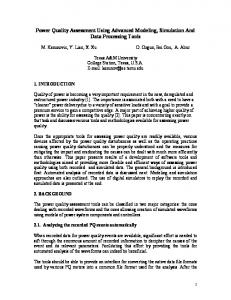
For power measurement purposes we used the iPaQ 5555 with a 400 MHz Intel XScale processor and 64K-color transflective LCD display. The PDA was running the Familiar 0.7.2 Linux distribution. The batteries were removed from the iPaQ during the experiment. A PCI DAQ board was used to sample voltage drops across a resistor and the iPaQ, and sampled the voltages at 200K samples/sec. Initially, we performed a video survey by measuring the average and maximum brightness during playback (appendix A.2). This survey confirmed our assumptions that not the entire luminance/brightness range is used during playback and even when used, it is distributed in a very small area of the entire frame. We selected some movie previews and short clips, available on the Internet (http://www.pocketmovies.net These clips vary in length between 30 seconds and 3 minutes and have scene ranging from slow to fast motion. We experimented with a number of different quality levels (0% to 20% quality loss). Even at the 5% quality loss we already start seeing a huge improvement in the backlight power consumption, and visual degradation is virtually unnoticeable. The results from simulation and theoretical analysis (Figure 9) show that up to 65% of the backlight power consumption can be saved using our approach (depending on the video clip), or even more if the user 13
LCD Power Savings
Power Savings (% )
70 60
Quality Level
50
0% 5%
40
10%
30
15%
20
20%
10
r2 - tl
an
es
m
di bl
er id
nc
re
sp
tu r
th
ei
re
hu
2
2 re k
ek
sh
in g
p no
of
fth
f ic
_a
ex
ge
t
ice
s
bo ro i_
nt er _s
ub
om ca
tw
m 40
5t he
re
an
ov ie
0
Video Clip
Figure 9: LCD power savings (simulated) Total Power Savings
Quality Level
Power Savings (%)
25 20
0% 5%
15
10%
10
15% 20%
5
2
2 th
ei
nc r
ed
ib l
es
-tl r
an er m
sp
id
re k2
ek fth no
tu r re
sh
in g
p ex f ic of
ag e e_ ic
t ro bo i_
es
nt e
r_
su br
om an tw
ca
hu
40
5t h
em
ov i
e
0
Vide o Clip
Figure 10: Total power savings (measured) allows a more aggressive QoS-energy trade-off. The degradation in quality varies from not noticeable to minor color and luminance distortion, which still allows the user to see the clips to completion (with some quality loss). In two cases (hunter subres and ice age) the background in the videos is bright, so the results are limited without introducing too much degradation (pixels are concentrated in the high luminance range). The best results are obtained for videos with many dark scenes, as in most of the other clips. The next set of experiments was performed by implementing the techniques in a video player (from Berkeley MPEG tools) and measuring the total power saving with our approach while running it on the iPaQ 5555. The measured results are in line with the simulation, showing up to 15-20% power reduction for the entire device (Figure 10), with the exception of ’ice age’, which shows almost no improvement.
14
6
Summary
This paper presents a new annotation-based approach towards backlight power optimization during multimedia streaming on mobile devices. We show how annotations can be used to capture information and automatically adjust backlight level depending on what is playing on the device and the quality level selected by the user. Our results from both theoretical analysis and real simulation show that up to 50% of backlight power can be saved through our technique, with minimal or no visible quality degradation.
References [1] S. Chandra and C. S. Ellis. JPEG compression metric as a quality-aware image transcoding. In USENIX SITS, 1999. [2] S. Chandra, A. Gehani, C. S. Ellis, and A. Vahdat. Transcoding characteristics of web images. In MMCN, 2001. [3] N. Chang, I. Choi, and H. Shim. Dls: Dynamic backlight luminance scaling of liquid crystal display. In TVLSI, 2004. [4] L. Cheng, S. Bossi, S. Mohapatra, M. E. Zarki, N. Venkatasubramanian, and N. Dutt. Quality adapted backlight scaling (QABS) for video streaming to mobile handheld devics. In LNCS, 2005. [5] W.-C. Cheng, Y. Hou, and M. Pedram. Power minimization in a backlit TFT-LCD display by concurrent brightness and contrast scaling. In DATE, 2004. [6] I. Choi, H. Shim, and N. Chang. Low-power color TFT LCD display for hand-held embedded systems. In ISLPED, 2002. [7] P. E. Debevec and J. Malik. Recovering high dynamic range radiance maps from photographs. In SIGGRAPH, 1997. [8] S. Z. Guyer and C. Lin. An annotation language for optimizing software libraries. In DSL, 1999. [9] C. J. Hughes, P. Kaul, S. V. Adve, R. Jain, C. Park, and J. Srinivasan. Variability in the execution of multimedia applications and implications for architecture. In ICCA, 2001. [10] A. Iranli and M. Pedram. DTM: Dynamic tone mapping for backlight scaling. In DAC, 2005. [11] D.-G. Lee, D. Panigrahi, and S. Dey. Network-aware image data shaping for low-latency and energyefficient data services over the palm wireless network. In WWC (3G Wireless), 2003. [12] S. Pasricha, S. Mohapatra, M. Luthra, N. Dutt, and N. Venkatasubramanian. Reducing backlight power consumption for streaming video applications on mobile handheld devices. In ESTIMedia, 2003. [13] T. Sherwood, S. Sair, and B. Calder. Phase tracking and prediction. In ISCA, 2003. [14] H. Shim, N. Chang, and M. Pedram. A backlight power management framework for battery-operated multimedia systems. In IEEEDT, 2004.
15
A A.1
Other Experimental Results Backlight Variation for Other PDAs
iPaq 3650
Figure 12: Brightness variation with white Figure 11: Brightness variation with backlight level
Zaurus 5600
Figure 14: Brightness variation with white Figure 13: Brightness variation with backlight level
16
A.2
Survey of Brightness Variation in Video Clips
Figure 15: Brightness variation for akiyo
Figure 16: Brightness variation for coastguard 17
Figure 17: Brightness variation for container
Figure 18: Brightness variation for foreman
18
Figure 19: Brightness variation for hall
Figure 20: Brightness variation for mobile
19
Figure 21: Brightness variation for news
Figure 22: Brightness variation for silent
20