Using Artificial Neural Nets to Hemo Metabolites Identification A portable and low cost system
José Renato G. Braga, Alexandre Carlos B. Ramos
Alvaro Antonio A. Queiroz
Federal University of Itajubá Itajubá, Brazil
[email protected],
[email protected]
Federal University of Itajubá Phisics and Chemistry Department Itajubá, Brazil
[email protected]
Abstract—Over the last century there has been a considerable increase in human longevity and this made a large number of people to reach a critical age for development of several diseases. As a result of this increase in life expectancy health issues related to ageing appeared, some examples are hypercholesterolemia, hyperglycemia and increased levels of blood urea. This paper presents a portable and low cost system using Artificial Neural Networks to Hemo metabolites identification. The system developed is based in amperometric biosensors and is able to perform the identification of glucose, cholesterol and urea concentrations in the blood. The main goals of this system is: the identification of three types of Hemo metabolites with their concentrations, the low cost of the entire system and the reuse capability of the biosensor. Cost of the entire system and the reuse capability of the biosensor. Keywords- Artificial neural networks, Chemical and biological sensors, monitoring Hemo metabolites
I.
II.
BIOSENSORS
The biosensors then emerge as an alternative to replace conventional methods from clinical laboratories. The analysis can be done by the patient himself at any time and place with the need of only a single drop of blood. Other than being a non-invasive tool, the biosensors devices provide in the health system a considerable saving compared to conventional methods. Another advantage of using biosensors for monitoring Hemo metabolites is due to the fact that there are patients who require daily monitoring, for example, diabetic patients. Biosensors are electronic devices capable of converting a biological reaction in an appropriate signal. This signal can be potentiometric, amperometric, conductimetric, optical, piezoelectric or enthalpymetric.
INTRODUCTION
Hypercholesterolemia, which is the presence of high levels of cholesterol in the blood, is not a disease but a serious metabolic derangement due to the fact that cholesterol has an important role in the pathogenesis of atherosclerosis. Hyperglycemia, characterized by excess of sugar in the blood, is a disorder that can cause several complications such as amputation and blindness. Too much urea in the blood is a strong indicator that the individual may have liver and kidney diseases. Having these problems in sight, make it easy to notice how important the control of glucose, cholesterol and blood urea levels is. Then comes the need to create a device to monitor the levels of these Hemo metabolites simultaneously and daily once they can rapidly change. The clinical analysis methods that are currently being used in laboratories are expensive since they rely on duly qualified staff, large instruments, and appropriated place among other costs. Also, these tests bring some discomfort to the patient because of the need for a significant amount of biological fluid, which is usually collected with the use of needles and syringes, and thus can be considered invasive methods.
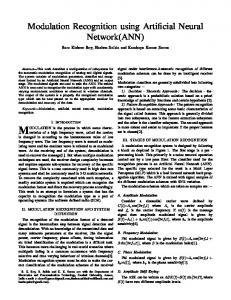
Figure 1. Representation of a biosensor: biocatalyst.
Figure 1 shows the basic components of a biosensor. In (a), we have the biocatalyst, where the biochemical reaction responsible for generating the signal occurs in (b) we have the transducer in (c) the amplifier and in (d) the results. The first biosensor was developed by Clark and Lions in 1962, and this became known as enzymatic electrodes, it can be seen in the figure 2. The enzymatic electrodes or biosensors are used in a number of analytical determinations, in which the detection rate of glucose on the blood is highlighted.
Figure 2 – Enzymatic biosensor by Clark e Lyons.
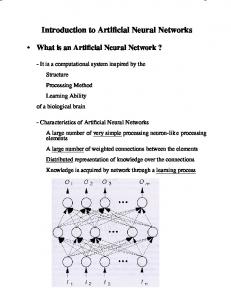
3.1 Immobilization In a biosensor the enzyme is usually immobilized on the electrode surface along with another reagent that will react with one of the Hemo metabolites. In this study, the enzymes are immobilized using dendrimers. Dendrimers are monodisperses macromolecules, highly branched, with well-defined structures and uniform molecular weight, as shown in Figure 4. This class of compounds has received great attention from researchers because they have molecular uniformity, multifunctional surface and the presence of internal cavities. These specific properties make dendrimers suitable for the immobilization of enzymes.
From the invention of Clark and Lyons, several types of biosensors have been developed for different types of clinical analysis, obtaining the most prominent biomedical analysis such as the monitoring of Hemo metabolite in human blood (such as glucose, cholesterol and urea). The amperometric biosensors provide the ability to capture an electrical signal that is proportional to the analyte concentration (Hemo metabolite analyzed). They are the most common biosensors found in the market and are shown in Figure 3.
Figure 4 – Illustration of a dendrimer structure.
IV. ARTIFICIAL NEURAL NETWORKS
Figure 3 – Commercial amperometric biosensors used in clinical analysis. III.
THE CHEMISTRY IN BIOSENSORS
The main components of a biosensor are the enzymes. The enzymes are biocatalysts that have high selectivity rate. They are proteins with the specific function of speed up chemical reactions that occur under unfavorable thermodynamically conditions. They considerably accelerate the speed of chemical reactions in biological systems when compared to corresponding non-catalyzed reactions. This is achieved by lowering the activation energy required for a chemical reaction, resulting in increased speed in the reaction and enabling the metabolism of living beings. The catalytic ability of enzymes makes them suitable for industrial applications such as in pharmaceuticals or food industry. The enzyme acts on the substrate witch is transformed into a product. In the absence of enzyme little product is formed, otherwise, the reaction is processed at high speed. Enzymes are the most specific catalysts known for both the substrate and for the reaction performed on the substrate.
Artificial Neural Networks are computational techniques presented in a mathematical model inspired by the neural structure of intelligent organisms and acquiring knowledge through experience. An artificial neural network can have thousands of processing units. Furthermore the brain can have billions of neurons. The nervous system consists of an extremely complex set of neurons. The neuron can be considered the basic unit of the structure of the brain and the nervous system. The communication is done through pulses, when a pulse is received the neuron processes it, and after a certain action threshold is reached, the neuron triggers a second pulse that produces a neurotransmitter substance which flows from the cell body to the axon. They have an essential role in determining the performance, behavior and ratiocination of human beings. 4.1 General features The artificial neural models, try to bring the computer processing to the human brain, and they correspond to algorithms that mimic the biochemical process of the brain and are similar to this on two points: a) Knowledge is gained through learning steps and b) Synaptic weights are used to store knowledge. Synapse is the name given to the connection between
neurons, in it is assigned values that are called synaptic weights. The artificial neuron is a binary logical-mathematical device that tries to simulate the functions and behavior of a biological neuron. Thus, dendrites are represented by entries where connections with the artificial cell body are made through elements called weights that simulate synapses. Stimuli captured by the input are processed by the weighted sum function of signals, and the threshold for triggering the biological neuron was replaced by the transfer function to the output. Combining several artificial neurons we can form the so-called Artificial Neural Network, a schematic example is shown in Figure 5. 4.2 Training The most important property of neural networks is the ability to learn and thereby improve their performance. They learn by rote memorization, contact, examples, by analogy, by exploration and also by discovery. This is done through training, iterative process of adjustments applied to the weights. Learning occurs when the artificial neural network reaches a generalized solution to a class of problems.
− Input Layer: where patterns are presented to the network; − Intermediate or Hidden Layers: where most of the processing is done through weighted connections, can be considered as features extractors; Layer Output: where the final result is completed and submitted.
Figure 6 – Representation of a multilayer perceptron.
4.4 ANN development 4.4.1 Data Collection The first step of development of an ANN is the collection of data of the problem and the separation into a training set and test set. This task requires a careful analysis of the problem in order to guarantee no ambiguities or data errors. Furthermore, the data must be meaningful and cover the entire problem domain and should not cover only the normal or routine operations but also the exceptions and the boundary conditions of the problem domain.
Figure 5 – Representation of the architecture of an artificial neural network(ANN).
4.3 Multilayer perceptron The multilayer perceptron, as the diagram in Figure 6, was designed to solve complex problems, which could not be resolved by the basic model of neural network, also known as single-layer perceptron, witch only has the input and output layer of neurons. The backpropagation algorithm uses supervised learning this means he try to find iteratively the smallest difference between the desired outputs and the outputs obtained by the artificial neural network, with a minimum error. It works by adjusting the weights between the layers through the backpropagation by correcting the error detected, with other words, propagating the error from the output layer to the input layer in each iteration. Usually the layers are classified into three groups:
4.4.2 ANN Configuration After collecting the data it is time to setup the configuration of the ANN, which can be divided into the following steps: 1.Selection of an appropriate neural paradigm for the application. 2.Topology determination of the ANN to be used (number of layers, number of artificial neurons in each layer, etc.). 3. Determination of parameters of the learning algorithm and activation functions. This step has a huge impact on the system performance. Usually these choices are made on an experimental basis. The setting of ANNs requires experience designers. 4.4.3 ANN Training At this stage following the training algorithm chosen, the weights of the connections are adjusted. It is important to consider aspects such as the initialization of the ANN, the training mode and the time spent to train it. 4.4.4 Tests
During this phase the test set is used to determine the performance of the ANN with data that were not previously used. The performance of the ANN at this stage is a good indication of its actual performance.
•
4.4.5 Integration Finally with the ANN trained and evaluated, it can be integrated into an operating environment system of the application. For increased efficiency of the solution this system should include usability facilities as a convenient interface and an ease acquisition of data through spreadsheets, interfaces with signal processing units, or standard files.
•
V.
Glucose < 45 mg/dl (2.52 mmol/L) neurological symptoms of hypoglycemia, which can extend from a decrease in cognitive function even lead to unconsciousness. Glucose > 450 mg/dl (25.2 mmol/L) diabetic coma due to lack of insulin. Cholesterol > 240 mg / dl (6.2 mmol/L) serious risk of heart disease.
ANN FOR HEMO METABOLITES ANALYSIS
The biosensors are a promising tool to supplement the clinical analysis techniques due to its properties such as selectivity, low cost of construction and storage, potential for miniaturization, making it easy to build simple and portable equipment where the patient himself could do all the monitoring. The experimental procedure was basically divided into three stages. The first stage consisted by obtaining the reaction curves of the Hemo metabolites with the chemical components of the biosensor. In the second stage the data representing the curves were normalized and presented to the ANN. The third and final stage consisted of comparing the response data to validate the developed ANN and the method of analyzing curves proposed in this paper. 5.1 Obtaining Curves The curves shown in this paper are obtained from the chemical reaction between the conductor and the Hemo metabolites present in the biosensor. As in any chemical reaction there are electron transferences, we used a Keitlhey voltage/current source to obtain each concentration curve of each of the three Hemo metabolites, a model 237 (K237) was used as shown in Figure 7, this voltage source is capable of responding which electric current was produced in a chemical reaction in a given time. The response is given as a time curve in the y-axis, measured in seconds, and electric current in the x-axis, measured in amperes. This measuring unit source accurately characterize the environment in which a patient will measure the concentrations of their Hemo metabolites using a common amperometric meter as previously shown. For each Hemo metabolite - cholesterol, urea and glucose 181 samples were made starting at 0.2 mM (0.2 mmol/L) then 0.4 mM (0.4 mmol/L) and increasing the concentration with 0.2 mM for each sample up to a concentration of 36.2 mM (36.2 mmol/L). This way for all three Hemo metabolites we will be covering the concentrations for medical interest, because the normal concentration of these blood components are shown in Table 1. Is worth remembering that: • Urea > 214 mg/dl (35.6 mmol/L) is indicative of acute renal failure.
Figure 7 – Keitlhey measuring unit source model 237. Hemo metabolite
Concentration of problems in humans (adults of both sexes) Glucose When the fasting glucose exceeds 11.2 mmol/L (200mg/dl of blood) Cholesterol 240 mg/dl (6.2 mmol/L) higher total cholesterol Urea When the urea concentration exceeds 8.3 mg/dl (1.4 mmol /L) Table 1 – Concentration of Hemo metabolites for medical interest
Figure 8– Biosensor used for the reaction with Hemo metabolite.
Each of these concentrations was placed to react with the biosensor, shown in figure 8, producing curves as shown in Figure 9, generated through the measuring source.
below, because even after going through the transformations, the curves remain with the same format. Figure 10 shows the values for the reaction around 20 mM cholesterol with the reagent of the biosensor. In the y-axis is time in seconds of the chemical reaction and the x-axis is the electric current produced measured in uA. The graphs presented in Figures 11 and 12 have the same data described in Figure 10, but their axes are respectively formatted using the standardization by the range of variation and the standardization by standard deviation.
Figure 9– Response of the electric current as a function of glucose concentration.
5. 2 Data preparation With the curves of current x time, as shown in Figure 9, the data representing the curves were standardized to be presented to the ANN to be tested and validated. The following techniques were used: 1. Standardization by the range of variation, where the point to be standardized is subtracted by the lowest value point on the set and divided by the difference between the highest and the lowest points of the set. (4.1) 2. Standardization by standard deviation, where the point to be standardized is subtracted by the average of the set of points and divided by the standard deviation of the set of points.
Figure 11 – The current response time for the reaction of 20mM with axes standardized via standardization by the range of variation
(4.2)
Figure 12 – The current response time for the reaction of 20mM with axes standardized via standardization by the standard deviation. Figure 10 – The current response time for the reaction of 20mM
These patterns were chosen because they maintain the characteristics of the curves this can be seen in the figures
The concentration values of the curves were also standardized using the same techniques. The Hemo metabolites were also identified numerically, but as in this
case the identification job of the ANN is to classify the curve analyzed in one of the three classes of Hemo metabolites that are being studied in this article, the desired response for the classification is shown in Table 2.
• •
NEURON 1 NEURON 2 NEURON 3 CHOLESTEROL 1 0 0 UREA 0 1 0 GLUCOSE 0 0 1 Table 2 – Desired response for the classification of curves in three classes of Hemo metabolites
5.3 Determination of the ANN structure After the data is ready for presentation to the ANN, it was necessary to determine what structure of the ANN we were going use, how many nodes in the input layer, or how many input variables is needed for the ANN accurately determine what concentration of Hemo metabolites and which Hemo metabolite is being measured, and also in the hidden layer of the network how many nodes are needed. 5.3.1 Data separation for the formation of testing, validation and control groups As a beginning of testing, due to the large number of curves that were available, 181 (one hundred and eighty-one) curves for each Hemo metabolite, the curves were divided into three groups. A group called test, with 327 (three hundred twenty-seven) curves with 109 (one hundred and nine) curves for each Hemo metabolite that was used for the learning of the ANN, 60% (sixty percent) of all curves. Another group called validation with 108 (one hundred and eight curves), 20% (twenty percent) of all curves, 36 (thirty six) curves for each Hemo metabolite used for testing (to verify that the values of free parameters of the ANN, synaptic weights, momentum and learning rate causes the ANN to determine which Hemo metabolite is being measured and what is its concentration) the ANN. Also another group called control, also with 108 (one hundred and eight) curves with 36 (thirty six) curves for each Hemo metabolite, 20% (twenty percent) of all curves, to ratify the free parameter values obtained, the table 3 summarizes the data curves. CHOLESTEROL UREA GLUCOSE TOTAL TEST 109 109 109 327 VALIDATION 36 36 36 108 CONTROL 36 36 36 108 TOTAL 181 181 181 543 Table 3 – Formation of validation, control and group tests.
5.3.2 Presentation of data to the ANN for tests For testing purposes the data were presented as follows: • The training mode is sequential, this means that after each presentation of a set of example the error backpropagation occurred for the correction of the synaptic weights. • During the training phase of the ANN cholesterol, urea and glucose curves were alternately presented to the ANN, but respecting an order of increasing
concentration value. For validation and control the curves were presented randomly to the ANN. Data using both standardization were presented, but in the first tests the standardization by the range of variation method was proved to be better be reaching better results, once this standardization produce results with values between 0 (zero) and 1 (um) which facilitates the ANN process of learning (SCHALKOFF, 97), furthermore, the data was standardized by the standard deviation were not used in the test.
5.3.3 First test For all tests, the ANN used is the multilayer perceptron, feedforward, using the backpropagation algorithm to adjust the synaptic weights. For the first test we used the following structure of the ANN: • Input layer with two neurons to receive the ordered pairs (electric current, time). • A hidden layer with 10 (ten) computational neurons and with a nonlinear sigmoid activation function. • The output layer with 4 (four) computational neurons and nonlinear sigmoid activation function. • Learning rate equals to 0.6 and momentum equals to 0.3. We used three different neural networks, one of them developed using MATLAB R2008a a second one using the Nets 3.0, and a third one using the ANN software developed during this work. The ANNs developed using MATLAB R2008a and Nets 3.0 are being used in this work also to check the performance of the ANN software developed in this work, this software is being called SJRNA in the text. The results obtained in the first trial are listed in Table 4. Simulator
Epochs
Hits of concentration
Hits of Hemo metabolite
SJRNA
3500
0%
Nets 3.0
3500
0%
100% 100%
MATLAB
3500
0%
100%
Table 4 – Results of the first test
The 100% value of accuracy is considered as follows, for example: • Considering the concentration of 5.2 mmol and 5.4 mmol its standardized values are 0.138889 and 0.144444. • It is considered that there was an error by the ANN when the difference of the produced value by it is greater than 0.001, this error is enough so that the ANN can accurately determine with precision the concentration value, once the smallest difference between the two concentrations in sequence is 0.004,
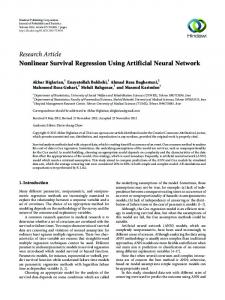
and to determine which class of Hemo metabolite the curve belongs this error is quite satisfactory, because there are only three classes to be checked and the worst output produced by the network had the following values: (0.9989 / 0.00108 / 0.001783) produced by the first test. The three ANNs used in the first test were proven to be very effective concerning the identification of which Hemo metabolite belongs to the points of the analyzed curve, but were unable to identify the concentration of each curve, this was due to the existence of a large amount of ordered pairs (current, time) that belonged to more than one same curve. And another problem was the delay in making a training because each curve to be presented consists of 150 ordered pairs (current, time), this way the need to reduce the amount of data to be presented to the ANN was observed and also the need to introduce some other variables in order to the ANN have a reasonable performance in identifying the concentration. 5.3.4 Second Test For the second test, due to the need to decrease the amount of ordered pairs representing each curve and the introduction of new variables to improve the performance of the ANN the following changes in the training set and structure of ANN were made: [1] For each curve was calculated the area of the curve peak, as shown in Figure 13, and the breadth and these two data began to be used as input parameters of the ANN by increasing the number of entries from two to four. [2] To decrease the number of ordered pairs representing each curve only the ordered pairs from the peak were used, this way each curve is going to be represented by 40 (forty) ordered pairs (current, time).
Figure 13 – The curve peak is shown in evidence.
With the changes the ANN configuration was as follows: Input layer with 4 (four) neurons to receive the parameters of the peak area, curve peak width and the ordered pairs current and time. • Hidden layer with 10 (ten) computational neurons and sigmoid nonlinear activation function. TABLE II. The output layer with 4 (four) computational neurons and sigmoid nonlinear activation function. TABLE III. Learning rate equals to 0.6 and momentum equals to 0.3. TABLE I.
The results with the introduction of these changes can be seen in Table 5 below. Simulator SJRNA Nets 3.0 MATLAB
Epochs 1300 1500 1100
Hits of Concentration 97% 99% 99%
Hits of Hemo metabolites 100% 100% 100%
Table 5 – Results of the second test.
The 100% value of accuracy is considered as follows, for example: • Considering the concentration of 5.2 mmol and 5.4 mmol its standardized values are 0.138889 and 0.144444. • It is considered that there was an error by the ANN when the difference of the produced value by it is greater than 0.001, this error is enough so that the ANN can accurately determine with precision the concentration value, once the smallest difference between the two concentrations in sequence is 0.004, and to determine which class of Hemo metabolite the curve belongs this error is quite satisfactory, because there are only three classes to be checked and the worst output produced by the network had the following values: (0.9989 / 0.00108 / 0.001783) produced by the first test. The new data show that the changes that were made are essential on determining the values of the curves, once the worst result the ANN had was not capable of distinguish only 16 curves that had concentration with the difference of only 0.2 mmol. 5.3.5 Third Test In the third test all changes made in the second test were retained, but with the difference that we used two different ANNs, one to determine the concentration and another one to determine which class of Hemo metabolite belonged the analyzed curve. The ANN used to determine which class belonged the curve to be analyzed was given as follows: • Input layer with two neurons to receive the ordered pairs (current, time). • A hidden layer with 10 (ten) computational neurons and sigmoid nonlinear activation function. • The output layer with 3 (three) computational neurons and sigmoid nonlinear activation function.
Learning rate equals to 0.6 and momentum equals to 0.3. The results are shown in the Table 6 below. •
Simulator SJRNA Nets 3.0 MATLAB
Epochs 1500 1300 1100
Hits of Hemo metabolite 100% 100% 100%
Table 6 – ANN test results to determine the class of the curve
The ANN used to determine the concentration of the analyzed curve was given as follows: • Input layer with 4 (four) neurons to receive the parameters of the peak area, curve peak width and the ordered pairs current and time. • Hidden layer with 10 (ten) computational neurons and sigmoid nonlinear activation function. • The output layer with 1 (one) computational neuron and sigmoid nonlinear activation function. • Learning rate equals to 0.6 and momentum equals to 0.3. The results obtained with the introduction of these changes can be seen in the Table 7 below: Simulator Epochs Hits of Concentration SJRNA 1800 100% Nets 3.0 1500 100% MATLAB 1300 100% Table 7 – ANN test results to determine the concentration curve.
The separation into two ANNs was efficient because they began to accurately hit all the concentrations and Hemo metabolites classes. VI.
CONCLUSION
The knowledge of biosensors, the understanding of its operation, its characteristics and the chemical operation of a biosensor is important because the neural network is going to analyze the electrical signal that is obtained through chemical reactions. The method proposed in addition to the points that identify the Hemo metabolites curves and other characteristic points, in this case the peak area of the curve and the peak width of the curve, was shown efficient and an alternative to the analysis of curves using ANN. The ANN developed in this work was efficient in determining the concentrations of the curves and its classification, because in all tests the results given by it were very close to the results presented by ANNs developed using dedicated software. As a result of the project an electronic device was developed and patented that, using the biosensor allows the identification of glucose, cholesterol and urea concentrations in the blood. ACKNOWLEDGMENT Authors thanks to the Foundation for Research Support of Minas Gerais (FAPEMIG) and the Brazilian National Council for Scientific and Technological Development (CNPq) and the Biomaterial Laboratory of the Federal University of Itajubá
for all the support devoted to this work. REFERENCES [1] [2] [3] [4]
[5] [6]
[7]
[8] [9] [10]
[11]
[12] [13] [14] [15] [16]
[17]
[18] [19] [20] [21]
BURTIS, C. A.; ASHWOOD, E. R. Tietz: Fundamentos de Química Clínica. 4 ed. Rio de Janeiro: Guanabara, 1998, 836 p. CLARK, L.; LYONS, C. Annals of the New York Academy of sciences, n. 29, p. 102-123, 1968. WILSON, G.S.; GIFFORD, R. Biosensor for real-time in vivo measurements. Biosensors and Bioeletronics, n. 20, p. 2388-2403, 2005. FERNANDES, E.G.R. Biossensores nanoestruturados para monitoração de glicose. 2005. 175 f. Dissertation (Materials Engineering Master Degree) – Federal University of Itajubá. Advisor: Prof. Dr. Álvaro A.A. de Queiroz. STRYER, L.; BERG, M.J.; TYMOCZKO, L.J. Bioquímica. Guanabara Koogan, 2002. Cinética enzimática. Disponible at Accessed in October 25. 2009. BOYER, R. Concepts in Biochemistry, 2 ed., New York, Chichester, Weinheim, Brisbane, Singapore, Toronto: John Wiley & Sons, 2002, p. 137–138. FERREIRA, J. P. M. Segredos da Catalise enzimática. Boletim de Biotecnologia. Universidade Católica Portuguesa, Porto. p. 22-29. DOMINGOS, J.B.; LONGHINOTTI, E.; MACHADO, V.G.; NOME, F. A química dos ésteres de fosfato. Química Nova, São Paulo, v. 26, n. 5, Set./Out. 2003. CARRIJO, R.M.C.; ROMERO, J.R. Oxidações catalíticas e eletrocatalíticas de substratos orgânicos. O cério como oxidante. Química Nova, v. 23, n. 3, 2000. SCHMIDT, H.L.; GUTBERLET, F.; SCHUHMANN, W.; Sens. Actuators B. p. 13-14, 366 p., 1993. OKAWA, Y.; NAGANO, M.; HIROTA, S.; KOBAYASHI, H.; OHNO, T.; WATANABE, M. Bios. Bioelect. v. 14, 229 p., 1999. BERCHMANS, S.; VIJAYAVALLI, R. Surface Modification of Glassy Carbon by Riboflavin. Langmuir. n.11, p. 286-290, 1995. SOTOMAYOR, M.D.P.T.; KUBOTA, L.T. Enzymeless biosensors: uma nova área para o desenvolvimento de sensores amperométricos. Química Nova, v. 25, n 1, p. 123-128, 2002. COIERA, E.W. Inteligência Artificial na Medicina Disponible at Accessed in October 25. 2009. GONGORA, A.D. O Que é Inteligência Artificial. Disponible at Accessed in October 25. 2009. Uma introdução às Redes Neurais. Disponible at http://www.din.uem.br /ia/neurais/ Accessed in October 25. 2009. Neural Networks. Disponible at Accessed in October 25. 2009.