18th World IMACS / MODSIM Congress, Cairns, Australia 13-17 July 2009 http://mssanz.org.au/modsim09
Unsupervised Artificial Neural Nets for Modelling the Effects of Climate Change on New Zealand Grape Wines Shanmuganathan, S. 1, P. Sallis 1 and A. Narayanan 2 1
Geoinformatics Research Centre, 2 School of Computing and Mathematical Science, Auckland University of Technology, New Zealand (www.geo-informatics.org). Email:
[email protected]
Abstract: Climate change effects in weather conditions and on grape vine phenology are of significant interest as the effects could cause major deviations in wine quality. This is especially the case for the appellation excellence index that is linked to the world’s major wine regions. These regions have become famous for the finest wine they currently produce, with cultivation and winemaking practices that have been refined over the years. Initial investigations into conventional methods and approaches applied to analysing the effects of climate change, both long and short term, (or vintage-to-vintage) for viticulture generally and individual wine quality, reveal the complexity of inter-dependent variables present for such a study. Long term climate change effects on grape vine varieties, one of the most expensive cultivated crops, are described to be dramatic both in old as well as new wine producing countries. This could be due to the effects of global warming, which in the assessment of some scientists is occurring faster than anticipated with its effects being inconsistent across the globe and in extent on different vegetation. Combined with this is the geographical niche that is required for ripening grapes with ideal composition of sugar as well as colour, aroma, and flavour proteins. If the current rate of global warming continues, most of the Mediterranean countries that produce some of the finest wines in the world would no longer be able to continue to do so because they are at their peak, hence even a single centigrade degree (1oC) increase in mean temperatures could cause major deviations in the appellations produced from those wine regions, which are well known for their wine style. Published research reveals that such shifts in major wine regions triggered by climate change and consequent grape growing conditions had happened before and growing practices have changed as a result, in order to maintain wine quality consistency. A recent Australian study suggested for sufficient planning for the reestablishment of vineyards with newer varieties to suit the changing climatic conditions which is a major challenge for the wine producing regions of that country. A review of methods for modelling the effects of short term climate variability on wine quality, showed a trend towards the establishment of correlations between annual climate change and grapevine yield/ wine market trends, such as consumer demand, price and vintage ratings, and the principal chemical components responsible for colour, aroma and flavour of wines. The research described in this paper seeks to underpin the correlations between major dependent factors of climate change using precise climate data logged in numerous regions in different countries and wine quality, which is partly subjective and is generally described as being qualitative or imprecise. This data is usually in the form of opinions and can be either spoken or written but is mostly found in consumer or professional journals or published via the Internet. These descriptions of human sensory perception are often presented as wine taster comments and vary in detail, even in the expert ratings given by sommeliers. The experimental approach described here is a continuation of some earlier research by the authors on the application of WEBSOM (SOM: self-organising map, also see http://websom.hut.fi/websom/) combined with some non-parametric statistical methods used to analyse the correlations between vintage-to-vintage climate change effects on the quality of New Zealand Pinot Noir wines, using precise and imprecise data. The principal data variables included in this research are: temperature standard deviation during growing season for weather conditions, and aroma, flavour and taste descriptors extracted from sommelier comments for wine quality in a small sample set of wines produced from Kumeu wineries in northern New Zealand from 1997 to 2006. Using this multivariate value framework the paper illustrates the web text mining approach (WEBSOM) for modelling the interrelations between vintage-to-vintage climate change factors and wine quality descriptors and concludes with consideration of some future research directions. The results of WEBSOM and discriminant analysis (50% cases correctly cross-validated) show promise for modelling short term climate change effects on wine quality. Keywords: WEBSOM, Self-organising maps (SOM), climate change effects, wine quality
803
Shanmuganathan et al., Unsupervised ANNs for Modelling the Effects of CC on NZ Grape Wines
1.
INTRODUCTION
Climate change effects on viticulture and wine quality can be basically classified into two major kinds; firstly, that of long term, such as global warming, and the second is from short term or the generally referred to as vintage-to-vintage variability. Ample historical evidence exists to show that long term climate changes occurred ever since viticulture records began, especially the European, and how such changes have forced regional shifts as well as the rise and fall of the world’s famous wine regions in the past. Long term climate change influence in viticulture and enology is in many studies described to be an ongoing phenomenon as vineyards are moved from site/ region to site/ region in search of that ideal geographical niche for ripening grapes with maximum sugar without comprising any colour, aroma and flavour proteins that would in turn enable the winemaker to produce finer wines in appellations produced in these regions. Of particular interest is the Mediterranean region, where even a single degree centigrade (1oC) increase in mean temperatures could cause major deviations in the appellations produced from this region, which is well known for its fine wines (Jones, 2004 and 2005). Incidentally, research findings on Australian grapevines wines (Webb, 2006) suggest for replanting of suitable grapevine varieties as a way to overcome the future climate change effects (induced by greenhouse gas emission) in the country’s major wine regions. This has been described to be a significantly expensive exercise (Gutierrez, 2005). The short term climate change could cause deviations in grapevine phenology leading to some perceivable changes within wine appellations/ styles, specific and describable by sommeliers with a language consisting of wine descriptors that can convey the wine characteristics in quality and quantity as well (linked to numbers) (Brochet, 2001). But this form of interpretation is seen as rather a “subjective way of expression” by scientists, modellers and the like even though published work on research portrays sommeliers’ capability to express cognitive specificity of chemical senses in wine descriptors as unique and accurate. Section 2 outlines literature reviewed on conventional approaches in modelling the vintage-to-vintage climate variability in wine quality. The following section elaborates upon the WEBSOM (SOM: self-organising map) approach being adopted herein to break down the sommelier comments into wine descriptor groups and the rigorous statistical methods investigated for finding the correlations between the descriptors, wine ratings, as well as climate change effects in weather conditions captured at various time intervals, hourly, daily and monthly or with cross cutting i.e., macro-meso-micro scale factor correlations. Section 4 discusses about the results of the methods so far experimented while the conclusion looks at possible future research for developing prediction models on the vintage-to-vintage climate change effects on wine quality. 2.
MODELLING THE VINTAGE-TO-VINTAGE VARIATIONS IN WINE QUALITY
Initially, this section looks at the sommelier language and wine descriptors, price and ratings based approaches, and then briefly reviews the basic methods used for characterisation of chemical properties in modelling the short term climate change effects on wine quality. 2.1.
Vintage variability versus sommelier comments, ratings and pricing in wine quality
In viticulture, vintage-to-vintage variation effects, especially on fruit quality is caused by terroir (climate, soil) and cultiva (or variety). Of these, the influence of the former is described to be major with their impacts established as (50%) for climate, (25%) for soil and (10%) for cultivar. Based on these results, van Leeuwen (2004) concluded climate as the major influence exerted specifically through vine water status. The study looked at the influence of all variables representing terroir and cultiva simultaneously on vintage-to-vintage vine development and berry composition of non irrigated vitis vinifera on gravelly soil (with heavy clay subsoil and sandy soil as well as water table within the reach of roots). The wine appellations affected in this quality study included; Merlot, Cabernet franc and Cabernet Sauvignon. The climate variables used for the study consisted of maximum and minimum temperatures, degree days (base of 10°C), sunshine hours, ETo, rainfall, and water balance for a four year period from 1996 to 2000. Grifoni (2006) argued that the climate variation as the main influencing factor on vintage-to-vintage (or interannual) variability in wine quality describing the other three i.e., grape variety, rootstock and soil type, as rather constants. Furthermore, stated cultivation techniques as human factors, explaining these to be responsible for long-term variability because of the long periods required by grape growers for adoption of any modification in production methods. The authors analysed monthly or multi monthly average air temperature and cumulated precipitation for 500 haP geopotential height (over the Mediterranean sea) and sea surface temperature for northern hemisphere growing season (January to October). The other variables, included in the analysis were North Atlantic Oscillation and Southern Oscillation indices. The results were found to be in consistent with some previous correlation obtained between wine quality and May to October
804
Shanmuganathan et al., Unsupervised ANNs for Modelling the Effects of CC on NZ Grape Wines
air temperatures. The study concluded that the high values of the climate variables to be responsible for high temperature and dry conditions during the summer months in Italy, generally observed to be favourable for high quality wine. Ashenfelter (1995) showed how the correlations between price and quality of the vintage could be modelled with an example set of French red Bordeaux wines (as judged by the prices of mature wines) using regression techniques with the season weather that produced the wines, logarithm of price of different vintages of a portfolio of Bordeaux Chateau wine. Variables used in the analysis were; age of vintage and weather variables, such as temperature, (during growing season i.e., April-September), rain in September and August, rain in the months preceding the vintage i.e., October-March, average temperature in September R2 (root mean squared error) for vintages of 1952-1980 excluding 1954 and 1956, as these wines were rare, the two vintages being considered as the poorest in the decade. Jones (2005b) discussed of climate and global wine quality factors and elaborated upon a study on a year-toyear comparison over a ten year period. The study included a description of wine quality factors in juxtaposition with prices and vintage ratings. Citing many earlier studies the authors of this work pointed out that the analysis of the relationships between climate variables and wine prices to be based on an underlying hypothesis that beneficial climate conditions would improve the wine quality and that in the past these had in turn led to short term price hikes. They also reflected that unavailability of consistent price data for multiple regions and with different styles over many years to be a shortcoming for any complete analysis/ study on long term effects. They also argued that the vintage ratings to be a strong determinant of the annual economic success of a wine region based on the work in (Nemani 2001) but then went on to say that the ratings could be determinants of wine quality not necessarily a predictor based on (Ashenfelter, 2000) where ratings were described to be reflective of wine somewhat in an indirect way i.e., they had the same weather factors documented to be the determinants of the same wine quality. Frost (2002) used pairs of liking ratings and 14 wine descriptor intensities, originally collected for analysis with statistical methodologies (partial and least square regression), to create a second map with liking ratings on y axis and the sensory descriptive data of the wines on x axis. The model only accounted for 25% of the variation, described to be very low. However, the authors made the following observations based on the map results: 1) some of the wine descriptors used in the analysis, such as “leather”, and “sour” as exerting a negative effect on the preference, meaning subjects liking scores were low for wines with these descriptors and 2) Subjects liked wines with certain descriptors, such as “vanilla/oak”, “canned vegetables” and “green olives” over to wines with high “buttery” or “berry”. As the model failed to explain the driving factors for the remaining 75% of the variation, a majority of the sample, the authors cautioned readers in using their results. Please note that the second approach is not with free text on wine taste instead used data obtained from a trained panel to rate the intensity of each of 14 wines used in the study. 2.2.
Wine characterisation and discrimination using chemical properties
Most of the literature reviewed in wine sensory data analysis falls into this kind of analysis. They all in essence looked at finding the best means for identifying any differences to develop sub-appellations within major wine appellations such as, champagne, chardonnay, and pinot noir. For example, when discussing on developing a distinctive New Zealand wine style Marlborough Sauvignon Blanc, Parr (2007) looked at classifying the wine appellation by sensory characterisation and chemical analysis using selected aroma compounds. Meanwhile, Kontkanen (2005) investigated into the differences that might be supportive of designating three sub-appellations within red Niagara Peninsula Bordeaux style with chemical and sensory analysis results of forty-one commercially available wines from that region. In a similar manner, Vannier (1999) and Gawel (2001) looked at strategies a) to control champagne wine quality based on sensory and b) red table wine quality characterised by pleasing and complex mouth-feel sensations respectively. Research on professional versus novice taster abilities as well is seen to be significantly extensive. 3.
WEBSOM IN MODELLING VINTAGE-TO-VINTAGE VARIATION IN WINE QUALITY
Sommelier comments and ratings of 30 Kumeu wine (New Zealand) from an online wine magazine (www.winemag.com) are used for modelling the short term climate change effects on the vintage with WEBSOM and conventional statistical analyses. The following are the major steps adopted to produce a matrix of meaningful wine descriptors (weighted) based on their presence in the sommelier comments: 1) pre-process web text to a text file 2) remove stop words 3) reduce verbs to lemmas (verb base) using standard stemming algorithms i.e., porter stemmer.
805
Shanmuganathan et al., Unsupervised ANNs for Modelling the Effects of CC on NZ Grape Wines
4) discard very rare and common words based on wine chart by Campbell Bob (2000) and prepare wine descriptor weight matrix based on the occurrence of each and every word (descriptor) based on its presence in each wine comment and the collection of comments. The weighted wine descriptor frequency matrix is calculated NZ wine appellation using the well-known Salton region vector space model based on Northland Cabernet Sauvignon, Merlot and formula (1) (Salton, 1983) Chardonnay 5) merge text and numeric data into Auckland Cabernet Sauvignon one table Waikato Chardonnay, Riesling and Cabernet (1) Where, tfi = term frequency (counts) or number of times a term i occurs in a document. dfi = document frequency or number of documents containing term i D = number of documents in the collection/database.
Sauvignon Muller Thurgau, Chardonnay and Gewurztraminer Sauvignon Blanc, Chardonnay, Cabernet Sauvignon and merlot Shardonnays, Rieslings and Pinot Noir
Gisborne Hawkes Bay Wellington Nelson
Rieslings and Chardonnay
Marlborough
Sauvignon Blanc, Chardonnay, Pinot Noir and Riesling, Pinot Gris, Gewurztraminer, Merlot and Cabernet Sauvignon
Waipara
Pinot Noir, Chardonnay Riesling and Sauvignon Blanc Pinot Noir, Chardonnay, Riesling and Pinot Gris Pinot Noir, Riesling and Chardonnay
Canterbury
Step 4 brought down 368 wine descriptors to 51. 3.1.
Otago
Table 1. New Zealand wine regions and appellations.
WEBSOM approach
WEBSOM is seen as an efficient tool for text information retrieval especially in the exploration of large collections of 1 documents. It generates a SOM , a 2D display of words based on the statistics of co-occurring words in collections of text corpus. WEBSOM applications, such as, search and exploration of documents (Lagus, 1996), unsupervised (Kaski, 1996), partially supervised processing of newsgroups (Honkela, 1996), browsing interface for web pages for the exploration of document collections (Lagus, 1996a) and as a tool for data mining in textual databases (Lagus, 1996b) evidence its potential in web text mining. In this research, WEBSOM is used to group the cooccurring words to study the year-to-year variations that may exist between the word groups that best describe the wine quality, its sub-appellation in terms of appearance, aroma and mouth-feel. For further details on the approach please see (Shanmugathan, 2008) that used Pinot Noir wines from New Zealand.
cherri tart dri herb smoki
mocha
C8
C11 smoke
C1 black
herbac
vintag
C7
dry rich
C4
finish
open
bodi fine full
acid pear toast
lemon C9 lime
melon butter round spice subtl
C6
oaki
C12 fruit
miner nectarin
zesti
C2
complex fresh
C3 refresh
live
honei
soft sweet
white
ripe
C10 appl balanc crisp tropic
C5 citru peach pineappl
bottl structur
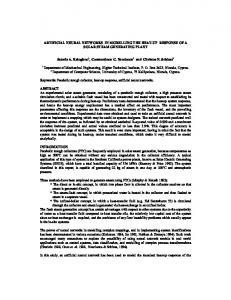
Figure 2. 12 cluster SOM (with 45 nodes) created using 51 wine descriptors extracted from comments made by sommeliers on 30 Kumeu (New Zealand) wines produced 1997-2006 (source: www.winemag.com/buyingguide/ SOM final errors: normalized distortion 0.4673 and quantization error: 0.3057 (Viscovery (software package. source: www.eudaptics.com/)
1 A SOM (self-organising map) is single layered, feed forward artificial neural network (ANN) that enables the projection of multidimensional data sets onto low (two- or one) displays for easy visualisation and analysis of any correlations within the vectors being analysed. The SOMs are well-known for their ability to preserve details embedded in the raw data. Artificial neural networks (ANNs) are collocations of elements called ‘neurons’ with weighted connections between them. The neuronal structure, the connections, training and recall algorithms define the network architecture. The neurons and ANN structures are imitations of biological (human/animal) nerve and brain cell structures. ANNs became more popular since the 1960s because of their ability to solve problems found to be impossible by conventional algorithmic computing methodologies.
806
Shanmuganathan et al., Unsupervised ANNs for Modelling the Effects of CC on NZ Grape Wines
Wine descriptor frequency
Sum of C 1: finish, black, open, vintag
cy n e u q e fr r o t p ir cs e d e n i w
Kumeu wines 1997-2006 2.5 2 1.5 1 0.5 0
yr1997
yr1998
yr1999
yr2000
0.147
0.612275
0.3865
0.306125
0.2835
0
0
Sum of C 2: fruit, miner nectarin, complex fresh intens, refresh 0.025942857 0.344914284 0.103771428
yr2001
yr2002
yr2003
yr2004
yr2005
yr2006
0.034125
0.06825
0.1365
0.102375
0.228785714 0.271771431 0.025942857 1.16502858
Sum of C 3: zesti, honei, soft sweet, white
0.4176
0.4
0
0.2
0
0
0.53522
0
0.3352
Sum of C 4: acid pear toast, bodi fine full, dry rich
0.13425
0.3913
0.363575
0
0.222275
0.1736375
0.5035375
0.0735
0.3657625
Sum of C 5: citru peach pineappl, bottl structur
0.22272
0
0.1148
0.21022
0.04772
0.16532
0.31536
1.1386
0.10512
Sum of C 6: melon, butter round spice subtl
0.4227
0.55004
0
0
0.1176
0.1
0
0.4403
0
Sum of C 7: smoke, herbac
0.48855
0
0.97715
0
0
0.3891
0.19455
0
0
Sum of C 8: cherri tart, mocha Sum of C 9: lemon, lime Sum of C 10: ripe, appl balanc crisp tropic Sum of C 11: dri herb smoki Sum of C 12: oaki, live ssd/meanT
0
0.2594
0.2594
0.3257
1.15233333
0
0.544
0
1.08805
0
0.25
0
0
0
0
0.17782
0.17502
0.17502
0
0
0.2051
0.43064
0.16532
0.54824
0
0
0
0.95073333
0
0
0
0
0
0.58805
0
0.588
0
0
0.72536667 0.72536667 0.294
0
0.14583333 0.14583333
0
1.814285714 1.928571429 1.571428571 1.657142857 1.557142857 1.471428571 1.528571429 1.714285714 1.814285714 1.657142857
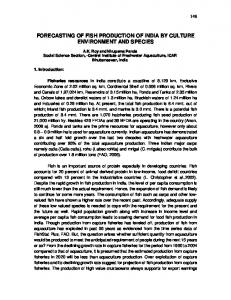
Figure 2. Histogram of Kumeu (New Zealand) wine descriptor frequencies in each year from 1997 - 2006, obtained from 12 clusters of a SOM (of 45 nodes and clustered using SOM cluster indicator) created with 51 variables (wine descriptor frequencies calculated using formula (1) (section 3) for 30 cases / Kumeu wine comments being analysed with the WEBSOM approach herein). The descriptor values in the graph are calculated by adding the descriptor frequencies of the Kumeu wines produced in the same year. For example, yr1997 values were calculated by adding each of the 12 cluster profiles for Kumeu Chardonnay 1997 rated 90 and sold at $25/ bottle, Kumeu Mate’s village Chardonnay 1997 rated 90 sold at $40/bottle as well as Kumeu 1997 Sauvignon Blanc rated 88 sold at $17/bottle. Hence, each year on x axis consists of 12 wine group descriptor frequencies for that year (1 through 12) and lastly, standard deviation/ mean temperature (ssd/meanT), as vertical bars and this enables to visualise the absence/ degree of descriptor presence against the temperature variation. An interesting observation that could be made from the graph is that year 1998, with the highest ssd/meanT within the period analysed herein consists of high descriptor frequencies for clusters C 2, C 3, C 6 and C 10 descriptors. Meanwhile, year 2002 with the lowest ssd/meanT consists of higher frequencies for C 5, C 8 and C 11 descriptors. Discriminant analysis ran on the data set produced 11 words (boxed in the left) as contributing factors in determining the variable vintage (or year considered as a dependent variable on the 11 descriptors). C1 descriptors are present in all years. ssd/meanT: standard deviation of daily mean temperature for the growing season (Sep.-April). Source for temperature data: National Institute for Water and Atmospheric Research (NIWA).
807
Shanmuganathan et al., Unsupervised ANNs for Modelling the Effects of CC on NZ Grape Wines
New Zealand wines and wineries New Zealand is generally classified as a cool-climate grape area with a growing season of 7-8 months (September-April) and heat units in the grape producing regions ranging from 950 - 1500 Degrees oC days – base 10 oC, an index adopted to describe grapevine ecology (Jackson, 1983). New Zealand wine regions and appellations produced from these regions are listed in table 1, Kumeu falls within the Auckland region. Wine descriptors and growing season mean temperature variation in Kumeu wines (1997-2006) In a SOM (Figure 1) created with 51 wine descriptors (extracted from comments of 30 Kumeu wines produced during 1997-2006) are grouped into 12 clusters based on their weighted word co-occurrence frequencies. The profile of these wine descriptor clusters for each year from 1996 to 2007 (Figure 2) are analysed to see the vintage-to-vintage variations in descriptors and any correlation/s between these and the standard deviation in mean temperature (growing season i.e., September - April) of the grapes that produced the wines) and are discussed herein. The histogram of these 12 SOM cluster profiles show that the plot for year 1998, with the highest ssd/meanT within the period analysed, consisting of higher descriptor frequencies for clusters C 2, C 3, C 6 and C 10 descriptors. Meanwhile, year 2002 with the lowest ssd/meanT consists of higher frequencies for C 5, C 8 and C 11 descriptors. Temperature data used herein was obtained from National Institute of Water and Atmospheric Research (NIWA:http://cliflo.niwa.co.nz/pls/niwp/wstn.get_stn) Discriminant analysis ran on the 51 wine descriptors produced 11 of them as contributing factors in determining the variable class vintage and is discussed in the next section 4.
DISCRIMINANT MODEL FOR PREDICTING THE VINTAGE USING WINE DESCRIPTORS
A discriminant model developed with 7 functions to predict the 9 vintage classes (1997-2006, both inclusive leaving out 2001) with 11 wine descriptors of the total 51 (of 30 Kumeu wines) along with their standardized canonical and coefficient discriminant functions are presented in figures 3 and 4. The model correctly classified 76.7% of original grouped cases and 50.0% of cross-validated grouped cases (30 cases in total). The results show that there are correlations between temperature variations and some descriptors. Variables Entered/Removed a,b,c,d Step Entered Residual Variance 1 spice-42 29.138 2 sweet-45 22.022 3 pineappl-34 17.459 4 dri-12 13.715 5 complex-10 11.796 6 zesti-51 9.902 7 citru-9 7.384 8 fresh-16 5.851 9 open-31 5.038 10 tropic-48 3.675 11 structur-43 3.124
Standardized Canonical Discriminant Function Coefficients Function 1 2 3 4 5 6 citru-9 -2.473 .591 .211 .553 -.764 .604 complex-10 12.264 -1.558 1.124 1.146 -.768 .863 dri-12 -10.025 1.610 .192 .012 .424 -.011 fresh-16 -7.063 .772 -.648 -.850 1.166 -.046 open-31 4.818 1.016 -.878 -.044 -.420 .389 pineappl-34 5.751 1.290 1.193 -1.262 -.019 .184 spice-42 5.799 1.292 .821 .241 .202 .036 structur-43 -3.040 -1.417 -1.103 .493 .175 -.116 sweet-45 -3.033 2.587 -.343 -.286 .750 -.457 tropic-48 -1.467 -.170 1.220 .504 .094 .487 zesti-51 7.981 -.342 -1.257 .084 -.171 .348
7 -.950 -.452 .608 -.132 -.321 .192 -.252 .535 .367 .319 .116
At each step, the variable that minimizes the sum of the unexplained variation for all pairs of groups is entered. a.
Maximum number of steps is 104. b. Maximum significance of F to enter is .05. c. Minimum significance of F to remove is .10. d. F level, tolerance, or VIN insufficient for further computation. *** The discriminant analysis was based on variables being entered into the model using the 0.05 significance level (as described in the caption to Figure 3). Hence, all variables in the final model are significant, irrespective of the original number of samples used in the analysis. While the number of variables (51) exceeds the number of samples (30), the discriminant model has chosen only 11 variables for distinguishing among the 30 samples. While an increased number of samples would have been desirable, the significance results indicate that there is sufficient variance in the data to identify the important variables. Kuemeu wines were chosen since they form a distinct sub region of Auckland wines, allowing for control over regional variations such as those that would occur if Marlborough wines were chosen. Marlborough contains so many wineries that other factors, such as terrain and soil, would confound the analysis.***
Figure 3 (left). The 11 Kumeu wine descriptors found to be major contributing factors and their contribution in vintage-to-vintage variations within the period of 1997-2006. Figure 4 (right). Coefficients of the seven functions used in the prediction of 9 classes of wines vintage 19972006 (both included leaving out 2001) that describe the relative impact (positive, negative) of descriptors. CONCLUSION Both WEBSOM and disciminant results show that wine descriptors in sommelier comments could be used to model the vintage-to-vintage variability in the 30 Kumeu, New Zealand wine sample studied in this work. It is hereby concluded that to find the robustness of this model, samples consisting New Zealand and Chilean wines are ran using the same techniques and more climate variables, such as max, min monthly Temperature.
808
Shanmuganathan et al., Unsupervised ANNs for Modelling the Effects of CC on NZ Grape Wines
REFERNCES Ashenfelter, O., Ashmore, D. and Lalonde, R. (1995), Bordeaux Wine Vintage Quality and the Weather Chance vol 8 No. 41995, 7-14. Ashenfelter, O. and Jones, G.V. (2000), The demand for expert opinion: BordeauxWine. VDQSAnnual Meeting, d’Ajaccio, Corsica, France. October, 1998. Report ublished in Cahiers Scientifique from the Observatoire des Conjonctures Vinicoles Europeenes, Faculte des Sciences. Brochet, F. and Dubourdieu, D. (2001), Wine Descriptive Language Supports Cognitive Specificity of Chemical Senses [Journal]. Brain and Language Vol. 77, Issue 2, May 2001:187-196. Campbell Bob (2000), “Essential Wine Tasting Guide” Chart Frost, M. B. (2002). A., Preliminary study of the effect of knowledge and sensory expertise on liking for red wines. American Journal of Enology and Viticulture. vol. 53(4) :275-284. Gawel. R., I. P. (2001). Characterizing the astringency of red wine: a case study . Food Quality and Preference vol 12: 83-94. Grifoni, D., Mancini, M., Maracchi, G., Orlandini, S. and Zipoli, G. (2006), Analysis of Italian Wine Quality Using Freely Available Meteorological Information, Am. J. Enol. Vitic. 2006 57:3:339-346. Gutierrez, A. P., Luigi, P., Ellis, C. K. and d’Oultremont, T., (2005) Analysis of climate effects on agricultural systems. California Climate Change Center CEC-500-2005-188-SD pp 28+appendices A1-7. Honkela, T. K. (1996). Newsgroup exploration with WEBSOM method and browsing interface. Technical Report A32, Helsinki University of Technology, Laboratory of Computer and Information Science, Espoo. WEBSOM home page (1996)., (http://websom.hut.fi/websom/). Jackson D. I and Nguyen, H. H (1983) Lincoln canopy for grapes, American journal of enology and viticulture 34(3):176-179. Jones, G. V. (2004), Making Wine in a Changing Climate. Geotimes, August 2004, Vol. 50, No. 7: 22-27 Jones, G. V. (2005), “How Hot Is Too Hot?” Wine Business Monthly, February 2005:1-4. Jones, G. V., White, M. A., Cooper, O. R., and Storchmann K., (2005b), Climate and Global Wine Quality, Climatic Change by Springer vol. 73:319–343. Kaski, S. H. (1996). Creating an order in digital libraries with self-organizing maps. Proceedings of World Congress on Neural Networks (WCNN-96). pp?? Kontkanen, D. R. (2005). Canadian terroir: sensory characterization of Bordeaux-style red wine varieties in the Niagara Peninsula. Food Research International vol. 38: 417–425. Lagus, K. H. (1996a), Creating an order in digital libraries with self-organizing maps. Proceedings of STeP'96. Jarmo Alander, Timo Honkela and Matti Jakobsson (eds.) Publications of the Finnish Artificial Intelligence Society: 73-78. Lagus, K. H. (1996b). Self-organizing maps of document collections: A new approach to interactive exploration. Knowledge Discovery and Data Mining (KDD-96), (p. https://eprints.kfupm.edu.sa/64289/). Nemani R. R., White, M. A., Cayan, D. R., Jones, G. V., Running, S.W., and Coughlan, J. C. (2001) Asymmetric climatic warming improves California vintages. Clim. Res. Vol 19:25–34. Parr W. V., Green, J. A., White, K. G., Sherlock, R. R., (2007) The distinctive flavour of New Zealand Sauvignon blanc: Sensory characterisation by wine professionals. Food Quality and Pref vol. 18:849–861. Salton Gerard (1983) in Introduction to Modern Information Retrieval. McGraw-Hill. 448 pages. Shanmugathan S. and Sallis, P. (2008) Modelling climate change effects on wine quality based on expert opinions expressed in free-text format: the WEBSOM approach. Proceedings of the 15th International Conference on Neural Information Processing of the Asia-Pacific Neural Network Assembly (ICONIP 2008). - November 25-28, 2008, Auckland, New Zealand 2008. 265-266. van Leeuwen, Cornelis, Friant, Philippe, Chone, Xavier, Tregoat, Olivier, Koundouras, Stephanos, Dubourdieu, Denis. (2004). Influence of Climate, Soil, and Cultivar on Terroir. Am. J. Enol. Vitic. 2004 55:207-217. Vannier A., Bruna, O. X., Feinberg M. H., (1999) Application of sensory analysis to champagne wine characterisation and discrimination. Food Quality and Preference vol. 10:101-107. Webb L. B., (2006) The impact of projected greenhouse gas-induced climate change on the Australian wine industry. PhD thesis, School of Agriculture and Food Systems, University of Melbourne, Australia.277.
809