Using augmented reality to test spatial abilities in design and technology students D. Carvajal Garrido
[email protected] ESNE Professor – Design, Innovation and Technology Universitary School University of Rey Juan Carlos, Madrid (Spain) ABSTRACT: Current research pretends to study how augmented reality software applications can help teaching in University and College Education. It begins from question about it could exist some kind of special advantages from augmented reality application in learning, as opposed to most traditional teaching techniques. Specially, to approach an answer as main objective, it focuses over spatial skills development in design and technology degree first year students. It tests their mental rotation initial level using and not using augmented reality and analyzing also other variables influence such as gender, age, previous education and some hobbies. Collected data reveals previous education is decisive factor to spatial skills, but it is not concluded that augmented reality improve their development. KEYWORDS: Higher education, augmented reality, 3D modeling, constructivism, spatial skills
1. Introduction Actually emerging technologies supose a relevant role in educational innovation environments because these technologies offer new working tools to teaching and learning. Some researches in particular have been made about how augmented reality software could apply on Higher Education. These researches pretend mainly to step forward to find a link between pedagogy and technology, specially augmented reality applications and Higher Education. Current research joins this issue and it focuses on spatial abilites development in design and techonology universitary degrees. As study case, it takes Videogames Design and Development Degree and Multimedia and Graphic Design Degree students, both from ESNE Universitary School. It evaluates their spatial skills at first year, because these skills are considerated as esential to success in technical and engineering careers [1]. In fact, students need to know how to use that software and they also needs to develop mental abstraction and visualize shapes in three-dimensional space from several angles and points of view. Main objective of this research is find some advantages about augmented reality applications on spatial skills development into technology and design universitary degrees. To get this objective, this research starts from Piaget constructivism as pedagogical fundamentals [2], which proposes simulation and experimentation can improve learning and reasoning process. In particular case, spatial skills supose to be main cognitive ability inside 3D modeling subjects which basic knowledge is essential to progress. From Piaget point of view, action is basis for intelectual activity, from simpliest and linked to inmediate watchable activity, as baby do, to most complicated intelectual operations, linked to inner representation of the world (based on inner action on objects representations). So, knowledge is linked to action, to operations, in other words, to transformations which subject do on the world around him [3].
To include computer simulations into education must be approached as teaching and technological question. So, it is need some highly-developed hardware and software and accurate strategies to do helpful that technology for learning concepts and improving skills. These two elements must be present or a future consolidation inside classrooms will be difficult [4]. In this case teaching processes mainly must provide to students a collaborative situation and appropriate working environment with resources, tools and opportunities to build new training, with no effort and previous basis. Computer simulations can provide this kind of problems-based training [5] where environment interaction, cognitive conflict and students discussion can be real [6]. On the other hand, this fact is on perception of reality. Some examples about this could be threedimensional objects handling to improve spatial skills. Simulation is an excellent working tool to help understanding a real system because it can expand, compress or stop the time, and it also is able to give information about non-mensurable in the real system variables [7]. Following this line of research inside augmented reality applications on education, there are several researches as CREATE [8] (Constructivist Mixed Reality for Design, Education, and Cultural Heritage), from University College London (United Kingdom).
Image 1. Design, sketches and 3D modelling to architecture project [8]
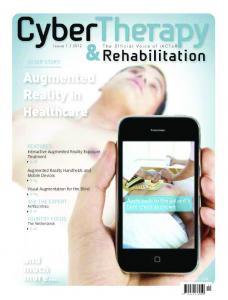
Another significant case is Studierstube [9] project from Institute for Computer Graphics and Vision (ICG) in Graz University of Technology (Austria), which researches some ways to introduce augmented reality into several higher level academic fields as teaching mechanical engineering, maths, geometry, etc., using three-dimensional immersive models.
Image 2. Augmented reality teaching system applied to geometry and mechanical engineering [9]
2. Experimental 2. 1. Methods An experimental approach was chosen, based on two groups comparison, experimental and control, so first one did the test with augmented reality software and second one did it without augmented reality. Selected spatial skill was mental rotation. To evaluate this skill, a survey was made on 26 questions divided into two difficulty levels (easy level, 20 questions; hard level, 6 questions), taking two specific measure instruments to test that skill. Selected measure instruments were two spatial relationship tests: i) Easy level: Saint Anselm College mental rotation test [10]; ii) Hard level: A subselection of MRT (mental rotation test) of Vandenberg and Kuse [11].
Image 3. Mental Rotation Test of Vandenberg and Kuse example [12]
These surveys showed to student for each question an initial three-dimensional shape drawed on twodimensional screen and four aditional shapes as posible answers. In case of Saint Anselm College test, just one of these four shapes was the same that initial shape but rotated in some way and other three do not match initial shape. If student selected correct shape, he or she got a correct answer result to that question and added one point. Else, student got a wrong answer result. In case of MRT Vandenberg y Kuse test, two of four aditional shapes were the same that initial shape and other two were not. To get correct answer result and add one point, student needed to answer both right shapes. If he or she answered just one, student got a partial success. Else, student got a wrong answer. Finally, survey asked for answer to the student about other independent variables which were outside mental rotation test, as gender, age, degree, year course, previous education and dedication level to five certain hobbies (videogames, walking, crafts, illustration/photography and travelling). 2. 2. Subjects Two groups, experimental and control, were formed from 89 first year volunteers: 54 Multimedia and Graphic Design Degree (from now on MGD) and 35 Videogames Design and Development Degree (from now on VDD) students, mixing them to get two miscellaneous groups. Students were males and females from eighteen to twenty-five years old. In this way, there were formed an experimental group with 44 students (15 from VDD and 29 from MGD), whose did mental rotation test using augmented reality, and a control group with 45 students (20 from VDD and 25 from MGD), whose did traditional test without augmented reality. 2. 3. Materials These 3D modeling and augmented reality software technologies were selected: i) Google SketchUp [13]; ii) AR-media two products [14]: a) AR-media Plugin for Google SketchUp; b) AR-media Player. Surveys were developed and provided to students on web-based online version. 3D models were made from Google SketchUp, creating 26 shapes in SketchUp Document format file. Later they were exported to .armedia format with AR-media plugin to next step. That step was to use AR-media Player to capture from camera and real-time render them on screen the .armedia 3D models overlaying on their associated markers. These markers were made printing them on paper. To do this, it was necessary to extract flat images of every test shape and wrap them with a wide black border over white background. Finally, every marker was linked to its appropriate shape with AR-media plugin.
Image 4. Marker shape example
Provided hardware included recent personal computers (one workstation for every student), integrated webcam, 21-inch / 1080p resolution screens. Every data collection session was occurred inside laboratory room at the morning with good ambient light.
2. 4. Data collection Four working sessions were scheduled to thirty minutes each one, along two different weeks. On first week, VDD control and experimental groups were evaluated and MGD groups did on second week. When test began, researcher gave instructions. Just a web location online survey to control group. Another location with a different online survey to experimental group and delivered physical markers in same order that test questions. Also, he told how to download, install and use augmented reality software. Online surveys were anonymous and researcher gave fifteen minutes to control group students and twenty-five minutes to experimental group, because small time delay to installing software, learning a new technology, handling markers, knowing how to do everything, etc. Table I. Groups distribution and experiment scheduling to data collection VDD (First week) Control 20 students Experimental 15 students
Session 1 Session 2
MGD (Second Week)
Control 25 students
Session 3
Experimental 29 students
Session 4
3. Results and Discussion From collected data, analysis has been done taking descriptive statistics (central tendency: mean, median, and mode; dispersion: Pearson correlation coefficient; shape: skewness and kurtosis) and statistical inference (Student's t-test and 1-way ANOVA). Next table shows relevant results after analysis to every dependent variables (26 questions and final result test) and independent (group type: experimental or control, gender, age, degree: MGD or VDD, hobbies: playing videogames, walking, crafts, illustration/photography, travelling). Table II. Significant analyzed variables clasified by questions and final result Experimental / Control Male / Female
Q1
Q2
Q3
X
X
X
Graphic Design / Videogames Playing videogames Crafting
Q4
Q5
X
Graphic Design / Videogames Playing videogames Crafting Illustration / Photography Previous education
Q7
Q8
Q9
Q10
Q11
Q12
X
X
X
X
X
X
X
X
Q13
Q14
X
X
Illustration / Photography Previous education
Experimental / Control Male / Female
Q6
X X Q15
Q16
X
X
X
Q17
Q18
Q19
Q20
X
X
Q21
X
X
Q22
Q23
X Q24
Q25
X
X
X
X
X
X
X
X
X Q26
Final Result
X
X
X X
X
X
X
As data table reveals, 10 to 16 questions can be explained by Experimental / Control variable but also by more variables. 62,5% could be explained by causes outside augmented reality to improve spatial skills. In addition, 23% results can be explained totally by augmented reality use, but final test results from experimental group are lower. 37,5% results can be explained by causes completely outside augmented reality. Analyzing every question results individually, VDD students were more accurate to pass positively the tests. Their results were revelatory of spatial abilities are influenced by previous education significantly, because students from Science-Engineering or Technological Higher Secondary School courses get better results than Social Sciences or Humanities courses. By other hand, MGD studens show more heterogeneity, mainly affected by a couple of external variables such as previous education or current specific hobbies as playing videogames. In both cases, degree justifies 30% results and 23% for previous education. About suggested hobbies, Playing videogames shows a greater influence rating, being positive for students whose often practise it. However, other hobbies as Walking or Travelling, or variables as age and gender did not look to be a decisive factor. 4. Conclusions This research finally concludes that there are important differences in spatial abilities between design students and technology students. However, in this specific research augmented reality have not improved spatial relationships development in the initial evaluation, getting better scores to control group. It also proposes a way to keep studying this issue applying augmented reality to higher education, because its results there are not completely decisive about the question above. To make progress, more similar researches are necessary, rectifying variables, testing others and considerating those located and dismissed in this case. Specially future researches must separate their focus to design degree or technology degree, because they showed strong differences. Another variable outside analysis to this research was answer time. However, it was saved when was collected. This variable shows an open way to continue deeply studying the issue, because it could supose that faster answer time means a better spatial skill. 5. References [1] Hsi, S.; Linn, M. C.; Bell, J. E. The role of spatial reasoning in engineering and the design of spatial instruction. Journal of engineering education, 1997, 86(2), pp 151-158. [2] Piaget, J.; Inhelder, B.; Sinclair-de Zwart, H. Memory and intelligence. New York: Basic Books, 1973. [3] Delval, J. The fecundity of Piaget's epistemology, Substratum, 1996, 3, pp 8-9. [4] Barneto, A. G.; Martín, M. R. G. Constructivist learning environments based on computerized simulations. Revista Electrónica de Enseñanza de las Ciencias, 2006, Vol. 5 Nº2. [5] Barrows, H. S. A taxonomy of problem‐based learning methods. Medical education, 1986, 20(6), pp 481-486. [6] Savery, J. R.; Duffy, T. M. Problem based learning: An instructional model and its constructivist framework. Educational technology, 1995, 35(5), pp 31-38. [7] Tarifa, E. Teoría de modelos y simulación, 2001. Facultad de Ingeniería, Universidad de Jujuy. [8] University College London, UK. CREATE Project (Constructivist Mixed Reality for Design, Education, and Cultural Heritage). URL (last visited on May, 2014): http://www0.cs.ucl.ac.uk/research/vr/Projects/Create/index.htm [9] Institute for Computer Graphics and Vision – Graz University of Technology, Austria. STUDIERSTUBE Project. URL (last visited on May, 2014): http://www.icg.tugraz.at/project/studierstube [10] Saint Anselm College, Manchester, New Hampshire, USA. Mental rotation test. URL (last visited on May, 2014): http://www.anselm.edu/internet/compsci/Faculty_Staff/mmalita/ § HOMEPAGE/ProjectPsychWEB/btbartlett/Project/MentalRotationTest/applet/index.html
[11] Vandenberg, S. G.; Kuse, A. R. Mental rotations, a group test of three-dimensional spatial visualization. Perceptual and motor skills, 1978, 47(2), pp 599-604. [12] Sorby, S. A.; Leopold, C.; Gorska, R. Cross-cultural comparisons of gender differences in the spatial skills of engineering students. Journal of Women and Minorities in Science and Engineering, 1999, 5(3), pp 279-291. [13] Trimble Navigation Limited, USA. SketchUp. URL (last visited on May, 2014): http://www.sketchup.com/ [14] Inglobe Technologies, Italy. AR-media. URL (last visited on May, 2014): http://www.inglobetechnologies.com/en/products.php