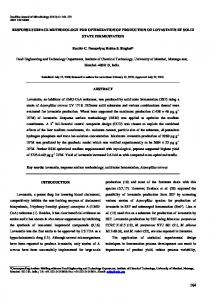
ARCH. ENVIRON. SCI. (2012), 6, 57-61
Optimization of hazardous crystal violet by chemically treated rice husk: Using central composite response surface methodology Papita Das Saha, Sagnik Chakraborty*, Subhabrata Das Biotechnology Department, National Institute of Technology- Durgapur, Pin: 713209, West Bengal, India *To whom correspondences should be addressed E-mail:
[email protected] Received March 06, 2012, Revised manuscript received May 23, 2012, Accepted June 07, 2012
Abstract The adsorption of crystal violet (CV) dye on chemically Modified Rice Husk (CMRH) was investigated in a batch technique. Response Surface Methodology (RSM) was employed to investigate the different operating parameters on the uptake of the dye molecule. The two level 3 factor (23) full factorial Central Composite Design (CCD) with the help of Design expert 7.16 (State Ease, USA) was used for the optimization of the adsorption process and to assess the effects and interactions of different process variables: dose (3-5 grams), agitation (80-150 rpm), pH (4-8). The predicted results obtained were found to be good agreement (R2 = 0.9945) with the results obtained by performing experiments. The optimum conditions for CV adsorption by CMRH were found to be 5 grams, 148.8 rpm, 8 pH respectively, under these conditions the removal efficiency was found to be 98.85%. Keywords: Adsorption, Rice Husk, Crystal Violet, Response Surface Methodology, Optimization rice husk, bamboo dust, citrus waste biomass, 1. Introduction burley husk etc [1-5]. These bio-wastes Globally a huge quantity of dye effluents is principally consist of cellulose, pectin, hemiproduced from various industries including cellulose, lignin, chlorophyll pigments and other tannery, paint, paper and textile. These dye low-molecular weight hydro-carbons, which molecules are quiet stable and so its removal is make these waste materials to be potential not an easy task. Researchers employed various adsorbent material for removing dyes from technology to develop a promising and aqueous solutions. Crystal Violet (CV), or Genetian violet is a significant one by which the removal can be triphenylmethane dye, employed in textile and done. In this context, adsorption has been recognized to be an effective, economical and fabrics for colouring the material. In printing useful process for the treatment of dye effluents and paints industry used this dye [1,6]. The and has attracted considerable interest. medical community apply this dye as a Adsorption is defined as a process wherein a biological stain and is an important ingredient in solute is removed from the liquid phase through Gram’s Stain. The dye is also applied as an contact with a solid adsorbent which has a external skin disinfectant in humans. CV is a special affinity for that particular solute. It protein dye in nature so it also finds application occupies a prominent place in dye removal and as an enhancer for bloody fingerprints. The dye has been found to be superior to the other is responsible for causing moderate eye techniques for dye wastewater treatment in irritation, causing painful sensitization to light. terms of cost, simplicity of design, ease of It can also cause permanent injury to the cornea operation and insensitivity to toxic substances. and conjunctiva since the product contains a A large variety of adsorbent materials have been cationic dye and it is highly toxic to mammalian tested to remove dyes. During past years, low- cells. In extreme cases it may also lead to cost, locally available adsorbent materials with respiratory and kidney failures [1,7,8]. The high adsorption capacities have gained removal of CV from effluents is essential not increasing attention. In this perspective, special only to protect human health but also for the attention has been given to agricultural wastes protection of water resources. Hence attempts such as orange peel, banana pith, banana peel, are made in this study to develop an inexpensive plum kernels, apple pomace, wheat straw, adsorbent for removal of Crystal Violet from sawdust, coir pith, sugarcane bagasse, tea leaves, 57
ARCH. ENVIRON. SCI. (2012), 6, 57-61
aqueous solutions using chemically treated rice husk. Rice husk, an agricultural waste, has been reported to be a good sorbent of many basic dyes [9]. In India, rice husk is an easily available agricultural waste material, produced in large quantities as a by-product of rice milling, and creates potential environmental problems. The annual generation of rice husk has been estimated to be 18-22 million tonnes [10]. Rice husk possesses a granular structure, is insoluble in water, has chemical stability, high mechanical strength and accounts for about 20% of the whole rice. It consists of about 32% cellulose, 21% hemicelluloses, 21% lignin, 20% silica and 3% crude protein [9,11]. It also contains abundant floristic fibre and some functional groups such as carboxyl, hydroxyl and amidogen, etc., representing a favourable characteristic of rice husk to be a potential adsorbent material. Alkali treatment of rice husk with sodium hydroxide (NaOH) has been demonstrated to improve the adsorption properties [11]. NaOH removes natural fats, waxes and low-molecular weight lignin compounds from the rice husk surface, thus revealing chemically reactive functional groups like-OH. The removal of the surface impurities also improves the surface roughness of the fibres or particles, thus opening more hydroxyl groups and other reactive functional groups on the surface. The aim of the present study was to investigate the combined effects of various parameters viz: dose, agitation, pH on the removal of CV from aqueous solution by Chemically Treated Rice Husk (CTRH), a low cost, easily available agricultural waste material, using Central Composite Design in Response Surface Methodology (RSM) by Design Expert Version 7.1.6 (Stat Ease, USA). Further, a numerical optimization methodology was employed to optimize the removal efficiency of the sorbent. This approach does not depict the combined effect of all the process parameters. In addition, this approach is time consuming, requires a number of experiments to determine the optimum levels (which may be unreliable) thereby elevating the overall cost of the process. These limitations of the classical method can be eliminated by optimizing all the process parameters collectively by statistical
experimental design such as Response Surface Methodology (RSM). RSM is a combination of mathematical and statistical techniques used for developing, improving and optimizing the processes and to evaluate the relative significance of several process parameters even in the presence of complex interactions [11,12]. The primary objective of RSM is to determine the optimum operational conditions of the process. This methodology is widely used in chemical engineering and applied sciences to optimize process variables. RSM offer certain advantages like higher percentage yield, reduced process variability, closer confirmation of output response to nominal and target achievement [13-15]. 2. Materials and Methods 2.1. Adsorbent The rice husk used was obtained from a nearby rice mill in Durgapur, West Bengal, India. It was washed repeatedly with doubledistilled water to remove dust and soluble impurities, and this was followed by drying at 353 ± 1 K for 3 hrs. The dried rice husk was then suspended in 5% NaOH solution and the suspension was autoclaved at 10 psi for 15 min. The alkali solution was filtered off and the rice husk was washed thoroughly with distilled water until the rice husk gave no colour and the pH of the wash was close to neutral. The washed and dried rice husk was sieved to different mesh size ranges from 150-300 micron and an average particle size of 200 micron was employed for the present work [31]. The chemically treated rice husk was then dried at 343 K for 24 hrs. After drying, the adsorbent was stored in sealed glass containers. The same adsorbent was used in all the experiments. 2.2. Preparation of Adsorbate Solutions Crystal violet (CV) used in this study was of commercial quality (CI 42555, MF: C25H30N3Cl, MW: 408, λ max: 580 nm) and was used without further purification. Stock solution (1000 mg L-1) was prepared by dissolving accurately weighed quantity of the dye in double-distilled water. Experimental dye solution of different concentrations was prepared by diluting the stock solution with suitable volume of double-distilled water. The 58
ARCH. ENVIRON. SCI. (2012), 6, 57-61
initial solution pH was adjusted using 0.1 (N) HCl and 0.1 (N) NaOH solutions. 2.3. Adsorption Experiment Batch adsorption experiments were carried out in 250 ml glass stoppered, Erlenmeyer Flasks by adding required amount of the adsorbent in 100 mL dye solution of the required initial concentration and pH. The flasks were stirred at a constant speed in an incubator shaker (Innova 42, New Brunswick Scientific, Canada) at 303 1 K for a fixed time (180 mins). All the experiments were performed as per the Software Design. The residual amount of the dye in each flask was studied by using UV/VIS spectrophotometer (U-2800, Hitachi, Japan). The percent removal (%) of CV was calculated by using the following equation: C Ce 100 (1) Sorption (%) i Ci where Ci is the initial dye concentration (mg L-1) and C0 is the final dye concentration in solution (mg L-1). Experiments were conducted in triplicate and the concurrent values were taken as result. 2.4. Design of Experiment Design of Experiment (DOE) is a preplanned approach for finding cause and effect relationships. The purpose of statistically designing an experiment is to collect common relationship between various factors affecting the process towards finding the most suitable conditions. It is essential that an experimental design methodology be economical for extracting the maximum amount of complex information, a significant reduction in experimental time, saving both material and personnel cost [14]. Central Composite Design (CCD) [15], Box- Behnken and Doehlert designs (BBD) [16] are among the principal response surface methodologies used in experimental design. The CCD has been widely used as the experimental design. This method is suitable for fitting a quadratic surface and it helps to optimize the effective parameters with a minimum number of experiments, and also to analyze the interaction between the parameters [17]. The CCD consists of a 2k factorial runs with 2k axial runs and n0 centre runs. In CCD each variable is investigated at two levels and as the number of factors, k, increases the number
of runs for a complete replicate of the design increases rapidly. This kind of design provides equally good predictions at points equally distant from the centre, a very desirable property for RSM. The centre points are used to determine the experimental error and the reproducibility of the data. The independent variables are coded to the (−α, α) interval where the low and high levels are coded as -1 and +1 respectively. Rotatable designs are most efficient and recommended for k = 3. The properties of Hartley’s and orthogonal designs are worse (though they require less experiments), but they may be used when it is necessary to keep a minimal number of design points. Rotatable designs of second order are not orthogonal and they do not minimize the variance of estimates of regression coefficients. They are efficient in solving research problems when trying to find an optimum [18]. Thus to determine the effect of various operating parameters CCRD has been used. The variables studied were pH of the solution (X1), adsorbent dose (X2) and agitation speed (X3). For the present study since the number of independent variables is three so for each categorical variable, a 23 full factorial CCRD, consisting of 8 factorial points, 6 axial points and 6 replicates at the centre points were employed, indicating that altogether 20 experiments were required, as calculated: (2) N 2 k 2k n0 23 2 3 6 20 where N is the total number of experiments required and k is the number of factors. Five different levels for each experiment in coded form are +α, -1, 0, +1, -α. The value of α depends on the number of points in the factorial portion of the design [19]. The value was fixed at 1.682 as shown below: 23/ 4 1.682 (3) The relationship between the coded and uncoded form of the variables is x xi codevalue xi i (4) x where xi is actual value of the ith factor in the uncoded units, xi the average of the low and high values for the ith factor, and Δx represent the step change. 2.4. Building Empirical Model
59
ARCH. ENVIRON. SCI. (2012), 6, 57-61
In the first step of RSM, a suitable approximation is introduced to find true relationship between the dependent variable and the set of independent variables, that is, the single-response modelled using the RSM correspond to independent variables. Then a k
k
i 1
i 1
Y 0 i xi ii xi2 ij xi x j
mathematical model in the form of a secondorder polynomial is formed to predict the response as a function of independent variables involving their interactions. Generally the behaviour of the system is explained by the following quadratic equation (Eq. 5). (5)
i 1 j 11
where Y is response (dependent variable), 0 is constant coefficient, i, ii, and ij are coefficients for the linear, quadratic and interaction effect, xi and xj are factors (independent variables), is error. In this work a second order polynomial equation was obtained using the uncoded independent variables as below: (6) Y 0 1 x1 2 x2 3 x3 11x11 22 x22 33x33 12 x1 x2 13x1 x3 23x2 x3 Multiple regression analysis technique was mol% nitrogen and 77.1 mol% helium was used used to evaluate the coefficient of the model. for this purpose. The Brunauer, Emmett, and The experimental range and levels of Teller (BET) specific surface area and pore independent process variables are given in diameter of the adsorbent were then determined. Table 1. Percentage removal of CV was studied Table 2. Central composite design for three with a standard RSM design called the Central independent variables used in this study along Composite Design (CCD). Twenty experiments with the observed response were conducted in triplicate according to the R (%) scheme mentioned in Table 2. Design Expert Run Real values Real values no. A B C A B C Version 7.1.6 (Stat Ease, USA) was used for -1 -1 -1 3.00 80.0 4.00 63.36 regression and graphical analysis of the data 1 +1 -1 -1 5.00 80.0 4.00 61.66 obtained. The optimum values of the selected 2 -1 +1 -1 3.00 150.0 4.00 96.43 variables were obtained by solving the 3 +1 +1 -1 5.00 150.0 4.00 97.63 regression equation and by analysing the 4 -1 -1 +1 3.00 80.0 8.00 62.31 response surface contour plots. The variability 5 +1 -1 +1 5.00 80.0 8.00 66.33 in dependent variables was explained by the 6 2 -1 +1 +1 3.00 150.0 8.00 89.98 multiple coefficient of determination, R and the 7 +1 +1 +1 5.00 150.0 8.00 98.85 model equation was used to predict the optimum 8 -1 -1 -1 2.32 115.0 6.00 81.36 value and subsequently to elucidate the 9 +1 -1 -1 5.68 115.0 6.00 85.31 interaction between the factors within the 10 11 -1 +1 -1 4.00 56.1 6.00 41.77 specified range. 12 +1 +1 -1 4.00 173.9 6.00 97.68 Table 1. Experimental range and levels of 13 -1 -1 +1 4.00 115.0 2.64 88.77 independent process variables 14 +1 -1 +1 4.00 115.0 9.36 88.83 Independent Range and levels (coded) 15 -1 +1 +1 4.00 115.0 6.00 86.61 variable -α -1 0 +1 +α 16 +1 +1 +1 4.00 115.0 6.00 87.64 17 -α 0 0 4.00 115.0 6.00 87.66 Adsorbent dose 2.32 3 4 5 5.68 -1 18 +α 0 0 4.00 115.0 6.00 86.33 g L (A) 19 0 -α 0 4.00 115.0 6.00 87.66 Agitation speed 56.1 80 115 150 174 20 0 +α 0 4.00 115.0 6.00 87.66 rpm (B) pH (C) 6 4 6 8 2.64 R: percent removal of CV 3. Results and Discussions 3.1. Characterization of the Treated Rice Husk The textural characterization of the sorbent was carried out by Quantachrome Nova 2200C (Quantachrome Corporation USA) surface area and pore size analyzer. A gas mixture of 22.9
In order to examine the macromolecular structure of the sorbent, the average pore area and average pore diameter of treated rice Husk as calculated by BET method were found to be 116 m2g-1 and 65.1 nm, respectively. These values of pore area (17 m2g-1) and average pore diameter (51.3 nm) of rice husk [20]. The 60
ARCH. ENVIRON. SCI. (2012), 6, 57-61
difference may be due to NaOH treatment methodology, which may be affect the pore area, pore volume and micropore structure of the rice husk [21].
from the experimental data using Design Expert Version 7.1.6 (Stat Ease, USA) to obtain the regression equation for CV removal as shown below.
3.2. Experimental Design and Fitting of Quadratic Model
Table 3. Regression analysis using 23 factorial central composite design
From the experimental adsorption studies it Model CE SD F-value P-value has been shown that pH, dose and agitation are A 1.39 0.19 52.21 < 0.0001 the most important factors affecting the CV B 16.35 0.19 7184 < 0.0001 removal from the solution. On the other hand C -0.11 0.19 0.33 0.5794 temperature has no prominent contribution to AB 0.97 0.25 14.78 0.0032 the process and the initial feed concentration of AC 1.67 0.25 44.11 < 0.0001 CV and temperature impose the least effect on BC -1.11 0.25 19.27 0.0014 the response [10]. Therefore, regression model A2 -1.52 0.19 65.93 < 0.0001 equation has been developed considering pH, B2 -6.34 0.19 138.9 < 0.0001 dosage and contact time. The CCRD as C2 0.41 0.19 4.71 0.0551 discussed earlier was used to develop CE: coefficient estimate; SD: standard error correlation between the selected operating The results of each experiment performed as variables to the removal efficiency. The centre per the software are given in Table 2. An runs (0, 0, and 0) were repeated five times as empirical relationship between the response and they contribute to the estimation of the quadratic the actual factors has been expressed by the terms in the model. Values of all the coefficients following quadratic model. of Eq. (6) as given in Table 3 were calculated R 38.95 (5.290 A) (1.648B) (2.844C ) (0.02679 AB ) (0.8387 AC ) (7) (0.01580BC ) (1.513 A2 ) (5.209 10 3 B 2 ) (0.1049C 2 ) Let us consider R as A as percentage of R (11) removal of CV, the adsorbent dose, B as the A A 3.025 agitation speed, and C as the pH of the solution. R It is clear from Eq. (8) that the removal of (12) 0.01042 CV is linear with respect to pH, dose and B B agitation speed and quadratic with respect to R (13) dosage and agitation speed. This indicates that C C 0.2098 there is a pH-to-pH, dose-to-dose, agitation The negative values of second order partial speed-to-agitation speed, pH-to-dose, pH-todifferential equations indicate the absence of agitation speed and agitation speed-to-dose maximum and applicability of interaction for CV removal. Maximum and local st maximization, 1 order partial differential minimum principle of differential calculus was used to find the maximum of the Eq. (7) with equations are equated to zero and solved for A, respect to individual tested variables. The partial B, and C, which give the maximum value of R. 5.290 0.02679B 0.8387C 3.025 A 0 (14) differential equations obtained are: 1.648 0.02679 A 0.01580C 0.01042B 0 R 5.290 0.02679 B 0.8387C 3.025 A (8) (15) A 2.844 0.8387 A 0.01580B 0.2098C 0 R (16) 1.648 0.02679 A 0.01580C 0.01042 B B Algebraic solution to the above equations (9) was A = 4.88903 g L-1, B = 161.41 rpm, and C = R 6.172. 2.844 0.8387 A 0.01580 B 0.2098C C 3.3. ANOVA Study (10) The results of second-order response surface The second order differential equations are: model in the form of analysis of variance 61
ARCH. ENVIRON. SCI. (2012), 6, 57-61
(ANOVA) are shown in Table 4. The statistical significance of the model equation was evaluated by the F-test ANOVA. The significance of each coefficient was determined by F-values and P-values, the coefficients for the main effects of agitation speed, initial solution pH the square effects of initial solution pH and biosorbent dosage were highly significant (P < 0.0001). Table 4 shows ANOVA for the response surface quadratic model. The F-value (480.53) with a low probability value (P < 0.0001) demonstrates a high significance for the regression model. The goodness of the fit of the model was also checked by the multiple correlation coefficients (R2). In this case, the value of the multiple
correlation coefficient was 0.9989, which revealed that this regression is statistically significant and only 0.38% of the total variations is not explained by the model. The value of predicted multiple correlation coefficient (pred. R2 = 0.9988) is in reasonable agreement with the value of the adjusted multiple correlation coefficient (adj. R2 = 0.9978). At the same time, a relatively lower value of the coefficient of variance (C.V. = 0.87%) indicates a better precision and reliability of the experiments carried out [19]. The non-significant value of lack of fit showed that the quadratic model was valid for the present study [22].
Table 4. Analysis of Variance (ANOVA) for the response surface quadratic model for CV removal Source Model Residual Lack of fit Pure error Total
Sum of squares 4324 5.08 3.17 1.91 4330
Degree of freedom (df) 9 10 10 5 19
Figure 1. Contour plot showing the effect of agitation speed and initial solution pH on the percent removal of CV
Mean square 481 0.51 0.63 0.38
F-value 946
Probability > F < 0.0001
1.66
0.2963
To investigate the interactive effect of three factors on the uptake of CV, the response surface methodology-central composite design was used, and contour plots were drawn. Contour plot is the projection of the response surface as a two dimensional plane. This analysis gives a better understanding of the influence of variables and their interaction on the response [12]. The inferences so obtained are discussed below. Effect of agitation speed and initial solution pH
3.4. Response Surface Estimation for Maximum Removal of CV
Figure 1 demonstrates the combined effect of agitation speed and initial solution pH on CV removal is shown in the contour plot. The operating parameter viz: agitation speed showed a little effect on CV removal efficiency. However, CV removal was seen to be very sensitive to changes in the solution pH. The percentage removal of CV by CTRH sharply increased with increase in solution pH from 4.0 to 8.0. About 98.85% CV removal was obtained at pH 8.0. This behaviour can be explained on the basis of change in the surface charge of CTRH. At lower pH values, the H+ ion concentration in the aqueous system increases and the CTRH surface acquires positive charge 62
ARCH. ENVIRON. SCI. (2012), 6, 57-61
by absorbing H+ ions. The positively charged surface sites on CTRH do not favour the adsorption of cationic dye due to the electrostatic repulsion, resulting in decrease in percentage dye removal. As the pH of the aqueous system increases, the number of negatively charged sites increases by absorbing OH− ions [23]. As such, at high solution pH, a significantly high electrostatic attraction exists between the negatively charged surface of CTRH and cationic dye molecules, leading to maximum dye adsorption. Similar results were reported for adsorption of CV onto grapefruit peel [8]. Figure 2. Contour plot showing the effect of dose and agitation speed on the percent removal of CV
agreement with those reported previously by other researchers for the sorption of CV by different low-cost adsorbents. However, further increase in biosorbent dosage beyond 3 g L-1 resulted in a significant decrease in the dye removal capacity. The primary factor explaining this characteristic is the agglomeration of the biosorbent at high biosorbent loading which may cause interference between dye cations and dye binding sites, resulting in decreased dye removal efficiency. Maximum dye removal was observed at high agitation speed. Effect of initial solution pH and biosorbent dosage Figure 3 represents the interaction effect of initial solution pH and biosorbent dosage on the percentage removal of CV by CTRH. The contour plot shows that the maximum adsorption (98%) occurs under basic conditions (pH 8.0) at biosorbent dose of 3.2 g L-1. Increasing the solution pH from 4.0 to 8.0 significantly increased the percent removal of CV by TRH. Unlike, the biosorbent dosage showed a minimum impact on the dye removal efficiency. Figure 3. Contour plot showing the effect of dose and pH on the percent removal of CV
Effect of agitation speed and bio-sorbent dosage Experiments were also performed to study the influence of agitation speed and biosorbent dosage on the removal efficiency of CV by CTRH. It is to be noted that the effect of interaction between agitation speed and biosorbent loading had a significant impact on the dye removal efficiency as indicated by the corresponding response surface diagram (Fig. 2). The percentage dye removal increased with increase in the dose of biosorbent up to 3 g L-1. Such a trend can be attributed to increased biosorbent surface area and the availability of more adsorption sites. This observation is in
3.5. Optimization using the desirability function In numerical optimization, we chose the desired goal for each factor and response. The possible goals were: maximize, minimize, target, within range, none (for responses only) and set to an exact value (factors only). A minimum and 58
ARCH. ENVIRON. SCI. (2012), 6, 57-61
a maximum level must be provided for each parameter included. A weight can be assigned to each goal to adjust the shape of its particular desirability function. The goals are combined into an overall desirability function. Desirability is an objective function that ranges from zero outside of the limits, to one at the goal. The program seeks to maximize this function. The goal seeking begins at a random starting point and proceeds up the steepest slope to a maximum. There may be two or more maximums because of curvature in the response surfaces and their combination in the desirability function. Starting from several points in the design space improve the chances for finding the ‘best’ local maximum [24,25]. A multiple response method was applied for optimization of any combination of four goals, namely agitation speed, initial solution pH, biosorbent dosage and percentage removal of CV. The numerical optimization found a point that maximizes the desirability function. A maximum level of biosorbent dosage (5 g L-1), maximum level of agitation speed and initial solution pH within the range 4.0 to 8.0, respectively were set for maximum desirability. The importance of each goal was changed in relation to the other goals. Figure 4 shows a ramp desirability that was generated from 10 optimum points via numerical optimization. By seeking from 10 starting points in the response surface changes, the best local maximum was found to be at agitation speed 148.8 rpm, initial solution pH 8, biosorbent dosage of 5.00 g L-1, and CV removal of 98.85 % and desirability of 0.999. The equilibrium time and temperature were 180 min and 303 K, respectively. The obtained value of desirability shows that the estimated function may represent the experimental model and desired conditions. 3.6. Confirmation Experiments To support the optimized data given by numerical modelling under optimized conditions, the confirmatory experiments were conducted with the parameters as suggested by the model (agitation speed 148.8 rpm, pH 8, biosorbent dosage 5 g L-1, equilibrium time 180 min) and the percent removal was found to be 98.85% and experimental results was found as 98.8%.
Figure 4. Desirability ramp for numerical optimization of four goals, namely the agitation speed, initial solution ph, biosorbent dosage and percent removal of CV
3.00
5.00
Dose = 5.00
4.0 0
80.0
150.0
Agitation = 148.7
8.00
pH = 8.00
41. 77
98.85
R1 = 98.85
Desirability = 0.994
4. Conclusion The present study was taken with the aim of investigating the optimum process conditions for adsorption of hazardous CV dye from aqueous solutions by CTRH using Response Surface Methodological approach. The application of RSM in the adsorption process for optimization and modelling facilitated the analysis of interaction effects of the process variables on the response [26-28]. It also appeared to be very effective and time saving approach for studying the combined influence of process parameters on the response factor [29,30,32]. The agitation speed, initial solution pH, and biosorbent dose significantly influenced the dye removal efficiency. Optimization conditions for the maximum removal efficiency of CV were obtained by applying a desirability function in RSM. The level of the four variable, agitation speed, 150 rpm; initial solution pH 8; and biosorbent dosage, 5.00 g L-1, were found to be optimum for maximum CV removal. The corresponding removal efficiency in optimum conditions was found to be 98.8%. The experimental results suggest that under optimized conditions; TRH can be used as an effective biosorbent for removal of CV from aqueous systems. References [1] Ahmad R. (2009) Studies on adsorption of crystal violet dye from aqueous solution onto coniferous pinus bark powder (CPBP), J. Hazard. Mater.;171:767-773.
59
ARCH. ENVIRON. SCI. (2012), 6, 57-61
[2] Mahwish A, Bhatti HN. (2012) Evaluation of thermodynamics and effect of chemical treatments on sorption potential of Citrus waste biomass for removal of anionic dyes from aqueous solutions, Ecol. Eng.;38:79-85. [3] Bhatti HN, Akhtar N, Saleem N. (2012) Adsorptive removal of Methylene Blue by low-cost citrussinensis bagasse: Equilibrium, kinetic and thermodynamic characterization, Arab. J. Sci. Eng.;37:9-18. [4] Haq I, Bhatti HN, Asgher M. (2011) Removal of solar red Ba textile dye from aqueous solution by low cost barley husk: Equilibrium, kinetic and thermodynamic study, Can. J. Chem. Eng.;89:593-600. [5] SafaY, Bhatti HN. (2011) Adsorptive removal of direct dyes by low cost rice husk: Effect of treatments and modifications, AJB; 10:3128-3142. [6] Amini M, Younesi H, Bahramifar N, Akbar A, Lorestani Z, Ghorbani F, Daneshi A, Sharifzadeh M. (2008) Application of response surface methodology for optimization of lead biosorption in an aqueous solution by Aspergillus niger, J. Hazard. Mater.;154:694-702. [7] Amini M, Younesi H. (2009) Biosorption of Cd(II), Ni(II) and Pb(II) from aqueous solution by dried biomass of Aspergillus niger: Application of response surface methodology to the optimization of process parameters, CLEAN;37:776-786. [8] Azargohar R, Dalai AK. (2005) Production of activated carbon from Luscar char: Experimental and modeling studies, Micropor. Mesopor. Mater.;85:219-225. [9] Ferreira SLC, Santos WNL, Quintella CM, Neto J, Bosque-Sendra M. (2004) Doehlert matrix: A chemometric tool for analytical chemistry - review, Talanta;63:1061-1067. [10] Garg UK, Kaur MP, Sud D, Garg VK. (2009) Removal of hexavalent chromium from aqueous solution by adsorption on treated sugarcane bagasse using response surface methodological approach, Desalination;249:475-479. [11] Ghorbani F, Younesi H, Ghasempouri SM, Zinatizadeh AA, Amini M, Daneshi A. (2008) Application of response surface methodology for optimization of cadmium biosorption in an aqueous solution by Saccharomyces cerevisiae, Chem. Eng. J.;145:267-275.
[12] Gong R, Zhu S, Zhang D, Chen J, Ni S, Guan R. (2008) Adsorption behaviour of cationic dyes on citric acid esterifying wheat straw: Kinetic and thermodynamic profile. Desalination;230:220-228. [13] Hamsaveni DR, Prapulla SG, Divakar S. (2001) Response surface methodological approach for the synthesis of isobutyl isobutyrate, Process Biochem.;36:1103-1109. [14] Safa Y, Bhatti HN. (2011) Biosorption of Direct Red-31 and Direct Orange-26 dyes by rice husk: Application of factorial design analysis, IChemE;89:2566-2574. [15] Hasan SH, Srivastava P, Talat M. (2009) Biosorption of Pb(II) from water using biomass of Aeromonas hydrophila: Central composite design for optimization of process variables, J. Hazard. Mater.;168:1155-1162. [16] Jain M, Garg VK, Kadirvelu K. (2011) Investigation of Cr(VI) adsorption onto chemically treated Helianthus annuus: Optimization using Response Surface Methodology, Bioresour. Technol.;102:600605. [17] Kumar R, Ahmad R. (2011), Biosorption of hazardous crystal violet dye from aqueous solution onto treated ginger waste (TGW), Desalination;265:112-118. [18] Kincl M, Turk S, Vrecer F. (2005) Application of experimental design methodology in development and optimization of drug release method, Int. J. Pharm.;291:39-49. [19] Lazic ZR. (2004) Design of Experiments in Chemical Engineering, WILEY-VCH Verlag GmbH & Co. KGaA, Weinheim. [20] Akhtar M, Bhanger MI, Iqbal S, Hasany SM. (2006) Sorption potential of rice husk for the removal of 2,4-dicholorophenol from aqueous solutions: Kinetic and thermodynamic investigations, J. Hazard. Mater.;B128:44-52. [21] Chakraborty S, Chowdhury S, Saha PD. (2011) Adsorption of Crystal Violet from aqueous solution onto NaOH-modified rice husk, Carbohydrate Polymers;84:1533-1541. [22] Massart DL. (2003) Handbook of Chemometrics and Qualimetrics, Part A, Elsevier, Amsterdam. [23] Mittal A, Mittal J, Malviya A, Kaur D, Gupta VK. (2010) Adsorption of hazardous dye crystal violet from wastewater by waste 60
ARCH. ENVIRON. SCI. (2012), 6, 57-61
materials, J. Colloid and Interface Sci.;343:463-473. [24] Saha P, Chowdhury S, Gupta S, Kumar I. (2010) Insight into adsorption equilibrium, kinetics and thermodynamics of Malachite Green onto clayey soil of Indian origin, Chem. Eng. J.;165:874-882. [25] Senthilkumaar S, Kalaamani P, Subburaam CV. (2006) Liquid phase adsorption of Crystal violet onto activated carbons derived from male flowers of coconut tree, J. Hazard. Mater.;136:800-808. [26] Amini M. Younesi H. (2009) Biosorption of Cd(II), Ni(II) and Pb(II) from aqueous solution by dried biomass of Aspergillus niger, application of response surface methodology to the optimization of process parameters, CLEAN;37:776-786. [27] Chakraborty S, Chowdhury S, Saha PD. (2012) Adsorption of Crystal Violet from aqueous solution onto sugarcane bagasse: Central composite design for optimization of process variables, Journal of Water Reuse and Desalination;2:55-65. [28] Chowdhury S, Saha PD. (2012) Scale-up of a dye adsorption process using chemically treated rice husk: Optimization using Response Surface Methodology, Desalination and Water Treatment;37:331336. [29] Chowdhury S, Chakraborty S, Saha PD. (2012) Response surface optimization of a dynamic dye adsorption process: A case study of crystal violet adsorption onto NaOH-modified rice husk, Environ Sci Pollut Res Int.;(Accepted Manuscript/Article in Press). [30] Saha PD, Dey A, Marik P. (2012) Batch removal of chromium(VI) from aqueous solutions using wheat shell as adsorbent: process optimization using Response Surface Methodology, Desalination and Water Treatment;39:95-102. [31] Chowdhury S, Mishra R, Saha PD, Kushwaha P. (2011) Adsorption thermodynamics, kinetics and isosteric heat of adsorption of malachite green onto chemically modified rice husk, Desalination;265:159-168. [32] Asgher M, Bhatti HN. (2011) Optimization of adsorption variables for removal of anionic dyes by citrus sinensis biomass using
response methodology, Fresenius Environmental Bulletin.; 20:2078-2084.
61