Luis A. Trejo, Roberto Alonso, Adrián Ãvila, Raúl Monroy,. Erika Sánchez, Jorge Vázquez, and Mario Maqueo. Instituto Tecnológico y de Estudios Superiores de ...
Using Cloud Computing MapReduce operations to Detect DDoS Attacks on DNS servers ´ Luis A. Trejo, Roberto Alonso, Adri´an Avila, Ra´ ul Monroy, Erika S´anchez, Jorge V´azquez, and Mario Maqueo Instituto Tecnol´ ogico y de Estudios Superiores de Monterrey, Campus Estado de M´exico, M´exico {ltrejo,A01013374,A01160574,raulm,snora,A01165550,A01161619}@itesm.mx http://homepage.cem.itesm.mx/raulm/netsec
Abstract. In this paper we present a methodology to develop an intrusion prevention system for the global Domain Name System (DNS), a core component for Internet operation; after severe attacks during the last three years, a more effective way to protect DNS is still needed. On this work, the hypothesis being tested is that a statistical analysis of the social networks that are formed from DNS requests is the key to the design of an IPS that efficiently spots anomaly behavior. Our application requires a large amount of storage and processing power. To speed up the analysis, the main variables of the model are computed by means of MapReduce operations using the IBM-Google Cloud Computing platform. Key words: Domain Name System, network security, Intrusion Prevention and Detection Systems, Cloud Computing, MapReduce operation
1
Introduction
Domain Name System (DNS) is considered a critical component for the proper operation of Internet. As a main role, DNS translates domain names into IP addresses [1] by implementing a simple protocol integrated by query and response messages. Every page, web system, or service on the web has a logical identifier called IP address; instead of using IP addresses to reference those services users type URLs (Uniform Resource Location) mainly because they are easier to remember. An URL can be decomposed in a hierarchy of domains, for instance when accessing http://mail.google.com, google represents the domain, mail a sub-domain of google, and com a top-level domain. This URL has an IP address associated to it and when is referenced by the user DNS resolves the URL to its corresponding IP address. DNS has been targeted by numerous DDoS (Distributed Denial of Service) attacks; in 2002 an attack against DNS lasted for about 9 hours and disabled nine of the thirteen DNS root servers [2]. Another attack occurred on February 2007 [3], this time affecting six of the thirteen root servers. The main purpose of the attacks was to increment the volume of queries in order to disable the ability of the system
´ L. Trejo, R. Alonso, A. Avila, et al.
to response to valid user queries. Due its nature DNS is relatively simple to attack. By simply typing a wrong URL on a web browser the DNS services will be invoked and forced to ask for that domain to other higher level DNS servers [4]. This can be easily automated and therefore can enable a computer, or a set of computers, to trigger hundreds or thousands of queries. Even an incorrect configuration of DNS servers can increment, in a significant proportion, the number of invalid traces [5]. For instance, in [6] the author presents a method for detecting misconfigurations at source DNS servers; this is accomplished by applying a statistical analysis to logs generated by a root DNS server. They applied techniques like PCA, LDA and K-means to cluster data sets. They validated the outcomes with DNS system administrators. There are several and different approaches to develop an efficient Intrusion Detection System (IDS) for DNS. For instance, in [7] the authors present an algorithm to detect DDoS attacks under the assumption that normal traffic presents random fluctuations, while abnormal traffic, i.e. traffic which contains an attack, presents a persistent and incremental trend. Even if the attacker generates fluctuations to imitate the abnormal behavior, the attack must maintain a persistent increment of packets, until the system becomes overwhelmed. In [8] they present a method for detecting DDoS attacks in a network by using entropy-based collaborative detection. They use entropy and entropy rate to distinguish malicious traffic from the normal one. They not only calculated entropy to measure uncertainty in a time slot, but also entropy rate to demonstrate that malicious traffic follows almost the same entropy from traffic generated by border routers throughout a network. These solutions have an approach based on the statistical analysis of high volume of requests, or by checking DNS server configurations. There are few approaches for intrusion detection or DDoS attacks that take into account the content of DNS packets and even fewer that monitor the domains accessed by the user. Our approach relies on the observation of social behavior of users. By analyzing regularly visited domains by each user, we are able to build what we call the social behavior of that user and ultimately derive a directed graph that we call the interaction network. In order to obtain the interaction network and determine whether it represents normal or abnormal behavior, several local and global group variables need to be computed. In order to efficiently compute these variables, we use the MapReduce programming paradigm offered by the IBM-Google Cloud Computing platform [11, 12, 15]. These variables are detailed in the following sections. This paper is organized as follows: In Section 2 a quick review of the MapReduce paradigm is given as well as a general description of the IBM-Google Cloud Computing initiative. In section 3, we present our approach of social behavior profile construction based on graphs called Interaction Networks. Section 4 explains how Interaction Network can help us to detect DNS attacks. In Section 5 we present our results and discuss the benefits of using the MapReduce operation on the cloud. Finally in section 6 we give our conclusions and describe undergoing and future work.
Using Cloud Computing to Detect DDoS Attacks on DNS servers
2
Cloud Computing and the MapReduce paradigm
2.1
About the Google-IBM Cloud Computing Initiative
The Google-IBM Cloud Computing Initiative[11–15] is a project motivated by the growing interest in the use of cloud computing not only as a business model but also as a means for scientific research. In this initiative Google and IBM got together to help universities conduct research in this area. Both companies combined their strengths in order to develop this project; Google has expertise in web computing and massively scaled clusters, while IBM has deep knowledge and experience in scientific, business and secure-transaction computing. There are several universities involved in the project, mainly in the USA1 . There are other universities around the world that have been included in this project. In Mexico, Tecnol´ogico de Monterrey University became part of this initiative at the end of 2009. By belonging to this initiative these universities have access to the following resources provided by Google and by IBM to help them develop cloud-computing research projects: – The actual cloud, which is a cluster of processors running an open source implementation of Googles cloud computing infrastructure. Googles implementation includes MapReduce and the Google File System while the open source implementation is the Hadoop project, which includes a MapReduce implementation and the Hadoop Distributed File System. – A Creative Commons licensed university curriculum, developed by Google in collaboration with some of the universities involved in the project, focusing on distributed computing. – Open source software designed by IBM to help in the development of programs for Hadoop, which works with Eclipse, an open source integrated development environment. – Management, monitoring and dynamic resource provisioning with IBM Tivoli systems management software. The cluster we are using consists of 457 nodes, each one running on a machine with a dual-processor 2.8GHz Xeon, 8 GB of RAM, and two 400 GB hard disks. Hadoop runs on a 64-bit Xen virtual machine, with access to all the resources (excluding some overhead), and the virtual machine runs CentOS 5.3. Fedora Core 8 is used as the host operating system and each node has a 1 Gb Ethernet link. The project was launched in 2007, and has grown from a single participating university to a considerable number of universities spread around the world. The 1
By the time of this writing, the universities members of the IBM-Google initiative in the USA are: Carnegie-Mellon University, Florida International University, the Massachusetts Institute of Technology, Purdue University, University of California-Irvine, University of California-San Diego, University of California-Santa Barbara, University of Maryland, University of Massachusetts, Stanford University, Berkeley, University of Virginia, University of Washington, University of Wisconsin, University of Utah, and Yale University
´ L. Trejo, R. Alonso, A. Avila, et al.
projects being developed under the cloud computing platform range from social networking or intrusion detection to image processing and astrophysics. 2.2
The MapReduce paradigm
MapReduce is a programming model for data processing [16–18]. The model is simple, but at the same time powerful enough to implement a great variety of applications. MapReduce works by breaking the processing into two phases: the map phase and the reduce phase. Each phase has key-value pairs as input and output: – Map: An initial transformation step, in which individual input records can be processed in parallel. – Reduce: An aggregation or summarization step, in which all associated records must be processed together by a single entity. The core concept of MapReduce is that input may be split into logical blocks, and each block may be initially processed independently, by a map task. A map task may run on any compute node in the cluster, and multiple map tasks may be running in parallel across the cluster. The map task is responsible for transforming the input records into key-value pairs. The output of all of the maps will be partitioned, and each partition will be sorted. There will be one partition for each reduce task. Each partitions sorted keys and the values associated with the keys are then processed by the reduce task. There may be multiple reduce tasks running in parallel on the cluster.
3
Interaction Networks
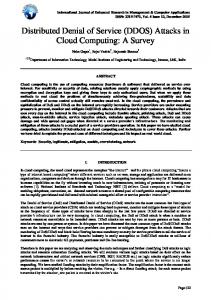
We propose a model based on social behavior that will be known as Interaction Network. The main purpose of modeling social behavior is to determine the social profiles; for instance, on a private network such as an enterprise or university, some of the characteristics will be: what users are accessing a particular domain; what the relationship is between user x and user y in terms of visited domains; how similar is the group of visited domains related to a user with the visited domains of another user; which domains are less likely to be visited, and so on. In order to gather these characteristics we first need to relate an IP with a domain that IP has requested, resulting on an acyclic directed graph as shown in figure 1. An Interaction Network is defined as a set of relations present on a window analysis. These relations are built from queries made by an IP requesting a particular Domain, and modeled by the following definitions: Let W be the set of all analysis windows where w1 , w2 , w3 , ..., wn ∈ W Let I be the set of all IPs, and D be the set of all the domains where
Using Cloud Computing to Detect DDoS Attacks on DNS servers
Fig. 1. Representation of a relation between an IP and requested domains
i1 , i2 , i3 , ..., in ∈ I and d1 , d2 , d3 , ..., dn ∈ D Finally, let qryw (x, y) be a function that tells us if an IP x query for a Domain y on a window w. Then, given w ∈ W, the set of all active IPs on an analysis window will be: I(w) = {x ∈ I|∃y ∈ D, qryw (x, y)} The set of all visited Domains on a window should be defined similarly: D(w) = {y ∈ D|∃x ∈ I, qryw (x, y)} We can now deduce that a more complex structure can be constructed. The result will be a graphical view of all queries made to a DNS server, where the social behavior can be observed since there are users visiting the same pages, or using the same web services. For instance, in a university campus, students are more likely to visit entertainment and social web pages than researchers, who in turn are expected to visit more scientific web sites than full-time professors. We call this separation of users behavior a group. Figure 2 shows a directed graph representing social behavior in terms of groups emerged in a community in a given moment. Social groups are defined as follows:
´ L. Trejo, R. Alonso, A. Avila, et al. bed
cj
dbh
bjd cbf
11
caf
18
b
15
5
dg caj ddb cie cce cf jbai bdf bfc cch bah cjc cfe dbg bff bfa daa c ifceh bee bia dac dbf cib bdc bdda ij ccj bdi cag ccbdci cdh jcgd dcid bca da ceb bfgbjccaabhbdcchj cihceabbj cca dcc cge cfdcdj cab cecbih daicei cfh bdj bbi cde bfb gh bgh biccdg bajcgi gc big chbbdadbc bdd be cfa hfbfe cbb ced bga dbe dbddbj ddc bac cfgcja cbjbgebeg j g fcgg jcfc cjd cdd bbbcdc cgj chibhahh chc hb 0 bje bhe bbd cccehhc dcj bgc bcbbgg dah beibag ih cbd cga d j che c j j cbg bib ccfbjb cee bab cabhcbjfbfh bdh bdb jchh c cej b j j bbfgidcg cdf de ji j cefbjhfe bjg gg dcd cg jfcdb bid chd ccd cic bgb df cci bc ee ifb abeb bce i j gaifg j a c cff bec bh fh cgb jch edaf h bgji bcf baf gd cb i abf
12 8 cjg daj cbe bif
14 cij hjfc 3 hgeiig bhf cia dd cbi ifbgi cgc bbh ba bg dbabfi dcb cig gcjih bbgcdihibae ddf cai hdebdae cf bhhbfj eg cbc dde behbadfdfabgf cgf cda dca dag ea bfd jbbch idbaagb bcifcjb f jjej ddd eic bde cje bej dbbie
ec
7
dbi 1
cii
ef bgd bb he cji bcg cjh di dcf 6 cad dhbcd bii cc cd d gj bi cgh cac bhd 4 bhjge bhg cha ha cebbc ib chgccg bd bbedb fbj bdg fi cbh bcc bjacfi cba chf
bcj
gf
bea
bef
bba
cae
17
bji
16
cah
cfb dad dab dch
13
ed
bie 2
cjf 9
10
dce ceg
bhi
Fig. 2. Behavior of a campus at 7am.
Given (w, I ⊆ I(w), D ⊆ D(w)) The tuple forms a group, iff the following condition is fulfilled: ∀x ∈ I, y ∈ D qryw (x, y) where qryw is exactly the Cartesian Product of I × D; the size of the group is the cardinality of the set D, and the weight of the group is the cardinality of the set I. Finally we will denote Gw (I, D) the group < W, I, D > where n is the size of the group and t its weight. A constant k is defined as the minimum size that a group must meet in order to be considered. Therefore, A group is trivial, with respect to k, if its size is less than k, and none trivial on the other case. Since we can expect more than one group of size n given a w, Gw is the multiset of all groups in w. Interaction Networks will also have other characteristics besides groups; these variables will be divided into two main categories: local group variables, and global group variables. 3.1
Local group variables
Local group variables represent part of the behavior of a group within an Interaction Network. There are variables, such as the number of domains present on a particular group, that are important to consider. Since the set of visited domains tends to follow a Zipf distribution [9] (most users on a network will visit
Using Cloud Computing to Detect DDoS Attacks on DNS servers
more Google rather than IEEE Xplore) we expect to see more traffic querying for specific domains than others. The local group variables we will focus on are now presented. Given a group G ∈ Gw , the size of a group will be determined by: size(Gw) = size(Gw (I, D)) = |D| The weight of the group will be defined similarly, weight(Gw) = weight(Gw (I, D)) = |I| Since we are interested in knowing the behavior of groups we define the most and less active IP by the next function2 , ∀Gw ∈ Gw , minsize ≤ size(Gw) Finally the less and the most visited Domain will be defined by a similar function, ∀Gw ∈ Gw , maxweight ≥ weight(Gw) 3.2
Global group variables
Global group variables on the other hand, represent the behavior of an Interaction Network. For instance, the total number of unique IP addresses on a window w tells us about the number of active users present on that window. To build a profile of users behavior requires for example, to know all domains the user is accessing, what IP address are being the most popular sources of domain queries, etc. We define global group variables as follows: Given w ∈ W, y ∈ D(w), the set of all IPs that are visitors of a given Domain is: visitorsw (y) = {x ∈ I(W )| qryw (x, )} The cardinality of this set represents the most visited Domain on a window w, and can be expressed as: popw (y) = |visitorw (y)| Therefore, the set of all popular Domains in w is, toppopular(w) = argy max popw (y) We can obtain the total number of queries performed on the most visited Domain as follows: ∀y ∈ D(W )maxpop(w) = max(popw (y)) 2
Most active IP is defined similarly so it will be omitted
´ L. Trejo, R. Alonso, A. Avila, et al.
The set of domains visited by a particular user (IP) can be expressed as: spanw (x) = {y ∈ D(w)| qryw (x, y)} Total activity, defined as the load of queries made by a single IP, x ∈ I(W ) in w ∈ W is given by the function activityw (x) = |spanw (x)| Finally, the set of most active IPs is given by topactive(w) = argx max activityw (x) And the maximum load of activity in w is ∀x ∈ I(w)maxactivity(w) = max(activityw(x))
4
How Interaction Networks react to DDoS attacks
We assume that an attacker has the ability to compromise several computers on a network, from there inject DNS packets into the network, hence successfully launch a Distributed Denial of Service attack (DDoS). We are interested in the QNAME field of the Question section in a DNS packet since it is there where the domain being accessed is found. Attackers can fill this filed with valid or invalid entries, triggering DNS queries that can even reach high-level instances of DNS infrastructure. The attacker can use a random domain generator as the one used in the Conficker worm [10]. Moreover we assume that an attacker is able to delete DNS tables of a computer. In other words the attacker is able to perform any known or unknown DNS attack. Additionally, a DDoS can be persistent as reported in [2, 3, 7]. Social networks can detect if there is a deviation from normal behavior on DNS queries made by regular users. Normally, users tend to navigate the same sites during working days even at the same range of hours, with normal, small deviations. As an example, consider a computer that starts generating queries for domains that are unusual, in terms of the number of different new domains and the timeframe of the event. In this situation the profile of that IP will be suddenly affected (it could be a symptom of the machine being compromised). This will be immediately reflected and reported by the interaction network. The user may leave a social group and enter a newly created one, or even stay isolated from the rest of the interaction network. One of the global group variables that will reflect this change is the number of groups in the analysis window. Other variables such as unique IP addresses and unique visited Domains will also be affected. Therefore, attacks on DNS can be detected timely by our model.
Using Cloud Computing to Detect DDoS Attacks on DNS servers
4.1
Window analysis
To build the interaction network, the following variables are computed using a window of n DNS registers. To extract data from global variables we will assume that we are on an analysis window w, and to construct an analysis matrix (see below) the next values are involved: – numIP is a value that tells us the number of IPs present on w and extracted from the set I(w) numIP = |I(w)| – numD is the number of Domains in w, obtained from D(w) numD = |D(w)| – maxSizeG is the maximum size of a group in w maxSizeG = maxsize ≥ size(Gw) – minSizeG is the minimum size of a group in w minSizeG = minsize ≤ size(Gw) – µSizeG is the mean size of the group in w – maxW eightG is the maximum weight of all groups maxW eightG = maxweight ≥ weight(Gw) – minW eightG is defined as the minimum weight of all groups minW eightG = minweight ≤ weight(Gw) – µW eightG is the mean weight of all groups – numGps is the total number of groups numGps = |Gw | – maxP D is the number of visits to the most popular domain maxP D = maxpop(w) – maxAIP is the load of the most active IP in w maxAIP = maxactivity(w) – entropyIP is the entropy of the IPs in w given by H{I(w)} = −
numIP X
p(ik )log2 (p(ik ))
k=1
where p(ik ) is the probability of appearance of IP ik in w – entropyD is the entropy of Domains present in w, and it is computed similarly. Next, we build an analysis matrix V whose rows are tuples of the form: < numIPi , numDi , maxSizeGi , ..., entropyDi > where, i corresponds to the analyzed window wi ∈ W.
´ L. Trejo, R. Alonso, A. Avila, et al.
5
Computation of main variables by means of MapReduce operations
The DNS registers we used come from log files generated by a BIND server in a university campus. We have daily DNS logs from 2007; however, for the purpose of demonstrating the use of MapReduce and the IBM-Google cloud, our results are based on a 24-hours log, containing 2,014,087 DNS queries. The size of the window has been fixed to 50,000 and a step window of the same size of the window. For the sake of simplicity, in Table 1, we only show the computation of six variables. The first, middle and last windows are presented. Window 41 has been left out from the table and graphs since it contains only 14,087 registers. The values obtained by processing the more than two million queries by means of a parallel processing of the 41 individual windows are depicted in figures 3, 4 and 5. Window Number of Frequency IP Source Number Frequency Nr of unique of most Entropy port of unique of most IPs active IP entropy domains popular Domain 1 113 8668 4.17 10.09 8689 6085 20 378 17882 3.13 10.09 8689 6085 40 236 16820 3.66 12.37 5845 2950 Table 1. Computed variables for a window size of 50,000. The processing time on the cloud was 52 seconds.
Fig. 3. Number of unique IPs variable.
These curves all portray normal behavior during a 24-hour period. Windows at the left (from 1 to 5) and windows at the right (35 to 40) of the three graphs
Using Cloud Computing to Detect DDoS Attacks on DNS servers
Fig. 4. Frecuency and number of unique domains variables.
Fig. 5. Entropy values.
´ L. Trejo, R. Alonso, A. Avila, et al.
represent the first hours and the last hours of the day, respectively. Spikes at the beginning of the day in some variables represent batch processes run by the system administrator, reaching a level of stability during work hours. The trend is that all values at the right in figures 3 and 4 show a decrease in activity. Entropy values in figure 5 show stability after initial spikes. The IP entropy figures (e.g. 3.13) show that the number of DNS queries is not uniformly distributed among the number of host IPs (e.g. 378), but that there are a few, highly active host IPs. By way of comparison, a high source port entropy indicates that source ports are used rather uniformly. During an attack, particularly a DDoS attack, we would expect a sharp and dramatic change in these figures. For a deeper analysis of global group variables and local group variables, please refer to [19].
6
Conclusions and undergoing work
Social networks show interactions between users and visited domains within a network; with these relations we can build a profile that allows us to identify sudden changes in user and community behavior. Therefore abnormal traffic can be identified as well as DDoS attacks. This is possible by performing a deeper analysis of local group and global group variables. To improve the performance of the method we carried out a correlation analysis to discard variables that provide redundant information. To build a profile for normality and to be able to determine thresholds, we need to compute a transversal statistical analysis of DNS traffic; that is, the process will be based on a window containing n number of registers from the same hour and week day from a complete academic year. Clearly, this requires the use of the cloud, to take advantage of its storage and computational capability. Each year contains approximately 700 millions of registers in 80 Gb of storage. In 2009, during the design of the statistical model for an Intrusion Detection System for DNS, all variables were computed sequentially on a workstation. Time processing reported by some members of our team were reaching hours and some times a few days. This was slowing down the results and therefore the main goals of the project. Migrating our code to a MapReduce programming paradigm and running new tests on the IBM-Google cloud has been very encouraging. What we reported in this work is only the first set of tests in the cloud, and it is clear now that we will continue with this migration process. Once our model is complete and validated, we will process using the same methodology information gathered by DNS-OARC and CAIDA (high-level DNS instances); it is known that these logs contain data from the last attack dated April 7th 2009.
Acknowledgments This research is supported by two research grants, one from CONACyT, reference 105698, and the other from ITESM, reference C-CEM-04/07. Access to IBM and Google virtual infrastructure is specified by university computing resource agreement.
Using Cloud Computing to Detect DDoS Attacks on DNS servers
References 1. J. Klensin, Role of the Domain Name System (DNS), RFC 3467 (2003) 2. P. Vixie., G. Sneeringer, M. Schleifer.,: Events of 21-Oct-2002: ISC/UMD/Cogent: http://c.root-servers.org/october21.txt (2004), 3. ICANN: Factsheet, Root Server attack on 6 February 2007 (2007) 4. V. Ramasubramanian., E.G. Sirer.: Perils of Transitive Trust in the Domain Name System: Cornell University, New York (2004) 5. S. Castro., D. Wessels., M. Fomenkov., K. Claffy.: A Day at the Root of the Internet: Computer Communication Review: 38(5),41-46(2008) 6. B. Kirkpatrick., S. Lacoste., W. Xu: Analyzing Root DNS Traffic 7. Y. Huang., X. Fu., Q. Hou., Z. Yu.: The Early Detection of DDoS Based on the persistent Increment Feature of the Traffic Volume: 22nd International Conference on Advanced Information networking and Applications-Workshops. 8. S. Yu., W. Zhou.: Entropy-Based Collaborative Detection of DDoS Attacks on Community Networks: Sixth Annual IEE International Conference on Pervasive Computing and Communications (2008). 9. E. Graells., R.B.-Yaez.: Comparaci´ on entre la Web Chilena y la Web Espanola: Revista Faz (2007) 10. P. Phillip., et al: An analysis of Conficker, SRI International (2009) 11. IBM. (2010). Google/IBM Virtual Infrastructure Support. ¿From https://univsupport.hipods.ihost.com/ 12. Cloudbook: The Cloud Computing and SaaS Information Resource. (2010). IBM Google Academic Cloud Computing Initiative. From http://www.cloudbook.net/ibmgoogle 13. Google. (2010). Distributed Systems Google Code University. From http://code.google.com/intl/es-MX/edu/parallel/index.html 14. IBM. (2009). National Science Foundation Awards Millions to Fourteen Universities for Cloud Computing Research. From http://www03.ibm.com/press/us/en/pressrelease/27298.wss 15. IBM. (2007). Google and IBM Announce University Initiative to Address Internet-Scale Computing Challenges. From http://www03.ibm.com/press/us/en/pressrelease/22414.wss 16. The Apache Software Foundation. (2010). Hadoop. From http://hadoop.apache.org/ 17. WHITE, T., Hadoop: The Definitive Guide, OReally, 2009, 501p. 18. VENNER, J., Pro Hadoop, Apress, 2009, 407p. 19. R. Alonso, J. V´ azquez, L. Trejo, R. Monroy, E. S´ anchez.: How Social Networks can Help to Detect DDoS Attacks on DNS Servers: 3rd Workshop in Computer Security, MICAI 2009


![Hyrax: Cloud Computing on Mobile Devices using MapReduce [PDF]](https://m.moam.info/img/260x300/hyrax-cloud-computing-on-mobile-devices-using-mapr_648f03c1098a9e69678b456f.jpg)