ratio of SYN packet increases drastically during the SYN flooding attack. ... DDoS attacks occur, we consider these CTNT as TCP flag rate and IP protocol rate.
SVM Approach with CTNT to Detect DDoS Attacks in Grid Computing* Jungtaek Seo1, Cheolho Lee1, Taeshik Shon2, and Jongsub Moon2 1 National Security Research Institute, KT 463-1, Jeonmin-dong, Yuseong-gu, Daejeon, 305-811, Republic of Korea {seojt, chlee}@etri.re.kr 2 CIST, Korea University, 1-Ga, Anam-dong, Sungbuk-Gu, Seoul, Republic of Korea {743zh2k, jsmoon}@korea.ac.kr
Abstract. In the last several years, DDoS attack methods become more sophisticated and effective. Hence, it is more difficult to detect the DDoS attack. In order to cope with these problems, there have been many researches on DDoS detection mechanism. However, the common shortcoming of the previous detection mechanisms is that they cannot detect new attacks. In this paper, we propose a new DDoS detection model based on Support Vector Machine (SVM). The proposed model uses SVM to automatically detect new DDoS attacks and uses Concentration Tendency of Network Traffic (CTNT) to analyze the characteristics of network traffic for DDoS attacks. Experimental results show that the proposed model can be a highly useful to detect various DDoS attacks.
1 Introduction Over the last several years, a new breed of network worms such as CodeRed, SQL Slammer, and Nimda have launched widespread attacks on commercial web sites such as Yahoo, CNN, and Amazon, etc [1], [2], [3]. These incidents temporarily disable the network services or damage systems by flooding a huge number of network packets for several minutes or longer. These attacks are harmful to almost networked systems especially open resource sites such as computational grids, and it could well be the next wave of target. Thus, now more than ever, we need to provide a secure grid computing environment over the Internet. Recently, many security models and systems are developed for secure Grid computing in encryption and authentication areas. However, there are rare researches on an availability area of grid computing even though malicious intrusions may easily destroy most of valuable hosts, network, and storage resources in the grids. The vulnerabilities of DDoS in grid computing arise from each grid’s limited resources *
This work was supported by the Ministry of Information Communication, Korea, under the Information Technology Research Center Support Program supervised by the IITA.
H. Zhuge and G.C. Fox (Eds.): GCC 2005, LNCS 3795, pp. 59 – 70, 2005. © Springer-Verlag Berlin Heidelberg 2005
60
J. Seo et al.
that can be exhausted by a sufficient number of users. Thus, most of flood attacks to exhaust resource (e.g., network bandwidth, computing power, and storage) of the victim are possible in grid [4]. In order to cope with the threat, there have been many researches on the defense mechanisms including various DDoS detection mechanisms [5], [6], [7]. However, the common shortcoming of the previous detection mechanisms is that they cannot automatically detect the new attacks. To solve the problem, we adopt the Concentration Tendency of Network Traffic (CTNT) method and Support Vector Machine (SVM) method [8], [9], [10], [11]. In our earlier research, we presented CTNT method to analyze the characteristics of network traffic for the DDoS attacks [12]. CTNT monitors the ratio of a specific type of packets among the total amount of network packets, and compute TCP flag rate and Protocol rate. The result of analyzing network traffic using CTNT showed that there are predictable differences between normal traffic and DDoS attack traffic. In a normal situation, for instance, SYN and FIN are in the ratio of 1:1 and TCP and UDP traffic are in the ratio of 9:1. However, in an abnormal situation (e.g., SYN flooding, UDP flooding), these ratios are broken. Thus, CTNT is used good feature extraction method for SVM that is a machine learning algorithm. Using the traffic analyzing result as input feature of SVM, we were able to automatically generate effective DDoS detection rules. Our detection model showed a high degree of performance, and detected various DDoS attacks successfully. We introduce related research in section 2, and explain CTNT in section 3. The background knowledge of SVM is discussed in section 4. In section 5, the experimental environment is introduced and the detection performance of SVM and other machine learning algorithms are tested and compared. Lastly, we mention the conclusion of this research and the direction of future work in section 6.
2 Related Work There have been some researches to defend Grid environment from DDoS attacks. Xiang and Zhou introduce the vulnerability of grids to DDoS attack and propose distributed defense system to protect grids form DDoS attacks. The proposed system is built with protecting communication network, attack control system, intrusion surveillance system, and traceback system [4]. Hwang et al. proposed GridSec architecture. The architecture is built with distributed firewalls, packet filters, security managers, and intrusion detection and response system [13]. It adopts DHT-based overlay architecture as its backbone. Its overlay network maintains a robust virtual inter-networking topology. The GridSec system functions as cooperative anomaly and intrusion detection system. Intrusion information is exchanged by the overlay topology with confidentiality and integrity. The system reacts automatically to the malicious intrusions and attacks using the information. Traditional defending mechanism against DDoS attacks includes defending, detecting, and reacting mechanism. Most of all, there have been many researches to detect the DDoS attacks since detecting the DDoS attacks is an essential step to defend
SVM Approach with CTNT to Detect DDoS Attacks in Grid Computing
61
DDoS attacks [5], [6], [7]. When DDoS attacks occur, there is a big mismatch between the packet flows “to-rate” toward the victim and “from-rate” from the victim. Gil et al. propose the method that examines the disproportion between “to-rate” and “from-rate” in order to detect DDoS attacks [5]. Kulkarni et al. [6] presents DDoS detection methods based on randomness of IP spoofing. Almost DDoS attackers use IP spoofing to hide their real IP addresses and locations. Since spoofed IP addresses are generated randomly, this characteristic of randomness may be used to reveal the occurrence of DDoS attacks. Kulkarni’s method uses Kolmogorov complexity metrics to measure the randomness of source IP addresses in network packet headers [14]. Wang et al. proposed the method that detects DDoS attack based on the protocol behavior of SYN-FIN(RST) pairs [7]. In the normal situation, the ratio of SYN and FIN is balanced because of the characteristic of the TCP 3-Way handshake. However, the ratio of SYN packet increases drastically during the SYN flooding attack. By monitoring sudden change of the ratio of SYN and FIN, the method detects SYN flooding attacks. However, these approaches are based on the specific characteristics of the attacks such as a mismatch of “to-rate” and “from-rate”, effect of IP spoofing, and unbalance of the ratio of SYN and FIN packet. Thus, these may not properly detect the attacks that use an undefined characteristic. For example, Gil’s method is not applicable to detect attacks using IP spoofing since the method cannot discriminate legitimated packet and spoofed packet, and Wang’s method is only applicable to SYN flooding attacks. On the other hand, the proposed detection model automatically generates detection rules using CTNT and SVM. The advantage of the proposed model will be discussed in the section 5.
3 Concentration Tendency of Network Traffic In a normal situation, network traffic rate has specific characteristics. For example, SYN and FIN are in the ratio of 1:1 and TCP and UDP traffic are in the ratio of 9:1. However, in an abnormal situation such as SYN flooding and UDP flooding, these ratios are broken. Using these fact, CTNT method can effectively discriminate normal situation and abnormal situation. Thus, the traffic analysis result using CTNT method is good input feature of SVM. Details of the CTNT and the differences of normal traffic and attack traffic are explained in section 3.1 and 3.2. 3.1 Concentration Tendency of Network Traffic The Internet provides the users with various types of network services such as WWW, E-mail, FTP, P2P, streaming services, and so on. However, network traffics which are found at endpoint servers have specific characteristics according to the services they provide. CTNT (Concentration Tendency of Network Traffic) is defined as a phenomenon that network traffics are mainly composed of one or more specific types of network packets. For instance, almost TCP packets have ACK flags in their
62
J. Seo et al.
headers during their connection sessions. Moreover, since the Internet has dominant network services such as WWW, E-mail, FTP which are dependent on specific network protocols, CTNT can be found on not only endpoint clients and servers but also core backbone networks [15]. To analyze network traffics on the Web servers in case that various types of DDoS attacks occur, we consider these CTNT as TCP flag rate and IP protocol rate [10]. They examine the occurrence rate of a specific type of packets within the stream of monitored network traffic. TCP flag rate is defined in the following equation. R td [ F i | o ] =
∑ flag ( F ) in ∑ TCP
a TCP header packets
(1)
TCP flag rate means the ratio of the number of a specific TCP flag to the total number of TCP packets. In the equation (1), a TCP flag ’F’ can be one of SYN, FIN, RST, ACK, PSH, URG, and NULL, and ’td’ is the time interval used to calculate the value. In this paper, we omit the time duration ‘td’ when the interval is one. The direction of network traffic is expressed as ’i’ (inbound) and ’o’ (outbound). R td [ [TCP|UDP| ICMP] i | o] =
∑[TCP|UDP| ICMP ] packets ∑ IP packets
(2)
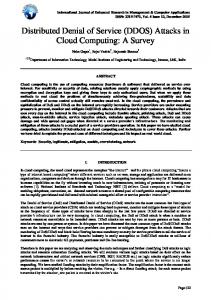
IP protocol rate is defined in equation (2). It means the ratio of specific TransportLayer protocol (e.g. TCP, UDP, and ICMP) packets to total Network-Layer (IP) protocol packets. 3.2 Network Traffic Changes Under DDoS Attacks In this section, we analyze normal Web traffic and DDoS attack traffic using the CTNT and show differences between them. Since web service is based on TCP connection, the number of HTTP requests in a TCP session (R/C: Requests per connection) and the number of TCP sessions simultaneously established (SC: Simultaneous Connection) are the key features of web traffic in terms of network traffic analysis. Thus, we can simulate various web traffic environments by adjusting these two features (R/C and SC). In the experiments, we used SPECweb99 as web traffic generating tool [16]. It sends HTTP requests to the Web server and receives HTTP replies from the Web server like the real Web browsers do. Fig. 1 shows the experimental results of SPECweb99. We changed SC to 5, 10, 50, 100, and 150, and R/C to 1, 2, 5, and 10. As a result, the experiments show that normal Web service traffic has a constant pattern with regardless of SC, R/C, and time. The resulting rate of SYN and FIN is almost identical. The other distinguishing result is that the rate of ACK is very high. It’s because HTTP is based on TCP which is a connection-oriented protocol. These results show that network traffic of normal Web services has a specific pattern.
SVM Approach with CTNT to Detect DDoS Attacks in Grid Computing
1.00 0.80
) % (e 0.60 ta 0.40 R 0.20 0.00
R[Si] R[Fi] R[Ri] R[Ai] R[Pi] R[Ni] R[Ui]
TCP f l ag t y p e (a) Inbound Traffic
1.00 0.80 ) % (e0.60 ta0.40 R0.20 0.00
63
R[So] R[Fo] R[Ro] R[Ao] R[Po] R[No] R[Uo]
TCP flag type (b) Outbound Traffic
Fig. 1. Web service traffic (average value) using SPECweb99
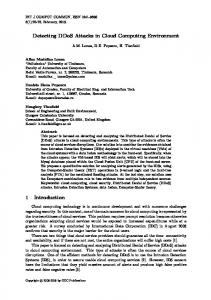
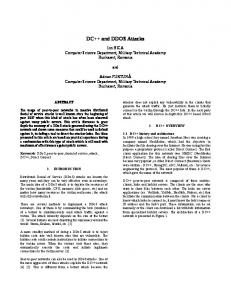
Fig. 2 shows the change of network traffic when a SYN flooding attacks occur. We generate Web service traffic during 72 seconds after 10th second from start the simulation, and a SYN flooding attack was generated during 40 seconds after 17th second from start the generation of the Web service traffic. As shown in Fig. 2-(a), the rates of SYN and URG increased to almost 1.0 and the rates of other flags, especially ACK rate, decreased to almost 0.0 during SYN flooding attacks.
(a) Inbound TCP flag rate
(b) Outbound TCP flag rate
Fig. 2. SYN flooding attacks against the Web server. Under SYN flooding attacks, the rates of SYN and ACK of inbound traffic change significantly.
Furthermore, we can also see big changes of network traffic during other types of DDoS attacks such as ICMP flooding attacks or UDP flooding attacks [8], [9].
4 Support Vector Machine We have chosen Support Vector Machine (SVM) among various other machine learning algorithms as the focus of this paper. Support Vector Machine (SVM) is a learning machine that plots the training vectors in high-dimensional feature space, and labels each vector by its class. SVM classifies data by determining a set of support vectors, which are members of the set of training inputs that outline a hyper plane in feature space. The SVM is based on the idea of structural risk minimization, which
64
J. Seo et al.
minimizes the generalization error, i.e. true error on unseen examples. The number of free parameters used in the SVM depends on the margin that separates the data points to classes but not on the number of input features. Thus SVM does not require a reduction in the number of features in order to avoid over fitting [17]. Details of SVM are explained in section 4.1. 4.1 SVM for Categorization In this section we review some basic ideas of SVM. Given the training data set
{(x i , d i )}iN= 1 with input data
xi ∈ R
N
and corresponding binary class labels
d i ∈ {− 1 ,1} , the SVM classifier formulation starts from the following assumption. di = 1 d i = −1
The classes represented by the subset
and
are linearly separable,
N where ∃w ∈ R , b ∈ R such that
⎧wT x + b > 0 for di = +1⎫ ∃w, b s.t ⎨ T i ⎬ ⎩w xi + b < 0 for di = −1⎭
(3)
The goal of SVM is to find an optimal hyperplane for which the margin of separation , ρ , is maximized. ρ is defined by the separation between the separating hyperplane and the closest data point. If the optimal hyperplane is defined by
(w
)
T , then the function g ( x ) = w 0 ⋅ x + b 0 gives a measure of the distance from x to the optimal hyperplane. T 0
⋅ x + b0 = 0
Support Vectors are defined by data points surface. For a support vector
r=
x (s ) that lie the closest to the decision
x (s ) and the canonical optimal hyperplane
g( x s ) ⎧+ 1 w0 =⎨ w0 ⎩−1 w0 ρ
g , we have
for d ( s) = +1⎫ ⎬ for d ( s ) = −1⎭ ∝
(4)
1
w . w 0 should be minimal to achieve Since, the margin of separation is the maximal separation margin. Mathematical formulation for finding the canonical optimal separation hyperplane, given the training data set {( x , d )} , solves the following quadratic problem 0
i
l ⎧ ⎫ 1 2 minτ (ω, ξ ) = w + C ∑ζ i ⎪ ⎪ 2 ⎨ ⎬ i =1 ⎪⎩s.t di (wT xi + b) ≥ 1 − ζ i for ζ i ≥ 0, i = 1,K, l ⎪⎭
i
N i=1
(5)
Note that the global minimum of above problem must exist, because Φ ( w ) =
1 2
w
2 0
is convex in w and the constrains are linear in w and b. This constrained optimization problem is dealt with by introducing Lagrange multipliers ai ≥ 0 and a Lagrangian function given by
SVM Approach with CTNT to Detect DDoS Attacks in Grid Computing
[
l
]
l
L(w, b,ζ , a, v) = τ (w,ζ ) − ∑ai di (wiT xi + b) −1 + ζ k − ∑vi ζ i i =1
65
(6)
i =1
which leads to l l ∂L = 0 ⇔ w − ∑ai di xi = 0 (∴ w = ∑ai di xi ) ∂w i =1 i =1
∂L =0 ⇔ ∂b
l
∑a d i
i =1
i
(7)
=0
(8)
The solution vector thus has an expansion in terms of a subset of the training patterns, namely those patterns whose a i is non-zero, called Support Vectors. By the Karush-Kuhn-Tucker complementarity conditions, we have,
[ (
) ]
ai d i wT xi + b − 1 = 0
for i = 1,K, N
(9)
by substituting (7),(8) and (9) into equation (6), find multipliers l
maxΘ(a) = ∑ ai − i =1
l
a
i
for which
l
1 ∑∑ai a j di di xi ⋅ x j 2 i=1 i=1
s.t. 0 ≤ ai ≤ c, i = 1,K, l and
l
∑a y i =1
i
i
(10)
=0
(11)
The hyperplane decision function can thus be written as
⎛ ⎞ f ( x) = sgn⎜⎜ ∑ yi ai ⋅ ( x ⋅ xi ) + b ⎟⎟ ⎝ ⎠
(12)
where b is computed using (9). To construct the SVM, the optimal hyperplane algorithm has to be augmented by a method for computing dot products in feature spaces nonlinearly related to input space. The basic idea is to map the data into some other dot product space (called the feature space) F via a nonlinear map Φ , and to perform the above linear algorithm in N F, i.e nonseparable data {( x i , d i )}i = 1 , where x i ∈ R N , d i ∈ {+ 1 , − 1 } , preprocess the data with, Φ : R N → Θ( x) where N