Using Co-Visitation Networks For Detecting Large Scale Online Display Advertising Exchange Fraud Ori Stitelman, Claudia Perlich m6d Research 37 E. 18th Street New York, NY
Brian Dalessandro, Rod Hook, Troy Raeder m6d Research 37 E. 18th Street New York, NY
Foster Provost NYU/Stern School & m6d Research 44 W. 4th Street New York, NY
[email protected] ABSTRACT
1.
Data generated by observing the actions of web browsers across the internet is being used at an ever increasing rate for both building models and making decisions. In fact, a quarter of the industry-track papers for KDD in 2012 were based on data generated by online actions. The models, analytics and decisions they inform all stem from the assumption that observed data captures the intent of users. However, a large portion of these observed actions are not intentional, and are effectively polluting the models. Much of this observed activity is either generated by robots traversing the internet or the result of unintended actions of real users. These nonintentional actions observed in the web logs severely bias both analytics and the models created from the data. In this paper, we will show examples of how non-intentional traffic that is produced by fraudulent activities adversely affects both general analytics and predictive models, and propose an approach using co-visitation networks to identify sites that have large amounts of this fraudulent traffic. We will then show how this approach, along with a second stage classifier that identifies non-intentional traffic at the browser level, is deployed in production at Media6Degrees (m6d), a targeting technology company for display advertising. This deployed product acts both to filter out the fraudulent traffic from the input data and to insure that we don’t serve ads during unintended website visits.
It has been estimated that as much as 50 percent of all “visitors” to websites are not humans [2]. Large amounts of traffic not representing genuine user behavior have major ramifications, considering the multitude of ways companies use internet web logs to inform decision-making based on what is perceived to be human behavior. Web logs have been used to understand consumer behavior, determine demographics of user bases, target advertising, recommend products, and predict elections, as well as for other classification and data-driven tasks. In fact, about a quarter of the industry-track papers for KDD in 2012 were based on data that was generated by online actions. When one considers that a large portion of the “user”-generated data used to perform this research and to build various deployed systems could potentially be generated by non-genuine actions, one may question the validity of predictions and inferences generated by these sources of data. In this paper, we discuss such non-genuine actions in more detail and then describe a two-step approach for classifying non-genuine website visits and filtering those visits from web logs before they can contaminate data analyses and predictive modeling. This procedure is fully deployed at Media6Degrees (m6d), a company providing targeted display advertising to large brands. A recent ComScore study [7] estimated that non-human traffic1 has increased from 6% in 2011 to 36% in 2012. One particular reason for this increase is the opportunity and monetary incentive created by real-time bidding exchanges (RTBs) for display advertising. RTBs are auction platforms that sell advertising slots on behalf of websites for displaying advertisements tailored to each online user. While a web page is loading for an individual user, a bid request is sent out to all the advertisers hooked into the exchange. Interested advertisers then submit bids to the RTB, the auction clears, the winner determines what advertisement to display, and the advertisement is displayed—all in the milliseconds before the page fully renders. The programmatic nature of the exchange-based buying mechanism makes it very efficient for advertisers to target specific users, but it also makes the exchanges particularly vulnerable to website owners who sell ad spots visited by non-genuine traffic. Some websites or clusters of websites are apparently created for the sole purpose of perpetrating this fraud by using non-genuine traffic
Categories and Subject Descriptors I.6.3 [Computing Methodologies]: SIMULATION AND MODELING—Applications
General Terms Design, Measurement, Security
Keywords Fraud Detection, Advertising Exchanges
Permission to make digital or hard copies of all or part of this work for personal or classroom use is granted without fee provided that copies are not made or distributed for profit or commercial advantage and that copies bear this notice and the full citation on the first page. Copyrights for components of this work owned by others than ACM must be honored. Abstracting with credit is permitted. To copy otherwise, or republish, to post on servers or to redistribute to lists, requires prior specific permission and/or a fee. Request permissions from
[email protected]. KDD’13, August 11–14, 2013, Chicago, Illinois, USA. Copyright 2013 ACM 978-1-4503-2174-7/13/08 ...$10.00.
1
INTRODUCTION
It is common to refer to the flow of data and users across internet web pages as traffic. The more visitors to a particular website, the more traffic that website receives.
to extract payments by advertisers for advertisements that no user ever sees. For various reasons, web traffic may be composed of visits that are not “genuine” user visits. Let’s be more specific about what that means. Traffic to websites includes web scrapers that collect data and web crawlers that search engines use to create an index of the web’s content. Other more nefarious “visitors” may include automated comment spammers, hacking tools searching for an unpatched or new vulnerability in a website, “spies” collecting competitive intelligence, or botnets artificially increasing a website’s traffic for revenue enhancement. Such traffic is the result of machines going to websites rather than actual internet users making deliberate decisions to view specific pages. Increasingly, there is another major source of non-genuine traffic: real users whose browsers have been diverted to websites without their control, choice, or often even awareness. To be more specific, we will adopt the term non-intentional traffic (NIT) to emphasize that much of the traffic may involve real users, but the traffic is on sites that they did not intend to visit. Two examples include users are automatically redirected to websites after closing another website; websites also invisibly load certain sites in the background while a user is viewing content from other sites (the latter being intentional visits). In 2011, two articles were released exposing the mechanism and methods used by specific perpetrators to commit fraud by using non-intentional traffic to extract money from online advertisers. The first article [3] involved the uncovering of a pornographic operation (site: hqtubevideos.com), secretly redirecting users to sites like drinkingmagazine.com and relaxhealth.com without their knowledge and then selling advertising spots for those visits. The article conservatively estimated that the scheme resulted in 5 million dollars in fraudulent revenue in 8 months. The second article [11] exposed a command-and-control server used to operate a botnet that was leveraged to perpetrate ad fraud against one of the largest ad exchanges, Yahoo!’s RightMedia. This article also showed that the botnet created a large number of website visits, and the commensurate advertising spots, and also showed that the botnet sent browsers to websites that marketers believed had monetary value (e.g., a store locator page), thus increasing the perceived value of those browsers to the advertisers and targeters. This paper has three major contributions: 1. We propose adopting the term non-intentional traffic (NIT) to replace the term non-human traffic (NHT). This term is more appropriate because much of the spurious traffic actually is initiated by human action and then diverted without the knowledge of the user to particular locations across the web. Using this term will help to focus the modeling and analytics efforts on website visit data that actually represents genuine behaviors that the user intended to take. The intent behind the actions is important from both a modeling and business perspective—especially for intent-based modeling for advertising. 2. We specifically address how data generated without user intent adversely affects analytics and models generated using the data. Most discussion of non-human traffic fails to address the perspective of how it affects analytics or models. This is a perspective that
should be particularly interesting to the KDD community, given how many analyses are done using internet web logs. 3. We describe the implementation of a deployed, realtime method for classifying non-intentional traffic and excluding it from web logs. This approach is based on two stages. In the first stage we create and examine covisitation networks to identify sites with high levels of NIT; in the second stage we use these sites to identify browsers that are in a state of being redirected. To our knowledge, no such system that incorporates method to classify non-intentional traffic and then to filter it out has been previously described or implemented.
2.
USER-GENERATED WEB LOGS
When browsers interact with websites, those actions are recorded in web logs. For clarification, while typically considered a synonym for the human web user, technically a browser is the running instance (presumably under the control of a human) of the software application for retrieving, presenting and traversing information resources on the World Wide Web. The browser generates (http) requests for information that is received and answered by the server of the website. Web logs capture these http requests and serve as the basis for modeling and analytics. In this section we will describe two distinct types of web logs. The first are first party, website-centric server logs and the second are user-centric logs generated through the use of third party cookies. First party web logs are available to the owner of the website and contain typically a very detailed and nearly complete record of all actions on the specific website. The user may have identified himself to the website through a login and provided a lot of personal information as well. As a result these web logs have lots of details; however, those details are specific to actions observed on the particular website and information the user decided to provide to the website only. Third party web logs on the other hand record actions across many websites in the internet by browser. These are the types of web logs we generate at m6d. Since we do not own the websites, we must rely on (third party) cookie technology. Formally, cookies are pieces of data stored on the browsers computer that exist for future retrieval by the cookie owner (m6d) only. Cookies can be stored only by the server returning the information to the original http request of the browser. In order for m6d to obtain such rights, the request is forwarded to us via a pixel which ultimately allows us to store a m6d cookie on the browser’s computer. The cookie of course can be deleted, at which point we will lose all memory of the browser’s previous actions. We use cookies to assign each browser a unique id that lets us reidentify that browser during the next interaction and allows us to observe the actions of a specific browser over time. We have partnerships with data providers as well as the RTBs that place the needed pixels for us in addition to the pixels we have placed on the websites of our clients. We receive billions of daily bid requests from various real-time bidding exchanges (RTBs) and they have become a notable source of information about browsers and the websites they were on at the time of the auctions. That fact proved particularly valuable for identifying NIT.
As a result, our third party web logs are less detailed than the first party web logs but provide a partial view of the browser’s activity across the internet at large. Though NIT contaminates both first and third party web logs, it is very difficult to identify NIT in the first party web logs because those logs cannot observe the movement of browsers from site to site, which is a signature of NIT.
3.
THE EFFECT OF NIT ON MODELS AND ANALYTICS
In this section we present examples of how NIT biases analytical results and potential decisions made based on web log data. These examples illustrate how important it is for practitioners to be aware of this issue and the drastic influence it can have on results and the decisions those results inform.
3.1
Demographic Analysis
2.50%
2.00%
3.2
Low NIT
High NIT 0.50%
0.00%
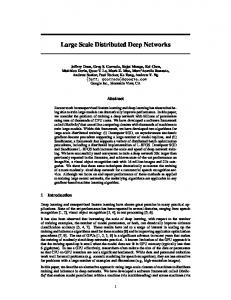
Figure 1: Percent Of Browsers By City (Top 6 Cities) For High NIT Versus Low NIT Sites The first example of how NIT may affect models and analytics is not specific to models we create at m6d, but shows how NIT can affect audience reporting and web analytics. Figure 1 presents demographic data for some sites that have high NIT versus those sites that have no NIT (based on our classification as discussed in Section 4). The figure shows the percent of browsers from each of 6 big US/CA cities to websites with high and low NIT. The figure reveals that the
Personalization Models
Many companies use their own server web logs to personalize the experience for users visiting their sites. Examples of web personalization models include dynamic home pages and recommender systems. However, when the data used to train models for these purposes is contaminated with NIT the resulting models will be subject to bias. The issue is exacerbated by the fact that NIT behaves nearly deterministically whereas mere humans do not. So it is much easier for predictive model to focus on the strong artificial patterns and unknowingly learn the behavior of the NIT. Though we do not have specific examples of how NIT affects these personalization models, the consequence of using data polluted with NIT to fit these models can result in recommender systems and other personalized websites that are not personalized to real users but personalized based on non-intentional visits.
3.3
1.50%
1.00%
distribution of browsers by city is drastically different for those websites that are flagged for NIT from those that are not. For example, low NIT sites have 3 times more browsers that identify themselves as being from New York City than high NIT sites, and high NIT sites have a large percentage of browsers identified as being from Toronto. So if your web analytics shows a shift of browsers origin from New York towards Toronto, it could actually indicate an increase in NIT traffic to your site rather than a real shift in user base. The above numbers are based on millions of observed browsers and thus the differences observed are extremely statistically significant. The presence of NIT has a huge impact on demographic analyses.
Targeted Advertising Models
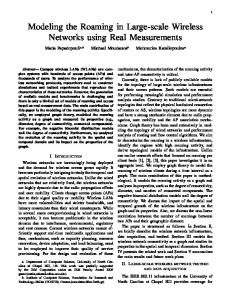
One area of extensive use of web log data is in online display advertising. M6d is one of the companies in this space that use predictive modeling to identify prospect consumers for brands based on browser-centric web log data [6]. We also bid on advertising opportunities through the RTBs [5] and “run the media” (essentially, place the ads). We have particular interest in identifying spurious traffic for two reasons: a) because we do not want to show invisible ads to NIT and b) because we do not want our models to become polluted by fake signal from NIT. On several occasions, we have created models that appeared to be behaving reasonably only to find out later that NIT in the underlying data had adversely (though seemingly beneficially) affected the results. In this section we will present two specific examples. The first example of NIT’s adverse impact was the incident that triggered our discovery of the extensive nature of NIT. Our main modeling task is to predict the probability of a browser to convert based on the history of websites it has visited. We simultaneously build thousands of these models [8] using models such as logistic regression with stochastic gradient descent on about 100 Million URL indicator features. Figure 2 shows the median of a diagnostic metric that we track for these models across hundreds of campaigns.2 Within about 2 weeks, this metric more than doubled. Given the history of this metric, the rapid doubling stood out as a very strange behavior never before observed. We began to investigate the source of the increase, 2 For business reasons, the actual metric and time have been obscured.
and found that many of the parameters of our logistic models where high on a distinct set of somewhat obscure websites that had been created only recently. Furthermore, those same websites (say a site on Chinese videos) indicated consistently high interest across a large variety of campaigns, including auto, bank and wireless phone marketers, among others. This seemed counter-intuitive; to make things even stranger, there were many different websites that were scoring highly across many campaigns and these websites ranged widely in context. So not only was visiting the politics site an indicator of being a good converter for many campaigns, visiting a woman’s health site, a finance site, a hip hop site, and other miscellaneous sites was indicative of being a good prospect across many campaigns. This pattern was at odds with all of our prior experience and intuition. 18
16
Performance
14
12
10
8
6
4
2
0
Time
Figure 2: Aggregate Performance Index Of Targeted Advertising Model Over Time. Once we discovered the websites that were scoring unexpectedly high in many different models, we began to investigate the behavior of browsers that were observed visiting those websites. We found that the same browsers were visiting many of the same suspicious websites. The web logs showed that many of these browsers were being passed from website to website, despite the fact that none of these websites had any contextual relationship or a visible link to each other. So it was fairly obvious that the website visits these browsers created in the web logs were not intentional. In fact, some browsers were observed to log over 30,000 website visits in a single day. That is equivalent to more than one website visit every 2 seconds for a twenty-four hour period. All of this was clearly driven by NIT. It was still unclear, however, how this large amount of non-intentional traffic was able to penetrate our predictive models, because in order for that to happen these browsers would need to have an increased rate in the outcomes that are predicted by the models. We suspected that the same mechanisms that were being used to shuffle the browsers between websites were being used to send browsers to websites being observed as outcomes. This was later verified anecdotally by inspection of some websites, and is discussed in Stone et al. [11]. After we removed the sites that had high levels of NIT from our models, the performance metric returned to reasonable historical levels (see Figure 2). Another set of models built for our targeted advertising system evaluates the best locations (websites) to show an advertisement. These models differ from the above models in that they use the websites the advertisements are displayed on (“inventories”) as features as opposed to the websites that the browsers are observed visiting. The outcomes for the predictive models are the same. These models are discussed in detail in a 2012 bid optimization paper by Perlich et al. [5]. With the introduction of large amounts of NIT,
these models also began to produce erratic scores for inventories. For example, a particular celebrity and entertainment website was ranked in the top 3 of about 600 potential inventory sources across several campaigns. Surprisingly, this celebrity website was ranked in the top 3 for campaigns for eyewear, insurance, hotels, auto, jobs and tax preparation. Other inventory sources exhibited similar behavior. Further inspection of these inventory sources revealed that they contained extremely high levels of NIT.
4.
IDENTIFYING NIT
In the previous section, we cited examples of how high levels of NIT in the online ecosystem can adversely affect web analytics and modeling. Now we discuss how we pose the non-intentional traffic issue as a classification problem, and the challenges associated both with approaching the problem in this manner and with evaluating the success of any proposed classifier. Ultimately our goal is to identify whether the instance of a website visit by a browser is the intentional act of a real human or not. However, classifying such an instance is difficult since each visit does not contain any discriminative information. The combination of sequential website visits, on the other hand, provides a much richer picture of behavioral patters that might be non-intentional. The third party cookie view discussed above observes single browsers across many sites and provides a unique perspective that allows us to identify likely non-intentional sequences and the sites that were equally non-intentionally visited during those intervals. Taking advantage of this we classify websites into two categories, those with large amounts of non-intentional traffic and those with little or no nonintentional traffic. The choice to initially classify websites rather than individuals is supported by the fact that the mechanisms exposed in the literature and observed in our system are all the result of human interventions at the site level. In other words, the sites are actively doing something to alter their percentage of non-intentional traffic. In the most egregious scenarios, the sites’ operators are knowingly pumping their sites full of NIT traffic and knowingly selling those advertisement slots to unsuspecting advertisers. In less nefarious situations, a website operator may be purchasing traffic from a third party thinking they are purchasing human viewers but unintentionally purchasing nonintentional traffic. Regardless of the methodological reason, we begin by classifying those sites with large amounts of nonintentional traffic. Naturally, it is not necessarily true that a website’s traffic is either entirely non-intentional traffic or entirely intentional traffic. For this reason, we use a second classification step that is an extension of classifying the websites as having a large amount of non-intentional traffic. We will discuss below how we use the site level classification to further classify website visits in a second step. There are many challenges to classifying websites based on their level of NIT. Those challenges are both business-related and endemic to the data-generating process, and they extend to using those classifications in a deployed system. We will highlight some of those issues here: 1. The source of traffic for a particular website is not identifiable by examination. As a result there is no way to establish ground truth other than observing the actual source of the traffic. Furthermore, the source or
mechanism that drives traffic to a site is not observable in most instances. 2. Creating an unbiased hold-out test set is almost impossible since we can only know truth by knowing the source of the traffic. 3. Those websites that are passing around large amounts of non-intentional traffic intentionally make themselves appear as desirable locations for advertising based on context. As a result, the sites may appear legitimate upon inspection. 4. Many websites purchase traffic and as a result they have both a large amount of non-intentional traffic and a large amount of legitimate traffic. This further clouds the issue since any given site can be a mix of desirable intentional traffic and undesirable NIT. 5. It is a business imperative to have as large a pool of good inventory sources for advertising as possible. Therefore, it is important to not be overly aggressive in flagging high NIT sites. This is the classic trade-off of Type 1 vs. Type 2 errors in classification. Throughout the remainder of this paper, we highlight in relevant situations how we address these challenges in the creation of the classifier, the evaluation of the classifier and the deployment of the NIT filter.
5.
CO-VISITATION NETWORKS
The approach we take to classifying websites with high non-intentional traffic takes advantage of the fact that many of the high NIT websites are continually passing traffic between each other. The monetary benefit of selling advertising space is directly proportional to the amount of traffic a site has. To maximize profits, the mechanism continuously sends the browsers under its control from one website to the next creating a tell-tale signal of high overlap in browsers between sites: Many browsers seen on site A are also seen within a short period of time on website B. Analyzing covisitation rates between websites is a useful way to determine if the traffic at those sites is likely to be intentional or nonintentional. First we will consider an extreme example to understand how the overlap in user bases between websites can be used as an indicator of non-intentional traffic. Afterward we will show how this logic may be extended to the creation of co-visitation networks and how features based on those networks may be used to finally classify sites that have high levels of non-intentional traffic. First let us consider an extreme in website co-visitation behavior where the browsers observed going to 100 websites with no links between them are exactly the same. This aggregate user behavior is at odds with any observed human behavior and is definitely not driven by the browsers’ intentions. For this to happen, the user would have to be actively typing in each URL in sequence. Such extreme behavior is clearly the result of a fraudulent mechanism that shuffles browsers to websites even though we are unable to actually observe the underlying mechanism that produces these observations. Sites that are known to be legitimate rarely have overlaps in browsers with other legitimate sites that exceed 50 percent. In cases where they do, they are typically large sites that are well known to the general public or part of a
well known network of reputable sites (e.g., mtv, vh1, etc.). For example, the left column of Table 5 shows the top 15 sites in terms of overlap in browsers with nytimes.com. 55% of the browsers that were seen on nytimes.com were also seen on youtube.com and 28% were seen on weather.com and so on. Notice that only one website had over 50% of the same browsers as nytimes.com. Also notice that the majority of the sites in the top 20 are either well known sites that a large portion of all internet browsers visit or they are sites that provide common content (i.e., other news sites). The right column in Table 5 shows the overlap in user base for a relatively obscure website, hiphophavoc.com. Notice that in the top 19 sites that share overlap with this site, all share over 50% of hiphophavoc.com’s browsers. In fact over 90% of the browsers observed on hiphophavoc.com were also seen on filmannex.com, ffog.net, and drugsnews.org. Note that these sites do not have similar content. The list of sites suggests the highly unlikely scenario that there are a large number of browsers out there that are simultaneously interested in hip hop, women’s health, men’s health, pharmaceutics, finance, allergies, greeting cards, and reviews for futons. This seems even stranger given that there were 167 websites with over 50% overlap with the hip hop site in question. So there must be some external process moving these browsers between sites. nytimes.com youtube.com weather.com foxnews.com imdb.com ehow.com latimes.com washingtonpost.com wiki.answers.com abcnews.com forbes.com dailymail.co.uk examiner.com politico.com nydailynews.com usatoday.com
55% 28% 23% 22% 22% 20% 19% 18% 18% 17% 14% 13% 11% 11% 11%
hiphophavoc.com filmannex.com ffog.net drugsnews.org menshealthbase.com womenshealthbase.com hark.com articletrunk.com 411answers.com dailyrx.com all-allergies.com knowvehicles.com modernbaby.com parentingnewsstories.com thefutoncritic.com gourmandia.com
96% 93% 93% 89% 85% 85% 81% 78% 74% 70% 67% 63% 59% 59% 59%
Table 1: Websites with highest browser overlap nytimes.com on the left and hiphophavoc.com on the right.
The majority of analyses of website networks have been based on the links between various websites. Since we do not view the complete movement of browsers from site to site, nor the links on sites, such an approach is not reasonable for our purposes. However, we do view the users at various times across different websites. Thus, we can use the co-visitation of users on websites to establish a network of websites. Using the browser-centric web logs described above, we can create large data sets of browsers and the websites they are observed on. Consider a bi-partite graph G = hB, W, Ei of browsers B and websites W that the browsers are observed visiting. E is the set of edges between the browsers and the websites they are observed at over a pre-specified period of time (e.g., one day or one week). A unimodal graph of the websites W may be constructed from the bipartite graph by projecting the bipartite graph on the W nodes. The unimodal graph GW = hW, Ei is a graph where the nodes are websites W with edges E
Figure 3: Example Co-visitation Network between them. One example of such a projection is: Gm W = hVW ⊆ W, E = {(x, y) : x, y ∈ W, ΓG (x)∩ΓG (y) ≥ m}i where ΓG (x) is the set of neighbors of node x in the original bi-partite graph [1]. Thus, m is a threshold on the number of browsers that visited both x and y. VW is a subset of the websites W that have edges after the projection. This common projection is not suitable for detecting nonintended traffic because popular websites will tend to have a large number of common visitors. An alternative projection that normalizes for the number of visitors on each website is more appropriate and places a threshold on the co-visitation rates between the sites rather than on the absolute number of visitors: Gn W
Figure 4: December 2010 Co-visitation Network where an edge indicates at least 50% overlap between the browsers of both websites.
= hVW ⊆ W, E = {(x, y) : x, y ∈ W, [ΓG (x) ∩ ΓG (y)]/ΓG (x) ≥ n}i
By using this projection, we can establish co-visitation networks where each edge represents a link between two websites, x and y, where at least n ∗ 100 percent of the users on website x were also viewed on website y. Sites that do not have high overlap in users with other sites will present themselves as orphans with no edges in these co-visitation networks. Figure 3 is an example of such a network. Each edge in the graph represents 50% overlap in users and each node is a website. Networks of websites with large amounts of non-intentional traffic represent themselves in clusters in these graphs with large amounts of interconnected nodes like the cluster on the left.
5.1
Results
Figure 4 displays a co-visitation network for a two-week period in December 2010. One thing that is immediately obvious from the network is that there is a relatively large cluster of websites in the middle of the graph. This cluster is a set of sites whose audiences tightly overlap and are exactly the sites with large amounts of NIT that we are interested in identifying. Figure 5 shows the co-visitation graph just one year later. The amount of growth in the clusters of high NIT sites is remarkable. In the December 2011 graph, there are three large clusters of high NIT. The large cluster of websites in the upper middle has grown from similar sites that were in the high NIT cluster in Figure 4. Some of the smaller structures in the network are reasonable and represent groups of truly related websites. Figure 6 is an example of such a cluster. This small cluster involves websites related to the Boston Herald and is not indicative of high NIT. Such small clusters of websites are common; however, they never involve many websites and the sites these clusters include never have more than a handful of first-degree neighbors. Also, they are typically semantically related as in the Boston Herald case. These clusters are very
Figure 5: December 2011 Co-visitation Network where an edge indicates at least 50% overlap between the browsers of both websites different from the big ones in the middle of Figures 4 and 5, where there are tight clusters of sites that have 100s of first-degree neighbors. The right chart of Figure 7 shows the number of sites with more than 5 first-degree neighbors in the co-visitation network over time. Recall that a first-degree neighbor means that the site shares over 50 percent of the same users. The reason that we chose 5 as a threshold on the number of first-degree neighbors is discussed in depth in the following section. There was a steady increase in the number of sites with more than 5 first-degree neighbors throughout 2011 and then the number of websites flattened out in early 2012 to about 1,500.3 The left chart in Figure 7 shows the average number and maximum number of first-degree neighbors in the co-visitation graph over time. While the number of sites with more than 5 first-degree neighbors flattened, the number of neighbors among those groups of sites increased dramatically. The average number of first-degree neighbors for those sites is 150 and the max number of neighbors is over 500. That means that there are websites out there that share over 50 percent of their audience with over 500 other websites. An alternative way of showing just how extreme the overlap in browsers is for some of these networks is displayed in Figure 8. In this situation, we did not let the overlap 3 In October 2012, we requested that our partners stop sending us bid requests from sites we identified as high NIT and thus there was a decrease in the number of sites observed for a short period of time; but then other bid requests made up for those and we observed more sites again.
methods for setting cut-offs that we use for flagging websites as high NIT. We will compare three approaches we explored in determining the threshold.4
6.1 Expert Choice
Figure 6: Neighbors at 50% overlap in a healthy network that is not caused by NIT 2000 500
1500
300 Max Average
sites
Number of 1st Degree Neighbors
400
1000
200
500 100
Jan−2011
Jan−2012
Jan−2013
2011
2012
2013
date
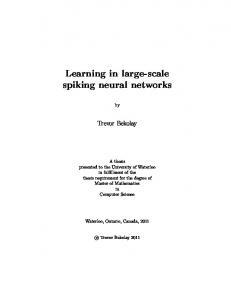
Figure 7: (A) average number and max number of first degree neighbors over time. (b) number of sites with more than 5 first degree neighbors. in browsers define the sites, but rather took a list of sites within a previously known suspicious network of websites that are all owned by the same subsidiary. Again, these sites represented many different contexts and had no links between each other. The heat map on the left of the figure shows the overlap between the sites within the network. The percent overlap is the percent of browsers of the site on the y-axis that are observed on the site on the x-axis. The actual names of the sites are obscured and the subject matter of the sites is displayed. Notice that almost all of the sites overlap at least 60 percent in their browsers and many as much as 90 to 100 percent. There is no way that intent would drive so many browsers to visit the same sites of such varied content categories. Just for comparison, we chose a random set of 50 sites and created a similar heat map. Notice that these sites also vary dramatically in content, and there is almost no overlap in their browsers.
6.
THRESHOLDS ON FEATURES OF COVISITATION GRAPHS
Using the concept of co-visitation graphs, we can calculate a number of metrics that capture the degree of suspicious traffic (number of first degree neighbors, average overlap to first degree neighbors, etc.). However, from a business perspective, we need to make a binary decision about these websites: do we show ads there or not and do we let them be features in our targeting/bidding models or not. It stands to reason that a website that has over 100 websites with over 50% of the same browsers must have a large amount of nonintentional traffic. But at what number k of first-degree neighbors should we classify a website as having a high level of non-intentional traffic? In this section, we explore some
The first approach we took in determining where to place the threshold was using expert opinion. We brought a list of websites ordered by number of first degree neighbors to our ad operations team and other ad delivery experts at m6d. We showed them the list of sites, as well as the number of websites that had over 50% of the same browsers (the number of first-degree neighbors for each site). We also provided them with the number of bid requests for each site. These people have decades of experience in ad delivery and their expert opinions on the model for defining high NIT were important for both assessing its validity and getting it used in production. These experts are concerned about both the amount of inventory available and the quality of inventory. Thus, it was very important for them to set a threshold that did not exclude good inventory sources, while it successfully excluded the majority of those sources with high levels of NIT. A major shortcoming of this approach is that it is not scientific; it does, however, take into account the interests of the stakeholders who use the classification method. This was an important step in proving the validity of the classification model as well as gaining the trust of the ultimate users of the method. Moreover, this method relies on the fact that the experts have informed views about which websites look reasonable and which don’t. The fact that one may not determine high NIT based on inspection is one of the major challenges as presented above. These experts, however, have experience flagging suspicious-looking sites based on other criteria (e.g., too many ad spots, high click-through rates, etc.). Many of the flagged sites also exhibited other non-savory behavior, and this further validated the model in their eyes. In the early days of implementation, the experts were much more concerned with type I errors, that is falsely identifying websites as high NIT when in fact they were not. After some time seeing more of these lists and getting comfortable with the fact that the lists were accurately ranking sites in terms of NIT, these experts settled on a threshold of classifying any site with over five first-degree neighbors as a high NIT site.
6.2 Null Distribution The second approach to informing the choice of a cutoff was to examine the number of first-degree neighbors for a set of known good and reputable websites. Essentially this allows us to create a null distribution of the number of first-degree neighbors. We can then use this empirical null distribution to inform the cutoff. In a list of 56 websites that were known to be reputable, only three had more than five first-degree neighbors, and the site with the most first-degree neighbors had eight. Of the three that had more than five first-degree neighbors, all of their neighbors were websites produced by the same umbrella company or websites with similar content. One challenge of this approach is that identifying reputable websites that are entirely free of NIT is a challenging task, as many reputable companies unknowingly purchase NIT. This makes it difficult to compile a large list of low NIT websites as the basis for a null distribution. The value of this method 4
Note, we set n to 0.5.
Suspicious Network Percent Overlap
Random Sites Overlap
astrology 1
diet A
music 2
news K
diet 4
news J
celebrity 5
misc I
travel 4
health A
celebrity 4
misc H
diet 3
games F
diet 2
news I
politics 2
misc G
mother's interests 3
musice A
sports 4
house A
finance 7
misc F
music 1
games E
auto 4
news H
movies 1
news G
mother's interests 2
misc E
finance 6
news F
news 3
news E
news 2
news D
shopping 1
news C
overlap
auto 3 web series 1
games D misc D
fashion 4
0.3
finance 5 fashion 3
0.4
celebrity 3 games 1
entertainment A
overlap
tech D blog A
0.0
art A anime A
news 1
0.5
fashion 2 travel 3
0.6
sports 3 sports 2
0.2
misc C news B misc B
0.4
news A cable A
sports 1 finance 4 fashion 1 exercise 1
0.7
games C
0.8
finance A
auto 2
0.6
games B
0.8
misc A sports C
0.9
auto 1 diet 1 politics 1
1.0
mother's interests 1 finance 3
1.0
sports B feminism A jobs A fashion A sports A
finance 2
local A
celebrity 2
tech C
celebrity 1
comics A
finance 1
tech B
travel 2
tech A
travel 1
celebrity A media A games A
diet A news K news J misc I health A misc H games F news I misc G musice A house A misc F games E news H news G misc E news F news E news D news C games D misc D entertainment A tech D blog A art A anime A misc C news B misc B news A cable A games C games B finance A misc A sports C sports B feminism A jobs A fashion A sports A local A tech C comics A tech B tech A celebrity A media A games A
astrology 1 music 2 diet 4 celebrity 5 travel 4 celebrity 4 diet 3 diet 2 politics 2 mother's interests 3 sports 4 finance 7 music 1 auto 4 movies 1 mother's interests 2 finance 6 news 3 news 2 shopping 1 auto 3 web series 1 fashion 4 finance 5 fashion 3 celebrity 3 games 1 news 1 fashion 2 travel 3 sports 3 sports 2 sports 1 finance 4 fashion 1 exercise 1 auto 2 auto 1 diet 1 politics 1 mother's interests 1 finance 3 finance 2 celebrity 2 celebrity 1 finance 1 travel 2 travel 1
Figure 8: Percent of overlap in user bases for a network of suspicious websites on the left and for a random group of websites on the right. is that it gives us an idea of how websites that generate traffic through reasonable means would look in terms of firstdegree neighbors in the co-visitation graph. Setting a type 1 error rate of 5% resulted in a threshold of 6 first-degree neighbors.
6.3
Mixture Model
The third approach to evaluating this threshold is the use of a mixture model. A mixture model assumes that the data, in this case the number of first-degree neighbors, is generated from a mixture of underlying distributions, or subpopulations. The actual labels of the subpopulations are not observed, and maximum likelihood is used to estimate the proportion of observations in each latent subpopulation as well as the distribution of each subpopulation.5 The latent subpopulations in the case of NIT would represent different mechanisms for generating NIT. So the subpopulation that is associated with sites with low levels of NIT would have a very low mean number of first-degree neighbors and high component probability (since most sites have low levels of NIT). Likewise, some of the worst offending NIT sites would have very high mean numbers of first-degree neighbors and low component probabilities. For the purpose of this analysis, it was assumed that each of the component distributions was a Poisson distribution. This was a reasonable choice since the observed variable is counts. Alternatively, a negative binomial distribution may have been used. Table 2 shows the estimated component probabilities and Poisson means for 2-, 3-, 4- and 5-component mixture models as well as the cross-validated log-likelihood for each. The log-likelihood was maximized for the 4-component mixture model, so this model was chosen and used to inform the cutoffs. Using the mixture model to create an ROC curve and then using the ROC curve to inform the cutoff resulted 5 Mixture models are not the focus of this paper, so we direct the interested reader to McLachlan et al. [4].
in a threshold of 5 to 6 first-degree neighbors. One criticism of mixture models is that they are highly parametric. One advantage of the model is that it allows us to generate an ROC curve directly weighing the trade-off between type 1 and type 2 errors at different cutoff points (assuming the estimates are made using maximum likelihood). This method resulted in classifying any website with more than 5 first-degree neighbors as high NIT. There are scientific shortcomings to each of the approaches presented here for choosing cutoffs. All of these approaches were considered when we ultimately chose the deployed cutoff method, and each resulted in essentially the same threshold. k 2 3 4 5
Component Probabilities (.965,.035) (.956,.017,.027) (.923,.035,.008,.034) (.848,.104,.011,.012,.025)
Means (0.8,132) (0.7,24,140) (0.6,4,26,151) (0.5,2,9,25,150)
Log-Likelihood -14206.00 -11586.00 -10923.00 -10969.00
Table 2: k-component mixture models of number of first degree neighbors in co-visitation network with neighbors having 50% or more of the same users
7.
DEPLOYMENT
In the previous two sections, we defined a way of ranking and classifying websites as high NIT using co-visitation networks. In this section, we discuss a practical consideration in employing this approach, as well as a second-step classifier that identifies browsers as NIT and can be used in concert with the primary classification system to remove NIT. Initially, we removed visits to all sites identified as NIT from our data sets and no longer placed advertisements on those sites. However, we quickly noticed that large amounts of NIT were still infiltrating our system through new sites
that were created, sites that were not yet identified, and other actions like compromised conversion pixels (as discussed above). We observed that we were placing ads and recording events on sites during the interval between a browser visiting multiple flagged sites. For example, in a 10-second period a browser would visit 6 of the flagged sites and one unflagged site. We would end up buying an ad on the unflagged site and recording that data point in our web logs; however, that action was almost always on a site that would be flagged later or was just below our threshold for identification. For that reason we developed and deployed a second-step classification method called the “penalty box”. The way the penalty box works is if a browser is observed on a flagged site in the recent past, we assume that all of the browsing events are non-intentional, no matter to which website. In essence the browser is placed in a penalty box until it can prove it is no longer in a state of being shuffled around as NIT. This approach takes advantage of the exact movement of traffic the NIT sites are using to make money. Once a browser does not visit any flagged websites for a certain period of time (e.g., 10 minutes), it is deemed clean and we can start recording its actions for data collection and begin showing advertisements again. Some users remain in the penalty box indefinitely, while others have a set of clean actions and a separate set that are suspect.
7.1
Impact Of The Deployed System
In addition to fixing the biased models as presented in section 3, the classification and filtering methods discussed above play a major role in cleaning up our ad delivery methods and identifying fraudulent sites for the entire ad serving community The deployed system described above was a major component of m6d’s partnership with spider.io that led to their discovery of the Chameleon Botnet[10]. In February, 2013, they discovered a botnet that consisted of at least 202 websites that they estimated extract over $6.2 million a month from advertisers. The vast majority of these websites were already flagged by our deployed system and m6d was not purchasing advertisements on them for over a half year before their discovery. These 202 websites make up a small portion of the 1,500 websites we are identifying with the described system (see Figure 7). Other sources estimate that this type of fraud costs advertisers over $400 million a year[9]. Internal estimates show that some advertising exchanges sell almost none of this suspicious traffic, while for others it comprises over 60% of their bid requests. Here is a comment by m6d’s VP of Media Operations, a key stakeholder, on the value of these methods to our business: The classification methods developed by the m6d data science team have had a tremendous impact on three areas of the media operations side of our business: First, for me personally, I no longer have to spend hours sorting through site lists and researching websites to determine if they are worthy of our marketers and our spending. I can agree to work with an exchange that I believe may have a degree of suspicious traffic with complete confidence that we will buy only the high quality, intentional traffic and let the rest fall on the floor. Second is partner education. We are able to take very detailed reports to our supply partners and show them the levels of nonhuman traffic they have in their inventory. This is beneficial for two reasons. First, they know that we are monitoring them and will hold them accountable for the inventory they attempt to sell. Second, we are able to teach them how to identify and
remove the non-human traffic from their supply. We have had this conversation with nearly all of our twenty supply partners. The good news is that most of them have put their new-found skills to use and dramatically cleaned up their inventory. Lastly, this work ensures that our industry as a whole is a cleaner, safer medium that marketers can trust with their advertising budgets. As it stands today, too many ad tech companies are wasting the time and money of clients - both knowingly and unknowingly - serving ads that are never viewed by human eyes.
8.
CONCLUSION
We presented the problem of the increasing amount of non-intentional traffic (NIT) to websites, which contaminates data analysis and modeling in addition to costing advertisers hundreds of millions of dollars a year. Identifying and filtering NIT is of increasing importance to firms and researchers who base their analytics and modeling on website visitation data. We presented a two-stage method for identifying and filtering NIT. The method first uses graph analysis to identify co-visitation networks of websites with abnormally large amounts of browser visit overlap. Then it identifies browsers who are in the process of being sent to websites unintentionally. While these browsers are in the “penalty box”, the logs for analysis and modeling will not incorporate their visitation data. Once they exit the penalty box, they will again contribute to the data. The method has the dual benefit of (i) removing bias from predictive models, and (ii) cleaning up the inventory that we display advertisements on. We also described the major deployment decisions that we have made while developing and vetting the method and quantified the impact of the approach. We hope that in addition to shining additional light on this problem, and possibly encouraging researchers and practitioners to study similar techniques, we also have provided a deep view into the data science practice behind a novel, deployed technique that is now in continual use on a massive scale.
9.
REFERENCES
[1] N. Benchettara, R. Kanawati, and C. Rouveirol. Supervised machine learning applied to link prediction in bipartite social networks. In ASONAM, pages 326–330. IEEE, 2010. [2] T. Foremski. Report: 51% of web site traffic is ‘non-human’ and mostly malicious, 2012. [3] P. Ipeirotis. Uncovering an advertising fraud scheme. or “the internet is for porn”, 2011. http://www.behindthe-enemy-lines.com/2011/03/uncovering-advertisingfraud-scheme.html. [4] G. McLachlan and D. Peel. Finite mixture models, volume 299. Wiley-Interscience, 2000. [5] C. Perlich, B. Dalessandro, R. Hook, O. Stitelman, T. Raeder, and F. Provost. Bid optimizing and inventory scoring in targeted online advertising. In 18th ACM SIGKDD Conference, pages 804–812. ACM, 2012. [6] F. Provost, B. Dalessandro, R. Hook, X. Zhang, and A. Murray. Audience selection for on-line brand advertising: privacy-friendly social network targeting. In 15th ACM SIGKDD, pages 707–716, 2009. [7] B. Pugh. Battling bots: comscore’s ongoing efforts to detect and remove non-human traffic.
http://www.comscore.com/Insights/Blog/ Battling\_Bots\_comScores\_Ongoing\_Efforts\ _to\_Detect\_and\_Remove\_Non\_Human\_Traffic, 2012. [8] T. Raeder, B. Dalessandro, O. Stitelman, C. Perlich, and F. Provost. Design principles of massive, robust prediction systems. In 18th ACM SIGKDD Conference, 2012. [9] M. Shields. Suspicious web domains cost online ad business $400m per year. Adweek, April 2013. [10] spider.io. Discovered: Botnet costing display advertisers over six million dollars per month. February 2013. http://www.spider.io/blog/2013/03/chameleon-botnet/.
[11] B. Stone-Gross, R. Stevens, A. Zarras, R. Kemmerer, C. Kruegel, and G. Vigna. Understanding fraudulent activities in online ad exchanges. In 2011 ACM SIGCOMM conference, pages 279–294. ACM, 2011.