manipulation of icons on a computer to solve an electric circuits problem. Sixth-grade students .... save the screen as a "notebook page," with written comments ...
Journal of Science Education and Technology, Vol. 4, No. I, 1995
Using Computer Simulations to Assesss Hands-On Science Learning 1 Gail P. Baxter 2,3
Two methods of assessing student learning of a hands-on instructional unit are compared. One method involves manipulation of concrete materials, and the other method involves manipulation of icons on a computer to solve an electric circuits problem. Sixth-grade students in an inquiry-based science program completed both assessments separated by three weeks. Results indicated that although mean performance was the same for each method, individual student performance varied considerably. Implications for use of computer simulations as an alternative to hands-on assessment are discussed. KEY WORDS: Science assessment; performance assessment; computer assessment.
based reasoning tasks. Fourth, students experiment with the technology, discovering solutions to problems that they might not have found with other types of assessments or instructional activities. In this paper, the use of computer simulations as an alternative to hands-on assessment is discussed. 4 An Electric Mysteries assessment developed by a team of researchers, scientists, and teachers is the focus of the discussion (for details, see Pine et al., 1991; Shavelson et al., 199i). Two methods of assessment were developed, one using concrete materials and the other a computer simulation. The former was developed under the assumption that the optimal way to evaluate hands-on learning is with handson assessment. In other words, the ideal assessment would provide students with equipment, pose a problem, and have an observer evaluate students' perf o r m a n c e s in real time. T h e l a t t e r ( c o m p u t e r simulation) was developed in an attempt to find costand time-efficient alternatives to direct observation. If simulations are used to assess hands-on learning, it becomes important to know to what extent stud e n t p e r f o r m a n c e on a s i m u l a t e d investigation
INTRODUC~ON Computers offer a unique opportunity to link assessment with teaching and learning because they can provide an open-ended, unconstrained environment for conducting science investigations (Pine et al., 1991). Although development costs are considerable, computer assessments offer a number of advantages over hands-on assessments (e.g., Helgeson and Kumar, 1993; Shavelson and Baxter, 1992). First, simulations are less costly and time consuming to administer than hands-on assessments, in part because large numbers of students can be tested simultaneously if sufficient computers are available. Second, computers maintain a full record of performance, so teachers and students can review problem-solving processes. Third, simulations offer the opportunity to teach and assess areas that are impractical to do hands-on such as genetics experiments or model1This research was supported by grants from the National Science Foundation and the Office of the Vice President, University of Michigan. Opinions expressed are those of the author and not necessarily the supporting agencies. 2University of Michigan, School of Education, 610 East University, Ann Arbor, Michigan 48109. 3Correspondence should be directed to Gail P. Baxter, University of Michigan, School of Education, 610 East University, Ann Arbor, Michigan 48109.
4The research reported here is part of a larger study conducted by the author and her colleagues Richard J. Shavelson, University of California, Santa Barbara, and Jerome Pine, California Institute of Technology. For details, the reader is referred to Baxter and Shavelson (1994).
21 1059-0145~$~30B~0021507.50/0O 1995PlenumPubfishJngCorporation
22
Baxter
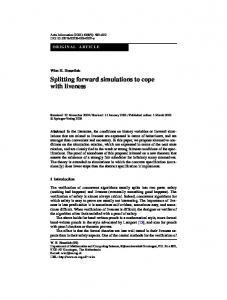
You have some batteries, bulbs, and wires in front of you [or doing some experiments. All the wires are the same. They are just different colors. They have clips on the end so you can connect thingS. 1. Connect one battery, one bulb, and wires so the bulb lights. Draw a picture in the box that shows what you did. If you like use symbols like these:
Battery symbol:
--I
'
Bulb symbol: Wire:
2. Ftgure out what is in the mystery box labelled with a question mark (?). The box has either a battery or a wire inside:
To help figure out which one is in it connect it in a circuit with a bulb:
Fill in the answer: The"?" box has a
in it.
Fig. 1. Electric Mysteries Part I (adapted from Shavelsonet aL, 1991).
matches that for the same investigation done with concrete materials. Any discrepancy in performance would call into question the appropriateness of using simulations as a viable alternative to direct observation of student performance. The paper begins with a description of the Electric Mysteries assessments. Next, a comparison of student performance with each method is presented. The paper concludes with a discussion of the strengths and limitations of using computer simulations for assessing hands-on learning.
HANDS-ON ASSESSMENT For this method of the assessment, students are presented with equipment and asked to conduct an investigation to determine the contents of six "mys-
tery" boxes. Students cannot see inside the boxes, nor does light shine through the boxes. The task has two parts (see Fig. 1). Part I serves to orient students to the equipment (batteries, bulbs, wires with clip leads, and mystery boxes) and the task. To this end, students are asked to create a circuit and draw a picture of it. Then, students are asked to determine whether a battery or a wire is in a box with a question mark on it. They are prompted to connect the question mark box in a circuit with a bulb to determine what is inside. Part II of the task asks students to determine the contents of each of six mystery boxes A - F from a list of five possible alternatives (see Fig. 2). Students are presented with two batteries, two bulbs, and five wires to connect circuits to the six boxes. Two of the boxes have the same thing (box B and F
Computer Assessment
23
Find out what is In the six Mystery boxes A, B, C, 13, E, and F. They have five different things inside, shown below. Two of the boxes have the same thing. All of the others have something different Inside.
"-•
M ~
Two
Batteries
Bulb - ~ ~ --~
Battery and
~-
Bulb
Nothinelgall
For each box, connect it in a circuit to help you figure out what is inside. You can use your bulbs, batteries, and wires any way you like. Fig. 2. E l e c t r i c Mysteries Part II ( a d a p t e d from Shavelson et al., 1991).
each have a wire). All of the others have something different. The boxes are sequenced such that the first and fifth boxes can be solved by testing with a bulb in the circuit and the other boxes require a battery and bulb.
COMPUTER SIMULATION The Electric Mysteries computer simulation was developed in a Macintosh environment so as to replicate as nearly as possible the hands-on investigation (Fig. 3). The screen was divided into three sections: equipment pallet, work space, and control panel. To begin the simulation, there is a brief tutorial that illustrates how to drag simulated batteries, bulbs, and boxes from the pallet at left and connect them with wires. Wires are drawn by clicking at one terminal of a circuit element and dragging to another terminal. Wires are removed by double-clicking on them. Students could connect a multitude of circuits on the screen at once. Alternatively, they could leave one completed circuit on the screen for comparative purposes. In the tutorial, the student also learns how to save the screen as a "notebook page," with written
comments along with the circuit picture; to get a new blank page; and to go back to a previous page and edit it (using the buttons in the control panel at the right of Fig. 3). Proceeding exactly as in the hands-on investigation, guided by similar written material, the student is first asked to light a bulb. Next, to establish the idea of using an external circuit to find out what is inside a closed box, the student does the "question mark" box. The result is written in the "notebook," and the circuit and the written answer are saved. Finally, the student is shown on paper the five possible contents of the six boxes, as in the handson investigation, and asked to find out what is in each one. Box A can light a bulb and responds to the same strategy as the student learned to use with the question mark box. Box B is a box that will not light a bulb, and a new external test circuit needs to be used. The software emulates the behavior of a real circuit. For example, a bulb connected to a box that contains a battery and a bulb would appear dimmer than a bulb connected to a battery. A bulb c o n n e c t e d to a box t h a t contains two b a t t e r i e s would appear brighter than a bulb connected to one battery.
24
Baxter ~ ~ m m
Jemj- Page #1 ~
q2)-IN-
Notes: Box B has ~ bulb in it I
Fig. 3. Electric circuits computer simulation.
MYSTERY BOX
ANSWER
SCORE
Cl RCUIT i
Ha~s'-~ Compeer
Battery
Bulb only
A
D
tnd Bu~
B
C
VV3re
C
E
st d[
O
A
Two Btt~fies
Bulbonly
E
8
OneB~b
Battery Bulbend
F
F
Wire
Btltery Bulbtrd
]~e~dBulb
l~ u
~]
TOTAL
Fig. 4. Scoring system for Electric Mysteries (adapted from Shavelson et al., 1992).
SCORING Student performance is scored on the basis of: (1) identification of the contents of each box and (2) the sequence of circuits used to arrive at the answer (Fig. 4). If the student correctly identifies the contents of a box and uses a legitimate circuit to test the box, he/she is credited with one point. If the stu-
dent fails to correctly identify the contents and/or fails to demonstrate the use of an adequate circuit or sequence of circuits, no credit is assigned. The maximum possible score is 6 (one for each box). The initial part of the task (build a circuit and determine what is in the question mark box) are not scored, as these questions serve to orient the student to the task.
Computer Assessment
25
Studlmt's Name:
v
Mystery boxes ANSWER
R~
~
"0~"-~
-dr
F
I -q 0
-
t
Fig. 5. Observer score form for hands-on investigation.
Hands-on performance was scored on the basis of rater observations. While the student conducted the investigation, the observer recorded the sequence of circuits the students used to test each box (Fig. 5). For the simulation, when the student is finished and signs off, the computer writes a file in which his or her every move is saved for later replay with the evaluation program. First, the evaluation presents an overview of all the saved pages. Then, starting at a chosen page, the viewer can play back each move or just look at the final circuit of each page (Fig. 6). Performance is graded by observing each move in succession using the horizontal scroll bar. The vertical scroll bar scans pages, and a movie replay is also available. The viewer can add comments in the notes section, which are saved and could provide feedback to the student. Any screen can be printed, or a summary of all the saved pages.
COMPARISON OF HANDS-ON AND COMPUTER SIMULATION The computer simulation appears, at least on the surface, to be comparable to the hands-on investigation because each assessment method engages students in a cyclical process of hypothesis testing and refining to identify the circuit components enclosed in each of six boxes. Using their knowledge of what constitutes a circuit, and the impact of changing various components in a circuit (e.g., adding a second bulb), students test out their hypothesis by manipulating equipment (lab equipment or icons on the computer) and interpreting their observations. For example, if the bulb is dim when connected in a circuit to one of the boxes, students might reason that there is a battery and a bulb in the box. If the bulb is very bright, students might reason that there
26
Baxter
Jerry Page [ " ~ of I Frame ~ffN-]o f 12 ~ - ] : I ~ - ] of 0:45
@ I:1 @ 1:5
C) 1:20
~lotes:
Fig. 6. Computer evaluation program.
are two batteries in the box. A fundamental question is: to what extent does student performance on the simulated investigation match that for the same investigation done with concrete materials? To address this question, approximately 100 sixth-grade students enrolled in an inquiry science program completed both methods of assessment. For the hands-on investigation, students were tested individuaUy by a trained observer who noted the sequence of circuits students constructed to test each box and the conclusions they made based on those tests (e.g., box B has a wire in it). Approximately three weeks later, students were tested on the simulation. The testing was done using four Macintosh computers in a single room, with two supervisors whose role was to schedule students, help them through the tutorial, and reboot the computers after crashes. Approximately 20-30 min were required for students to complete each method, although time limits were not imposed. For the hands-on and computer simulation assessment methods mean performance across students, difficulty of each box, and individual student scores were compared. Results indicate that mean performance was approximately equal for both methods (3.76 and 4.05, for hands-on and computer, respectively). The score distributions were very similar, varying in only two respects. None of the students scored zero on the computer and almost twice as m a n y s t u d e n t s s c o r e d f o u r on the c o m p u t e r (N = 25) as on the hands-on (N = 14) assessment. Next, the difficulty of each box was examined. Recall that the ordering of the boxes varied by as-
sessment method. Nevertheless, for both methods the first and fourth boxes contained a battery. The second, third, and fifth were different nonbattery boxes, while the sixth in both cases was a second box with a wire in it. The intent was to keep the difficulty about the same for both orderings. Comparison of proportions of students answering correctly indicate that difficulty did not vary with assessment method. The box containing two batteries was always the easiest and the boxes containing a wire or a bulb were the most difficult. Finally, individual student scores on the handson and simulated versions were compared. The differences were surprisingly large. At each score level for the hands-on assessment, every possible score was obtained on the computer simulation. In other words, students who scored 6 with the hands-on assessment, received scores of I through 6 for the computer simulation. The lack of relationship is reflected in the low correlation (0.35). Some students scored higher on the hands-on than on the computer; the opposite was true for other students. It is clear that for this sample of students the simulation and the hands-on methods provide different information about individual students' knowledge of circuits. What could account for this discrepancy? To gain some insight into the performance discrepancy, a qualitative analysis of six students' performances on each method was carried out. Two of the students scored three points higher with hands on (6, 5) than computer (3, 2); two of the students scored three points higher with the computer (6, 4) than with hands-on (3, 1). Results indicate that all
Computer Assessment six students displayed a good strategy for the method that resulted in the highest score. Typically, they tested each box with a bulb first and then, if necessary, a battery and bulb. They correctly interpreted the information from their tests and operated within the constraints of the task. In contrast, students' performances with the method that resulted in the lowest score are best characterized by a combination of inadequate strategy (e.g., used battery and bulb to test every box), misinterpreted information (e.g., bulb dim therefore a wire in the box), and/or failure to monitor performance (e.g., did not compare conclusions to list of possible options). For example, students may have reported a wire three times. Twice the bulb was lit normally (correct interpretation) and once the bulb was lit dimly (incorrect interpretation). Had the student operated within the constraints of the task (two of the boxes have the same thing, all of the others have something different) this error could have been corrected. In summary then, the computer simulation provides the same information as hands-on assessments averaging across all students. For individual students, there are large fluctuations in performance. Some students perform better with one method and some students perform better with the other. The simulations, then, are not strictly equivalent to hands-on investigations for individual students.
27 cost-efficient alternative to direct observation of student performance. Materials do not need to be refurbished (e.g., batteries), formative feedback can be provided to the student via comments entered on the evaluation screen, and scoring is quick and easy. Perhaps most important is that the format is inherently motivating to students who feel quite free to experiment with the technology, posing questions and looking for solutions. The simulation then serves as an instructional tool and as an assessment tool (Shavelson and Baxter, 1992). Heretofore, computer simulations have not received the attention they warrant given their unique potential to link testing with teaching and learning. The research reported here, and elsewhere (e.g., Helgeson and Kumar, 1993; Pine et al., 1991) suggests the need for considerable empirical work beginning with the development and evaluation of appropriate simulations for teachers to use. Extensive development efforts permit an examination of the strengths and limitations of computer simulations for instruction and assessment. An understanding of the relative effectiveness of a diverse range of simulations in a variety of instructional contexts provides a basis for wide-scale implementation and use that maximizes the potential of simulations as an educational tool.
REFERENCES IMPLICATIONS OF COMPUTER SIMULATIONS FOR ASSESSMENT Three factors set the stage for research and development of computer simulations for use in elementary science classrooms: the increased availability of computers in the classroom, the increased use of hands-on instructional techniques for science teaching, and the demand for alternative, cost-efficient assessments symmetric with instructional practice. The research discussed here suggests a significant potential for computer simulations as a form of performance assessment given the desirable characteristics of this technology. The simulation offers a time- and
Baxter, G. P., and Shavelson, R. J. (1994). Performance assessments: Benchmarks and surrogates. International Journal of Educational Research 21(4): 279-298. Helgeson, S. L., and Kumar, D. D. (1993). A review of educational technology in science assessment. Journal of Computers in Mathematics and Science Teaching 12(3/4): 227-243. Pine, J., Baxter, G. E, and Shavelson, R. J. (1991). Computer Simulationsfor Assessment. Paper presented at the Annual Meeting of the American Educational Research Association, Chicago. Shavelson, R. J., and Baxter, G. P. (1992). What we've learned about assessing hands-on science. Educational Leadership 49(8): 20-25. Shavelson, R. J., Baxter, G. P., and Pine, J. (1991). Performance a s s e s s m e n t s in science. Applied Measurement in Education 4(4): 347-362. Shavelson, R. J., Baxter, G. E, and Pine, J. (1992). Performance assessments: Political rhetoric and measurement reality. Educational Researcher 21(4): 22-27.