The total change in the Linux kernel amounts to 3 lines of assembly code in arch/i386/kernel/entry.S and about. 50 lines in a newly added C file contauth.c.
Using Continuous Face Verification to Improve Desktop Security Rajkumar Janakiraman, Sandeep Kumar, Sheng Zhang, Terence Sim Department of Computer Science National University of Singapore 3 Science Drive 2 Singapore 117543 {janakira,skumar,zhangshe,tsim}@comp.nus.edu.sg
Abstract In this paper we describe the architecture, implementation, and performance of a face verification system that continually verifies the presence of a logged-in user at a computer console. It maintains a sliding window of about ten seconds of verification data points and uses them as input to a Bayesian framework to compute a probability that the logged-in user is still present at the console. If the probability falls below a threshold, the system can delay or freeze operating system processes belonging to the logged-in user. This helps prevent misuse of computer resources when an unauthorized user maliciously takes the place of an authorized user. Processes may be unconditionally frozen (they never return from a system call) or delayed (it takes longer to complete a system call), or appropriate action may be taken for certain classes of system calls, such as those that are considered security critical. We believe that the integrated system presented here is the first of its kind. Furthermore, we believe that the analysis of the tradeoffs between verification accuracy, processor overhead, and system security that we do in this paper has not been done elsewhere.
1. Introduction By continuous verification we mean the idealized notion of user authentication before any access control decision in a computer system on behalf of the user. In an identity-based access control system where the user identity determines access rights to objects, such authentication may be construed to mean an implicit approval of access. Continuous verification, if it can be realized efficiently, is important in high risk environments where the cost of unauthorized use of a computer is high. This may be true for computer driven aircraft cockpit controls, computers in banks, defense establishments, and other uses that manipulate large amounts of money or affect the security and safety of human lives. In such situations it is desirable to realize some approximation of continuous verification, with the goal of rendering
the computer system ineffective when the authorized user cannot be authenticated. Traditionally, the domain of Computer Security has investigated intrusion detection techniques [Den87] to discover such unauthorized use. These techniques either monitor for specific patterns of system events that clearly signal undesirable behavior (termed misuse intrusion detection [Kum95]), or use some form of statistical profiling to separate good behavior from bad (termed anomaly intrusion detection). Statistical techniques have, however, historically suffered from an overwhelming number of false positives that have limited their utility. Intrusion detection is a stronger property than continuous user authentication and attempts to detect misuse even for accesses that may be individually permitted for a user. In this work we sidestep the issue of profiling and recognizing behavior of different users and equate successful face verification with authorization of all activity occurring on behalf of the user. So while the ultimate goal of intrusion detection provides better (but yet unrealizable) security guarantees, our approach provides a preventive mechanism that provides a better guarantee against unauthorized system use than what is available today. Building an effective face verification system consists of many aspects. Not only must the face verification system be integrated with the operating system (as opposed to just running as a process on it), it can be critical to balance several conflicting metrics, namely accuracy of detection, system overhead incurred during face verification, and the vulnerability window within which the system must respond when it detects that the authorized user is absent. This relationship is explored further in Section 5. Accuracy of verification (the probability that the face verifier is correct), say a, can be improved by combining multiple samples (referred to as temporal integration in the literature), say the last M , which also smoothens the fluctuation in the decision made per sample. However, the longer 0 This work is funded by the National University of Singapore under research project #R-252-000-146-112.
one takes to collect these samples, the more one exposes the computer to successful exploitation. If the vulnerability window is t (for concreteness, if it takes an intruder ten seconds to subvert the computer then t = 10), then one must take at least M samples within this period. However, the number of samples/unit time is roughly ∝ to the overhead incurred. Studying the relationship among these parameters and determining heuristics that balance them for a particular operating environment can be crucial in making a face verification system that is both practical and effective.
1.1. Contributions of the paper We believe that prior work in the area has not attempted to study these metrics and their interrelationships in any depth. Nor has anyone attempted to build a reactive system integrated into the operating system that responds to failures of face verification in real time. We believe these to be novel in our work. In the rest of the paper we explore the architecture of such a system, the techniques we use for face verification, the kernel changes needed to make the system reactive to verification failures, and the performance impact of such a system. The goal is to render a computer system ineffective within a certain time period in the face of verification failures. This time should be a conservative estimate of the time it would take someone to cause information loss (confidentiality, integrity, or availability [Pfl96]) to the system.
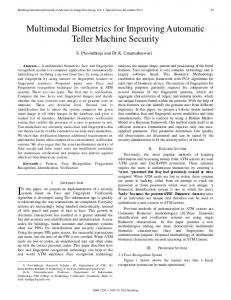
2. Architecture We consider the following environment of operation of a computer. A digital camera device is connected securely to a workstation which can take images of the user working at the workstation. The workstation itself is physically secure so taking physical control of the workstation is not possible1 . The focus of this work is to guard against surreptitous use of the workstation while the authorized user is away, or to somehow “hijack” the workstation after an authorized login. Figure 1 pictorially describes the elements that comprise the overall architecture of our face verification system and how it is integrated with the operating system. We have implemented this architecture on the Linux 2.4.26 kernel [The] and the Redhat 9.0 distribution. When a user logs in to the computer console using, say, kdm [Cro], kdmsends a message to the monitor indicating the uid2 of the user. Augmenting kdm to send the message only required writing a suitable session PAM module [Mor] and adding a suitable entry in /etc/pam.d/kde which for us looked like 1 It would be trivial to circumvent security if physical access is allowed to the computer. 2 A unique number associated with each user having an account on the machine.
Figure 1: Architecture of a face verification system integrated with the operating system.
session
optional pam_cntauth.so
Once the monitor has the user id of the logged in user, it loads a profile corresponding to the user and starts image capture using the video box in Figure 1. The user profile specifies the system action that must be taken in case the probability of the user falls below a threshold. The monitor is the central coordinating entity in the architecture and drives the video component by periodic image capture, runs the image though the face detection and verification algorithms (described in Section 3), maintains the composite probability of user presence at the computer (described in Section 3.4) and controls user processes by communicating with the kernel level driver drv.
2.1. Linux Kernel Changes In order to support controlling OS processes when the probability of user presence falls below a threshold, we modified the Linux kernel with very minor changes. As depicted in Figure 1, when a user process seeks operating system services by making a system call, it traps into the OS kernel and executes the kernel code relating to the system call [Lov03]. We have introduced a callback at this point whereby every user process calls a special function pointed to by the function pointer contauth_cb. This callback is invoked on every system call. The function that is actually executed on callback is externally defined and dynamically loaded into a running kernel. There are accessor functions by which the callback function pointer can be set to the external function or reset to NULL. This keeps the kernel changes to a minimum and adds flexibility in changing the functionality associated with controlling processes. The total change in the Linux kernel amounts to 3 lines of assembly code in arch/i386/kernel/entry.S and about 50 lines in a newly added C file contauth.c. Currently we have only one callback point in the kernel. We may add more callback points for better process control, for e.g., at the point where a process ends its time slice and is context switched. The performance impact of this change is
described in Section 4. We now describe the face verification algorithm that we used in our experiments and on which our performance numbers are based. At the core is a machine-learning based technique called the Bayes’ Classifier, which is the theoretical optimal given the required probability density functions (pdfs) [DHS00].
3. Face Verification The goal of face verification is to determine, from analyzing face images, whether the person with the claimed identity is who he claims to be. Two situations can occur: either the verifier accepts the claim as genuine, or the verifier rejects it (and decides that the user is an imposter). To be more flexible, we allow the verifier to indicate unsure, when it cannot reliably determine one way or the other. Our face verification system consists of four steps: face detection, feature extraction, performing a single verification, and combining multiple verifications.
3.1. Face detection We use the Viola-Jones face detector [VJ02] to detect faces from each frame in the input video. We then crop the face region to remove background, and reduce its size to 32 × 40 pixels. This cropped image is then given to the next step.
3.2. Feature extraction We use a single feature derived from the Fisher Linear Discriminant (FLD) [DHS00]. FLD seeks directions W that are effective for discrimination. It selects W in such a way that the ratio of the between-class scatter and within-class scatter is maximized (see Appendix for details). Once we have W, we extract the feature using: y = WT x
(1)
3.3. Performing a single verification To perform a single verification, we use a Bayes classifier. For training, we first collect ten training images of each user to be verified. Then we augment the training set using the idea in ARENA [SSMB00], which synthesizes random 2D translations, rotations and scaling from each original training image. From the initial ten images we increase the training set to 6200 images per person. This is done so that subsequent pdfs may be estimated more accurately. For each user, we define class D1 to be that user, and class D2 to be all other persons.3 Next, we extract the 3 We further add 6200 face images from about 2000 people obtained elsewhere to better represent D2 .
feature y from all the training images of D1 , using Equation (1). From this we estimate the class conditional pdf P (y|D1 ) by using a histogram. Similarly, by extracting the features of images of class D2 , we learn P (y|D2 ). Thus each user to be verified by the system is represented by the pair of pdfs: [P (y|D1 ), P (y|D2 )]. When a user presents himself for verification, the claimed identity is used to select the appropriate pdf pair. The Bayes classifier proceeds by determining the maximum a posteriori (MAP) class: D? = arg max P (Di |y) Di
= arg max Di
where P (y) =
2 X
(2)
P (y|Di )P (Di ) P (y)
P (y|Di )P (Di )
i=1
Here we assume priors to be equal, i.e. P (D1 ) = P (D2 ) = 0.5, but this can be adjusted according to the application. A MAP class of D1 means accept, while a MAP class of D2 means reject. However, for added flexibility, we re-write our decision rule as: Output accept > σ, < −σ, Output reject P (D1 |y)−P (D2 |y) (3) otherwise, Output unsure The use of a threshold σ allows us to determine a “region of uncertainty” wherein the verifier need not commit to a firm decision, but instead pass the decision to the monitor. Also, in the event that the face detector fails to detect a face, the verifier outputs unsure.
3.4. Combining multiple verifications If the face verifier were perfect, never making an error, a single verification is sufficient for authorization. Since it is not, we can decrease the error rate by combining multiple independent verifications. That is, over a window of time t, we capture M images {xj } and combine their features {yj } to obtain a more accurate decision. Using our Bayesian framework, and assuming that the features are independent, the MAP class is determined as in Equations (2) and (3), except that y is replaced with y1 , . . . , yM .
4. Performance All performance measurements were taken on an Intel Pentium 2.4GHz workstation with 512MB RAM. The captured images were 768 × 576 8-bit deep.
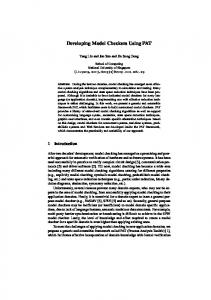
4.1. Micro benchmarks To assess the performance impact of our Linux kernel changes, we ran the lmbench [MS96] suite to determine
the overhead introduced in the system call path. The results are summarized in Figure 2. 4
As seen from the figure, for every extra frame captured and processed per second, the overhead is about 10%. The overhead also seems to be linear with fps. This is what we expect because each image size is the same and requires the same processing for face detection and verification.
3.5
4.3. Face detection optimization
2.5
2
1.5
1
0.5
fork+exit
fork+execve
select on fd's
open/close
stat
fstat
read
write
Syscall
0
System Call
Figure 2: Micro Benchmark Results The percent overhead on the y-axis is the percent increase in time for executing a system call with our modifications for stopping and delaying processes when compared with a standard 2.4.26 Linux kernel that can be downloaded from www.kernel.org. The overhead is dependent on the system call exercised. The overhead is as low as .4% for the fork+execve combination to a 3.75% overhead for read. We believe this to be acceptable.
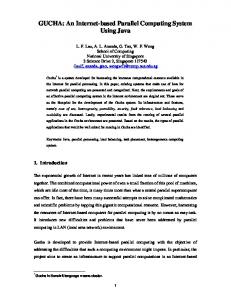
For macro benchmark tests we assessed the performance impact on compiling the Linux (2.4.26) kernel. The compilation generates about 1200 object files. We chose the Linux kernel compilations because it pollutes the cache and processor utilization is significant. The y-axis is the percent increase in time for finishing the benchmark with image capture and face verification when compared with running the benchmark without such processing. The impact is summarized in Figure 3.
% CPU Overhead
80 60 40 20 0 5
80
No Tracking Tracking
60 40 20 0 0
5
10
15
Frames (verification) per second
Figure 4: Macro Benchmark Results With Face Tracking
4.2. Macro benchmarks
0
In order to reduce the CPU overhead resulting from face detection, we tried the following optimization. (While this optimization is not the main focus of the paper, we are happy with the results and hope to pursue this optimization further to determine its robustness in real settings.) We keep track of the bounding box within a full image where the face was detected and use that as an approximation for the next instance of face detection. If the image capture rate is sufficiently high, “tracking” is possible with low overhead. This appears to be a win-win situation. A high frame rate gives better security without resulting in substantially increased CPU utilization. The CPU utilization depicted as overhead in macro benchmark measurements with face tracking enabled is shown in Figure 4.
% CPU Overhead
% CPU Overhead
3
10
15
Frames (verification) per second
Figure 3: Macro Benchmark Results
The overhead with face tracking is about 0.33—0.5 of that without tracking and seems to be a promising optimization to pursue. It effectively reduces the size of the image that the face detector has to search.
5. Discussion As we expected, the overhead in our system is in recognizing faces in images. As Figure 3 indicates, for our environment of operation it contributes about 10% overhead for every extra frame/sec. This value may be different for different operating environments and depends on the processor speed, available memory, and image size but the overall nature of the dependence (linear for example) is likely the same. No other overhead comes close to this. To get a sense of the accuracy of our face verifier, we performed the following test. First, 1200 images of each of four legitimate users were captured and their features extracted. Then, for a fixed value of σ, the false reject rates (= number of rejects / 1200) were computed using Equations
2. Most curves exhibit a monotonic decrease in M . The anomaly seems to be in the σ = 0.9 curve, which rises for moderate values of M before decreasing. The σ = 0.8 curve (not shown) also has the same behavior. We will need to further investigate this phenomenon. 3. Whichever curve is used, when M exceeds about 50, the error rate is almost zero. Thus, it is never beneficial to use more than 50 sample points for verification. 4. Curves for smaller σ values are always on top of curves for larger σ values. Intuitively, this makes sense because the larger σ is, the more we demand that the probability of the correct class D1 exceed (by σ) the probability of the wrong class D2 (see Equation (3)). That is, a larger σ means a more conservative decision. This also suggests that a trade-off is possible between σ and M . Given a fixed false reject rate (say, 1%), we can determine several points where the curves intersect the horizontal line of 1%. These points are different combinations of (σ, M ) values that yield the same error rate. We may choose a smaller σ value (less conservative decision) with a larger M value (more evidence), or vice versa, to achieve a particular error rate. Generally, choosing a small M (and hence frame rate) is preferable, because it results in lower CPU overhead. We also performed an imposter test in which each of the four users took turns to impersonate the other three. The captured images were subject to the same analysis as before. Figure 6 shows the false accept rate (= number of accepts / 1200) curves for a few σ values. These curves are the average of the 12 impersonation curves. Note that all errors are below 1%, indicating that our Bayes’ classifier is almost always correctly rejecting the imposter, even based on a single verification. As before, curves for smaller σ values upper-bound those for larger values, and for M sufficiently large, the false accept rate drops to zero. Another useful performance metric for the verifier is the Receiver-Operator Characteristic (ROC) curve, shown in Figure 7. This plots the correct verification rate (verifier accuracy) versus the false accept rate. Each ROC curve is generated by varying σ. Different ROC curves are for different values of M . In Figure 7, we show four curves corresponding to M = 5, 16, 21, 50. Since the area under the
False reject rate
1. Generally the false reject rate decreases as M is increased. This is expected because using more sample points for verification increases reliability.
25% σ = 0.1 σ = 0.5 σ = 0.9
20% 15% 10% 5% 0% 1
3 5 7 9 11 13 15 17 19 Number of sample points (M)
Figure 5: False reject rate versus number of samples. Curves are generally descreasing monotonically in M . Beyond M = 50, the rate is almost 0. See text for details. ROC curve is a measure of the “power” of the verifier, it is clear that larger M values result in better classifiers. 1.4% False accept rate
(2) and (3) for different values of M (the number of sample points in the combined verification). This was repeated for σ varying from 0.1 to 0.9 in steps of 0.1. Figure 5 shows a few of these curves (averaged over the four users). A number of observations may be made:
σ = 0.1 σ = 0.5 σ = 0.9
1.2% 1.0% 0.8% 0.6% 0.4% 0.2% 0.0%
1 2 3 4 5 6 7 8 9 10 11 12 Number of sample points (M)
Figure 6: False accept rate versus number of samples. Note that the vertical axis is below 1%. If plotted in the same scale as Figure 5, this error would essentially be 0. Also, for M > 23, the error is 0. See text for details.
5.1. Tradeoff among various metrics From a security consideration, if the time needed to subvert a computer system is t seconds, then we want to react within t seconds when an authorized user is replaced by an imposter. If we want a decision accuracy to be a (defined as the probability of correct classification with the last t seconds worth of samples), then Figure 5 (which plots 1 − a versus number of sample points) can yield the number of samples that we need for that accuracy. Let that number be M .4 Because we need to ensure that we have M samples in t seconds, the frame rate for image capture is f ≥ M/t. However, this defines a lower bound on the overhead needed to realize the accuracy because CPU overhead is 4 There could be multiple values of M , due to the trade-off as discussed in observation #4.
1 0.9 M=5 M=16 M=21 M=50
Correct verification rate
0.8 0.7 0.6 0.5 0.4 0.3 0.2 0.1 0 0
0.1
0.2
0.3
0.4
0.5
0.6
False accept rate
0.7
0.8
0.9
1
Figure 7: ROC curves for M=5,16,21,50
Security/Usability
expected to be directly proportional to frame rate, (for our operating environment it is 10 · f %). If we consider one metric of usability to be the correct classification of a valid user (i.e., minimal false reject rate), then we can say that usability is positively correlated to overhead. Similarly, if we consider one metric of security to be the false accept rate (of an imposter), then for our data set (essentially very small error, mostly independent of number of samples [Figure 6]) we see that the overhead is limited from above (upper bound) to one frame capture every t seconds, or to about 10%/t. Figure 8 depicts qualitatively the metrics of security and usability of the system as a function of CPU overhead. It also hints at the sweet operating spot of the system which is the point at which neither curve yields an appreciable payoff for an increased investment of CPU. 50 45 40 35 30 25 20 15 10 5 0
usability .5sec+.5usability security
0
20
40 60 CPU Overhead
80
100
Figure 8: Security/Usability as a function of CPU The top line plots usability (as described above) as a function of CPU overhead, while the bottom line corresponds to security as a function of CPU overhead. The curves qualitatively represent the σ = .9 lines in Figures 5 and 6. The middle curve represents a combination of the
two curves and for illustration we choose a linear combination that weights security and usability equally. From the curve one might infer (although this is subjective) that a good operating point of operation of the system is at CPU = 40% because the system offers dimishing returns beyond it. Because erring on the safe side permits misclassification in the form of false rejects, safety is easily achieved for high σ. The increase in security with an increase in samples is therefore small. However, usability can be significantly improved by increasing the number of samples in decision making because that improves the discriminating power of the classifier and reduces false rejects. In other words, a safe system can be had for low CPU overhead but it’s unlikely to be very usable. To get a safe and usable system, one needs to expend CPU which means that only a fraction of the total CPU is available for useful work.
6. Related Work Checking continual presence of a user before letting processes continue execution is similar in concept to hardware based software piracy protection, e.g., HASP [Sof]. In hardware-based software piracy protection, the protected software effectively ensures the physical presence of a hardware device by using it as a decryption device for data used within the running program. Face verification is passive (a desirable property) and the system (not the application) effectively ensures the presence of the face (hardware device) before letting processes continue. Klosterman and Ganger [KG00] describe the architecture of a continuous verification system and is the closest work to ours. However, their system does not consider adaptation under increased system load and is not reactive in the general way that our system is. Altinok and Turk [AT03] propose a scheme to integrate confidence values (scores) not only for different biometric modalities (face + voice + fingerprint) but also for the same modality over time. They treat each score S as a Gaussian random variable, with mean S and standard deviation σ. Their scheme increases σ over time, thereby increasing the uncertainty of the score. The assumption is that all past scores are necessary to determine the overall score at a given instant in time, even when there is no actual output by any biometric. By contrast, our assumption is that from a security standpoint, historical evidence of the user should not influence future evidence, because the authorized user can be taken over by an impostor at any point in time. In other words, in order to err on the side of security we cannot assume that if a user has been sitting at a computer for two hours, he will be sitting for the next five minutes as well. Therefore we do not integrate evidence (scores) temporally, but treat each verification instance as independent. Another difference is
that Turk et. al did not integrate the verification decision into the operating system. They ran verification tests on virtual users by combining separate datasets containing faces, voices, and fingerprints.
[Den87]
Dorothy E. Denning. An Intrusion-Detection Model. IEEE Transactions on Software Engineering, 13(2), February 1987.
[DHS00]
R. Duda, P. Hart, and D. Stork. Pattern Classification, 2nd edition. John Wiley and Sons, 2000.
[KG00]
Andrew J. Klosterman and Gregory R. Ganger. Secure Continuous Biometric-Enhanced Authentication. Technical Report CMU-CS-00134, Carnegie Mellon University, May 2000.
[Kum95]
Sandeep Kumar. Classification and Detection of Computer Intrusions. PhD thesis, Purdue University, Department of Computer Sciences, 1995.
[Lov03]
Robert Love. SAMS, 2003.
[Mor]
Andrew G. Morgan. The Linux-PAM System Administrators’ Guide. Documentation distributed with Linux-PAM. Available at http://www.kernel.org/pub/linux/libs/pam/pre/library/.
[MS96]
Larry McVoy and Carl Staelin. lmbench: Portable Tools for Performance Analysis. USENIX 1996 Annual Technical Conference, January 1996.
[Pfl96]
Charles P. Pfleeger. Security in Computing. Prentice Hall, 2nd edition, 1996.
[Sof]
Aladdin Software. HASP: Software Protection — The Needs, the Solutions, and the Rewards. Available at http://www.ealaddin.com/hasp/whitepapers.asp.
7. Conclusions and Future Work When we started this project, we were primarily concerned with the feasibility of doing face verification at the persecond granularity. Results from Klosterman [KG00] did not seem very encouraging but the results were old and we believed that both processor speed and face detection techniques had improved considerably in the interim to warrant another look. We are happily pleased with our results and we believe that a reactive system can be built around face verification. The Linux kernel changes needed to preempt running processes are minimal and localized. Our optimizations have shown that even 25 fps is possible on a modern Pentium (2.4GHz with 512MB RAM) with “face tracking”. Our next task is to study the usability of the system in a public setting. We plan to make the system more robust and deploy it where students can use them for their daily tasks. We hope to better investigate the tradeoffs between security, usability, and computational overhead. We have many ideas to make recognition more robust when a full frontal face of the user cannot be captured for e.g., switching to verifiying shirt color. We believe that little tricks like these can go a long way towards making the system usable without compromising on security.
Appendix The FLD Wopt is computed as [DHS00]:
Wopt = arg max W
|WT SB W| |WT SW W|
Linux Kernel Development.
[SSMB00] T. Sim, R. Sukthankar, M. Mullin, and S. Baluja. Memory-based Face Recognition for Visitor Identification. In Proceedings of the IEEE International Conference on Automatic Face and Gesture Recognition, 2000.
where SW and SB are the between-class and within-class scatter matrices, respectively. The analytic solution may be shown to be: Wopt = S−1 W (m1 − m2 ).
[The]
The Linux Kernel Archives. http://www.kernel.org/.
References
[VJ02]
Paul Viola and Michael Jones. Robust real-time object detection. International Journal of Computer Vision, 2002.
[AT03]
Alphan Altinok and Matthew Turk. Temporal Integration for Continuous Multimodal Biometrics. Proceedings of the Workshop on Multimodal User Authentication, December 2003.
[Cro]
Neal Crook. The kdm Handbook. Available at http://docs.kde.org/en/3.1/kdebase/kdm/.