Color profile: Generic CMYK printer profile Composite Default screen
1871
PERSPECTIVES
Using demographic methods to construct Bayesian priors for the intrinsic rate of increase in the Schaefer model and implications for stock rebuilding M.K. McAllister, E.K. Pikitch, and E.A. Babcock
Abstract: Even though Bayesian methods can provide statistically rigorous assessments of the biological status of fisheries resources, uninformative data (e.g., declining catch rate series with little variation in fishing effort) can produce highly imprecise parameter estimates. This can be counteracted with the use of informative Bayesian prior distributions (priors) for model parameters. We develop priors for the intrinsic rate of increase (r) in the Schaefer surplus production model using demographic methods and illustrate the utility of this with an application to large coastal sharks in the Atlantic. In 1996, a U.S. stock assessment obtained a point estimate for r of 0.26. For such long-lived and low-fecund organisms, this could potentially be too high. Yet it was used to predict that within about 10 years, a 50% reduction in the 1995 catch level should result in >50% chance of increasing the population to the abundance required to produce maximum sustainable yield. In contrast, a Bayesian assessment that used demographic analysis to construct a prior for r with a median of 0.07 and coefficient of variation (CV) of 0.7 indicated that within 30 years, this policy would have only a very small chance of increasing the population to maximum sustainable yield. Résumé : Bien que les techniques bayésiennes puissent fournir des estimations statistiquement rigoureuses du statut biologique des ressources halieuthiques, des données pauvres en information (e.g., un série de taux de capture associée à un effort de pêche peu variable) peuvent produire des estimations de paramètres très imprécises. Ce problème peut être contrecarré par l’utilisation de distributions bayésiennes a priori (priors) pour les paramètres du modèle. Nous avons développé des distributions a priori pour le taux intrinsèque de croissance (r) dans le modèle de production excédentaire de Schaefer à l’aide de méthodes démographiques et nous illustrons l’utilité de cette approche en l’appliquant aux grands requins côtiers de l’Atlantique. En 1996, une évaluation de stock faite aux États-Unis a donné une estimation ponctuelle de r de 0,26. Pour des organismes à grande longévité et à faible fécondité, cette valeur est potentiellement trop élevée. Néanmoins, elle a servi à prédire que, dans à peu près 10 ans, une réduction de 50% dans le taux de capture de 1995 aurait pour conséquence une probabilité de >50% de faire croître la population suffisamment pour atteindre le niveau de rendement maximal soutenu. En revanche, une estimation de type bayésien qui a utilisé une analyse démographique pour établir une distribution a priori de r avec une médiane de 0,07 et un coefficient de variation de 0,7 indique qu’une telle politique de capture n’aurait, au bout de 30 ans, qu’une très faible probabilité de permettre à la population d’atteindre le rendement maximal soutenu. [Traduit par la Rédaction]
Perspectives
1890
Introduction Bayesian estimation has been advocated as a statistically rigorous approach to account for and reduce uncertainties arising from data analysis (Gelman et al. 1995; Punt and
Hilborn 1997; McAllister and Kirkwood 1998a). However, when these methods are used to model uncertainty, particularly in fisheries stock assessment, model predictions can still be highly imprecise and biased (Adkison and Peterman 1996). This is often because data for individual fish stocks
Received October 11, 2000. Accepted June 13, 2001. Published on the NRC Research Press Web site at http://cjfas.nrc.ca on August 30, 2001. J16014 M.K. McAllister.1 Renewable Resources Assessment Group, Department of Environmental Science and Technology, Imperial College, Royal School of Mines Building, Prince Consort Road, London, SW7 2BP, U.K. E.K. Pikitch and E.A. Babcock. Wildlife Conservation Society, 185 Street and Southern Boulevard, Bronx, NY 10460, U.S.A. 1
Corresponding author (e-mail:
[email protected]).
Can. J. Fish. Aquat. Sci. 58: 1871–1890 (2001)
J:\cjfas\cjfas58\cjfas-09\F01-114.vp Monday, August 27, 2001 2:14:25 PM
DOI: 10.1139/cjfas-58-9-1871
© 2001 NRC Canada
Color profile: Generic CMYK printer profile Composite Default screen
1872
Can. J. Fish. Aquat. Sci. Vol. 58, 2001
are uninformative about key population dynamics model parameters, for example, the maximum population growth rate, r, which can determine the rate of population recovery following severe depletion and a reduction in harvesting (Liermann and Hilborn 1997; Myers et al. 1997). Estimation uncertainty can be reduced with the application of informative Bayesian prior probability density functions (pdfs) for model parameters (McAllister et al. 1994). Hierarchical modeling methods have recently been developed to help construct these priors (Gelman et al. 1995; Liermann and Hilborn 1997). Myers et al. (1997, 1999), for example, provided a hierarchical modeling approach that was applied by Millar and Meyer (2000) to construct a prior pdf for r that incorporates stock and recruit data sets, estimates of the age at maturity, and the rate of natural mortality in adults. These methods, however, require data sets from several other similar (e.g., conspecific or congeneric) populations. In many instances, for example, for most shark populations, such data sets are not available. We formulate in this paper an alternative approach to constructing a prior for r that uses demographic methods, which do not require data from other populations (Krebs 1985; Begon et al. 1996; Ebert 1999). We illustrate this approach with an application to demographic and catch and catch rate data for large coastal sharks (LCSs) off the U.S. Atlantic coast. This paper is organized as follows. First, we formulate a demographic approach to constructing a prior distribution for r. Second, we illustrate the utility of this approach with an application to data for LCSs. Bayesian posterior estimates of stock status and potential for recovery to the maximum sustainable yield level (MSYL) are assessed with and without the informative prior for r. Using demographic analysis to construct a prior probability distribution for the intrinsic rate of increase Demographic theory provides two conceptually interrelated definitions of the intrinsic rate of natural increase (Krebs 1985, pp. 182–184). The first is the observed rate of increase per individual per unit time, ro, for a population in its natural environment. The ro varies continuously from – to + in response to changes in food availability, age distribution, and environmental conditions, among other things. The second is the innate capacity for increase, rm. This is the maximum per capita rate of increase attained under some particular set of abiotic conditions when the quantities of food, space, and animals in the population are kept to an optimum and other species are entirely excluded from the situation. In other words, this is the maximum population growth rate owing to optimal biological conditions at a given set of abiotic conditions. This quantity is often used as a reference point for comparisons with observed rates of increase in nature. Demographic theory also specifies that under constantly maintained abiotic and optimal biological conditions, a population would reach a stable age structure and increase in numbers according to the differential equation (1)
dN = rm N dt
These formulations parallel analogous ones associated with the age-aggregated logistic population dynamics model. In
this model, the intrinsic rate of increase, rL, is defined as the maximum per capita rate of increase. Thus, rL and rm are analogous, except that rL is realized without any assumptions about age structure as abundance approaches zero, when density-dependent effects that reduce the rate of population growth are assumed to be at a minimum: (2)
dN = lim rL N N®0 dt
The realized per capita rate of increase, rr , in the logistic model (eq. 17) varies with population abundance and is thereby analogous to ro in demographic theory. Therefore, it would appear that under suitable conditions (defined below), an approximation of the quantity rm with the use of demographic methods could potentially be used as an approximation of rL in the logistic model. Despite the conceptual overlap between logistic modeling and demographic analysis, the methodologies employed by each to estimate their parameters have remained separate. For example, in fisheries stock assessment, logistic models are typically fitted to abundance data to estimate rL (hereafter referred to as r), and despite the availability of demographic data, no use has been made of demographic methods to facilitate this estimation. Demographic methods to approximate rm are often overlooked in stock assessments or treated separately from the model fitting approach (Cortes 1998; Smith et al. 1998). In this paper, we illustrate the utility of demographic methods in helping to improve the accuracy of estimates of r for population modeling. Below, we review a few of the simpler demographic methods to approximate rm and then provide some guidelines for the construction of a prior for r. Demographic methods to approximate rm The simplest demographic methods for approximating ro and rm rely on estimates of “vital rates” such as fecundity at age and survival rate at age (from natural causes of death) (Krebs 1985; Begon et al. 1996). Estimates of these quantities are occasionally available for exploited populations. In such instances, demographic methods (Krebs 1985; Begon et al. 1996) can be applied to approximate rm. It is important for practitioners to note when in the population’s exploitation history the vital rates were estimated. To obtain approximations of rm, the values for survival rate and fecundity should be obtained when density-dependent processes are least likely to be operating, for example, at abundances low relative to carrying capacity. Alternatively, if estimates are available when the population is moderately exploited, then it could be assumed that the abundance was near the MSYL. The realized rate of increase, rr, of the population would then be less than the maximum possible value and would need to be increased by up to a factor of 2 if it were to be used as an approximation of r in the logistic model. If the population is heavily exploited, it is unlikely that the population’s age distribution will be stable, as required by some demographic methods. However, this should not bias demographic approximations of rm provided that they do not obtain the survival rate at age directly from the observed age distribution, as in some cohort life table methods © 2001 NRC Canada
J:\cjfas\cjfas58\cjfas-09\F01-114.vp Monday, August 27, 2001 2:14:26 PM
Color profile: Generic CMYK printer profile Composite Default screen
Perspectives
1873
(Begon et al. 1996). There are at least three simple demographic methods that could be used to approximate rm. Generation time method The simplest method derives from the following approximation (Krebs 1985; Begon et al. 1996): (3)
R » 1exp(rmG )
where R is the expected lifetime contribution of female offspring from a single female organism and G is the approximated mean generation time. The G may also be interpreted as the weighted average age of reproductive females with weighting by the expected births at age after the survival rate at age of reproductive females has been accounted for (see eq. 8). The R can be obtained by (4)
R=
A
å l xm x
ö æ A log çç å l x m x ÷÷ ø è x=0
rm @
G
The components of this equation can be obtained as follows. The lx is computed by (6)
lx =
Õ Si i= 0
m x = sg x f x
where gx is the expected proportion of individuals mature at age x and fx is the fecundity of those mature at age x. The arithmetic mean generation time, Ga , which is typically applied, is approximated by A
(8)
(9)
Ga =
N x ,0 = 1000 lx
The number of age-0 female individuals for the next time step is given by (10)
N 0, t +1 =
å xlx m x
x=0 A
å lx m x
x=0
with each age x weighted by the expected contribution of offspring at that age. Note that eq. 5 does not give the “true” value of rm. The shape of the xlxmx versus x distribution influences how close the approximation of rm from eq. 5 approaches the true value of rm. If that distribution is not normal, this method does not work well (see Ebert (1999, pp. 17–18) for a discussion). Extensive simulations using the shark data below showed that this method and extensions to
A
å m x N x,t
x=0
The number of female individuals of age x in the next step for ages 1 to A (assuming senescence at age A) is given by (11)
N x , t +1 = Sx -1N x -1, t
Trial and error is required to identify when the age structure has stabilized. This usually does not take many time steps, and stabilization can be monitored by computing the average percent change in the proportion at age between each time step: N x, t
(12)
D t = 100
x -1
where Si is the survival rate at age i and l0 is 1. The mx can be expressed as a function of the expected fecundity per individual female, sex ratio s, and the age at maturity: (7)
Leslie matrix method A second approach to approximating r projects a Leslie population matrix over several time steps until the population age structure (proportion at age) has stabilized (Krebs 1985). The intrinsic rate of increase can then be computed from the ratio of abundance between one time step and the previous. The initial vector of female numbers at age can be initialized by
x=0
where A is the maximum possible age of a female, lx is the expected survivorship of females from age 0 to age x, and mx is the expected number of age-0 female offspring per individual female or fecundity at age x. The rm can thus be obtained by dividing the natural logarithm of the expected lifetime contribution of female offspring from a single female organism, R, by the mean generation time:
(5)
it (e.g., using the geometric and harmonic means instead of the arithmetic mean) were highly inaccurate and that the other two methods below should be used instead.
A
å
1 A x=0
Pt
-
N x, t - 1
Pt - 1 N x, t - 1 Pt - 1
where (13)
Pt =
A
å N x,t
x=0
When this average percentage becomes very small, say 0, w > 0, mean = v/(v + w), and variance = vw/[(v + w)2(v + w + 1)]), and normal(m, s2) truncated below 0 and above 1 (where m is the median and s is the standard deviation in the natural logarithm of the random variable) (Evans et al. 1993). A beta distribution for Sx is particularly convenient because this distribution falls between 0 and 1 and can take on a wide variety of shapes. A normal distribution truncated below 0 or a lognormal distribution for the rate of natural mortality at age, Mx, could also be appropriate whereby the median for Mx and the standard deviations in Mx or the natural logarithm of Mx, sx, are obtained empirically, if possible. If no empirical estimate for sx is available, then the value for this parameter could be set subjectively. For example, the minimum and maximum plausible values for Mx can be used to set the value for sx by associating these extremes with potential 95% confidence intervals for a lognormally distributed Mx. In Monte Carlo simulations, Sx can then be obtained by transforming the random variable Mx: (16)
Sx = exp(-M x )
If the sensitivity of prior distributions for r to input distributions for Mx is to be evaluated, we recommend that at a minimum, variants to the baseline distribution for Mx be tried in which the median and sx are varied. If it is plausible that Mx or Sx varies with age, x, then priors for r should be constructed under this assumption. © 2001 NRC Canada
J:\cjfas\cjfas58\cjfas-09\F01-114.vp Monday, August 27, 2001 2:14:27 PM
Color profile: Generic CMYK printer profile Composite Default screen
Perspectives
Estimating r for population models in numbers versus biomass of individuals The demographic methods that we describe are based on abundance in numbers as opposed to biomass. However, in many instances, the Schaefer equation models biomass, not numbers. How then can we obtain a prior for r using demographic methods? The answer is by applying the same methods. Appendix A proves that r is the same whether the modeling is in biomass or numbers, providing that weight at age remains constant from one generation to the next. Estimating r for models of mature or exploited population abundance The demographic methods to compute rm are based on all age groupings (eqs. 3–15). In contrast, Schaefer models when applied in fisheries stock assessment apply to the ageand (or) size-classes vulnerable to fishing mortality. Appendix B proves that the value for rm obtained by the demographic methods is independent of the age-classes included and modeled in the quantity Pt. Therefore, demographic methods for computing rm are independent of the age or pattern of recruitment to the population modeled by the logistic model. However, the demographic methods applied will still need to include all of the possible age-classes. Dealing with negative values of rm If there is considerable uncertainty over the survivorship and fecundity schedules, it is likely that some of the permutations of the combined fecundity and survivorship schedules that can be obtained from their respective distributions will result in negative values for rm. However, it is highly unlikely for the intrinsic rate of increase in the logistic model to be equal to or less than zero, unless, for reasons other than exploitation, the population is destined for extinction. It could be argued that very small nonnegative values (e.g., r < 0.01) are also highly unlikely. This accounts for step 4 in the Monte Carlo procedure described above. Illustrating the integration of demographic methods with Schaefer model assessments Below, we illustrate the utility of integrating demographic methods in stock assessment using the Schaefer model with an application to data for large coastal sharks (LCSs) on the U.S. east coast. In 1996, the U.S. National Marine Fisheries Service (NMFS) held a Shark Evaluation Workshop (SEW) to evaluate the status of LCSs off of the east coast of the United States and recommend harvesting policies for this species grouping. The report of the workshop concluded that the LCS grouping was heavily depleted and suggested that at least a 50% cut in the catch of LCSs was required to promote population recovery. In 1997, the NMFS implemented a 50% cut in the total allowable catch (TAC) for commercial fishermen (Anonymous 1997). The recreational bag limit for Atlantic sharks was reduced to two fish per boat trip. Below, we describe how we carried out each of the five steps for Bayesian stock assessment (from McAllister and Kirkwood 1998a). The data for LCSs combined are used here instead of those for single species to make the results comparable with those obtained in the 1996 SEW. Step 1 is to identify the alternative management procedures to evaluate. As in the 1996 SEW, we evaluated con-
1875
stant quota policies that were varying fractions of the 1995 total reported catch of LCSs (367 200 fish). The fractions varied from 100% to 90,..., 10, and 0%. These same policies were also evaluated in the 1996 SEW. Step 2 is to identify the indices of policy performance. The indices used to evaluate policy performance include the following: (a) the posterior expected value for the ratio of stock abundance to carrying capacity (E(Nfin/K)) in the years 2008, 2018, and 2028, (b) the probabilities that stock size in these three years will be larger than the stock size in 1998 (P(Nfin > N98)), (c) the probability that the stock size in each of these years will be larger than 0.5K, the MSY stock level (P(Nfin > 0.5K)), and (d) the probability that stock size will be below 0.2K in these years (P(Nfin < 0.2K)). Steps 3 and 4 are to identify alternative hypotheses and evaluate the weight of evidence in their support. A key input to a decision analysis is the joint posterior probability distribution for the alternative hypotheses, e.g., alternative values for the estimated population model parameters. In this section, we describe the population dynamics model, the data, the likelihood function, the prior probability distributions, and the method to produce marginal posterior distributions for quantities of interest. Population dynamics model and alternative hypotheses The surplus production model that we applied, the same as in NMFS (1996), is in numbers rather than biomass and is detailed in Prager (1994). The surplus production function with fishing mortality included is given by (17)
dN t r = (r - Ft )N t - N t2 dt K
where t is the year, N is stock abundance, r is the intrinsic rate of increase, K is the carrying capacity, and F is the instantaneous fishing mortality rate. Dividing eq. 17 by Nt gives the realized rate of increase, rr. The maximum harvest rate possible was assumed to be 0.99. Abundance is updated annually by N t +1 =
a tNt exp(a t) when a t ¹ 0 a t + b Nt (exp(a t) - 1)
N t +1 =
Nt when a t = 0 1 + b Nt
(18)
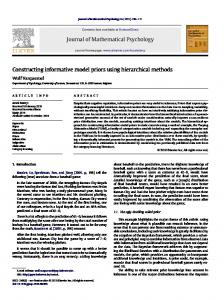
where a t = r – F and b = r/K. The most cumbersome aspect of this version of the Schaefer model is that Ft can only be solved numerically (Prager 1994). Prager (1994, p. 376) provided two different equations in which Ft is on both sides of the equation for when at ¹ 0 and at = 0. A starting guess was provided for Ft (the harvest rate Ct/Nt) and this was entered into the right-hand side of the equation. The resulting Ft was then computed. This latter Ft was input into the equation and this process was iterated until the difference between the inputted and outputted Ft was very small (99.99% (Fig. 2). However, the approximations provided by the Lotka method were consistently about 5% larger than estimates from the Leslie matrix method (Table 1). The SDs in estimates from the Lotka method were also consistently about 5% larger. The reasons for these discrepancies are not clear but could result because the Lotka method applied is a discrete approximation of an integral over the ages from 0 to ¥, while the Leslie method is more of an exact numerical approximation that directly simulates the rate of population increase (Lotka 1907). The shape of the distribution for rm was relatively insensitive to the precise functional form of the input distribution assumed for Sx (Fig. 3), provided that the input distribution for Sx had a similar central tendency and spread. The uniform distribution for Sx over 0.8, 1.0 produced the broadest distribution for rm with the sharpest cutoff points (median rm (rm50) = 0.09, SD(rm) = 0.047; from the Leslie method) (Fig. 3a; Table 1). When the parabolic and triangular distributions for Sx were applied, which had less spread than the uniform distri-
bution for Sx, the distribution for rm had more gradual tails (for both, rm50 = 0.07 and SD(rm) = 0.038) (Table 1). The priors based on the beta distributions for Sx tended to be skewed slightly to the right, and the spread of the distribution for rm depended strongly on the parameterization of the beta distribution (Fig. 3b). For Sx ~ beta(18, 2), rm50 = 0.09 and SD(rm) = 0.043 and for Sx ~ beta(54, 6), rm50 = 0.07 and SD(rm) = 0.033 (Table 1). The two lognormal distributions for Mx, were parameterized to give distributions for Sx similar in shape to those for the two beta distributions and therefore gave distributions for rm similar to those for the beta distributions for Sx (Figs. 3b and 3c; Table 1). A lognormal prior distribution for rm that incorporates a median of 0.07 and lognormal SD of 0.5 tends to weight the smaller values for rm more heavily and has a more gradually tapering upper tail than all of the distributions derived from the Monte Carlo exercise (Fig. 3). Similar biases in the distributions produced by the different methods to calculate rm were observed when the input distributions for blacktip sharks were applied (Fig. 3d; Table 1). The Lotka method gave slightly higher values for rm than the Leslie method (Table 1). The prior distribution produced for blacktip sharks had a higher central tendency (rm50 = 0.125, SD(rm) = 0.059) than the one produced for sandbar sharks, mainly because the age at maturity was much lower for blacktips (Fig. 3e; Table 1). A prior for r in the logistic model for LCSs that gives less productive species more weight but has a larger SD to account for the vari© 2001 NRC Canada
J:\cjfas\cjfas58\cjfas-09\F01-114.vp Monday, August 27, 2001 2:14:30 PM
Color profile: Generic CMYK printer profile Composite Default screen
Perspectives
1879
Table 1. Description of priors for r resulting from different input distributions for survival rate at age. Shark species
Distribution 2
Sandbar
M ~ lognormal(0.105, 0.7 )
Blacktip
M ~ lognormal(0.105, 0.42) S ~ beta(18, 2) S ~ beta(54, 6) S ~ U(0.8, 1) S ~ triangular(0.8, 0.9, 1) S ~ parabolic(0.8, 0.85, 0.95, 1) M0 ~ lognormal(0.693, 0.72)
Method
rm50
rm
SD(rm)
CV(rm)
sr
Leslie Lotka Leslie Leslie Leslie Leslie Leslie Leslie
0.085 0.089 0.071 0.089 0.073 0.090 0.070 0.074
0.083 0.088 0.070 0.090 0.074 0.089 0.074 0.075
0.038 0.040 0.032 0.043 0.033 0.047 0.038 0.038
0.46 0.46 0.45 0.48 0.45 0.53 0.51 0.51
0.43 0.44 0.43 0.46 0.43 0.49 0.48 0.48
Leslie/Lotka
0.125
0.137
0.059
0.32
0.32
M1 + ~ lognormal(0.105, 0.72) Note: rm50, median rm; rm, mean rm; SD(rm), standard deviation for rm; CV(rm), coefficient of variation in rm; s r lognormal standard deviation for rm.
Fig. 2. Prior pdfs for r for sandbar sharks produced using the Leslie matrix (dashed line) and Lotka (solid line) methods. The age at maturity was assumed to be uniformly distributed between 14 and 17 years, the maximum age was 100, fecundity at age was normal(2.1, 0.632), and Mx was lognormal(0.105, 0.72) (baseline and used in subsequent figures). (a) Distributions without any truncation below the value of 0.01; (b) distributions with truncation below the value of 0.01.
ability in r among species in this grouping is given by a lognormal distribution with a median of 0.07 and a lognormal SD of 0.7 (Fig. 3e). Posterior distributions for logistic model parameters A joint posterior pdf for r and K in the logistic model from a noninformative (uniform) prior for r is shown in Fig. 4a. This demonstrates that there is relatively little information about r and K in the data, which is consistent with a “one-way trip” (Fig. 4c). A long narrow ridge of higher probability runs from high values for r and low values for K to lower values for r and higher values for K. Along this ridge, many different combinations of values for r and K result in model predictions that correspond almost equally well to the CPUE data. However, because the ridge of higher probability is relatively narrow and runs diagonally across the joint region for r and K, it can be seen that if the value for r were known, the estimate of K would be considerably more precise and vice versa. Using noninformative priors and assumptions similar to those in the 1996 assessment, we were, however, unable to obtain estimates of r anywhere close to that obtained in NMFS (1996) (0.26). For example, our posterior mean with a noninformative prior on r was 0.7 with an SD of about 0.2 (Table 2). Although the posterior CVs for most quantities were similar when an informative prior for r was used (Table 2), the posterior SDs were larger for most quantities when the uniform prior was applied. Curiously, the posterior CV for MSY was only 5% with the uniform on r prior compared with 44% in the baseline case. This resulted because the posterior correlation between r and K was –1 with a uniform prior on r and –0.59 with an informative prior. The use of an informative prior for r rather than a noninformative prior thus produces marginal posteriors that are not necessarily more informative about model quantities (Table 2; Figs. 4b and 5). The most noteworthy difference is in the central tendencies of the marginal posteriors. Under the baseline case with the informative prior for r, the posterior CV for r (62%) is only slightly smaller than the prior CV (80%), also indicating that the data are not informative for the parameter r (Fig. 5b). The posterior expected value for catch (309 000 fish, CV = 44%) for the years 1975–1980 (E(Co)) was less than the prior expected value (477 000 fish), indicating that the data suggest a smaller value for this quantity (Fig. 5c). Despite the broad posteriors © 2001 NRC Canada
J:\cjfas\cjfas58\cjfas-09\F01-114.vp Monday, August 27, 2001 2:14:31 PM
Color profile: Generic CMYK printer profile Composite Default screen
1880
Can. J. Fish. Aquat. Sci. Vol. 58, 2001
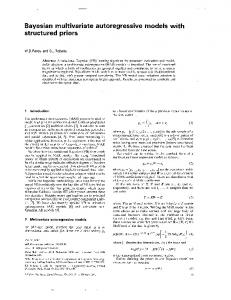
Fig. 3. Histograms of rm for sandbar sharks produced by using distribution for (a) Sx ~ uniform(0.8, 1.0), Sx ~ triangular(0.8, 0.9, 1.0), and Sx ~ parabolic in the tails with the minimum and maximum values at 0.8 and 1.0, respectively, and with Sx uniform between 0.85 and 0.95, (b) Sx ~ beta(18, 2) and Sx ~ beta(54, 6), and (c) Mx that was lognormal(0.105, 0.42) and Mx that was lognormal(0.105, 0.72); a parametric prior distribution for r that is lognormal(0.07, 0.52) is also given in Figs. 3a–3c; (d) histograms for rm for blacktip (BT) sharks from the Leslie projection and Lotka methods; (e) prior for r for blacktip sharks from the Leslie method, priors for r for blacktip and sandbar (SB) sharks, both produced by fitting a lognormal distribution to the Monte Carlo results, and a prior for r for LCSs that gives less productive species more weight but has a larger SD to account for the variability in r among species in this grouping.
© 2001 NRC Canada
J:\cjfas\cjfas58\cjfas-09\F01-114.vp Monday, August 27, 2001 2:14:32 PM
Color profile: Generic CMYK printer profile Composite Default screen
Perspectives
1881
Fig. 4. (a) Joint log likelihood profile for r and K in the logistic model; (b) joint posterior distribution for parameters r and K using the baseline priors: prior median for r = 0.07, p(K) µ 1/K, prior mean(Co) = 477 000 fish, prior SD[log Co] = 0.52, prior mean(N75/K) = 1, and prior SD[log(N75/K)] = 0.2; (c) plots of the 13 CPUE series (rescaled to abundance in the baseline assessment) (symbols) and the modal posterior trend in abundance (line).
in model parameters, the data suggest a strong decreasing trend in abundance since the mid-1970s (Fig. 6). The marginal posterior distribution for abundance in 1998 is markedly lower than that for abundance in 1975 with very little overlap between these distributions (Fig. 5d). Sensitivity of results to alternative priors In Bayesian stock assessment, it is common to evaluate the sensitivity of results to alternative prior distributions for model input parameters. When the prior median value for r
was increased to 0.11 and 0.20, E(r) also increased, E(K) decreased, and E(N98/K) and E(MSY) increased (Table 2; Fig. 7). The posterior CV for r remained the same. E(MSY) was particularly sensitive to the prior for r. When the prior median for r was increased from 0.07 to 0.11 and 0.20, E(MSY) increased from 157 000 (CV = 0.44) to 205 000 (CV = 0.39) and 284 000 fish (CV = 0.30). Decision analysis results Using a uniform prior for r provided very optimistic pre© 2001 NRC Canada
J:\cjfas\cjfas58\cjfas-09\F01-114.vp Monday, August 27, 2001 2:14:34 PM
Color profile: Generic CMYK printer profile Composite Default screen
1882
Can. J. Fish. Aquat. Sci. Vol. 58, 2001
Table 2. Posterior means and % CVs (in parentheses) for various management quantities for U.S. LCSs. Expected value Priors (all same as baseline except for these changes)
K
r
Uniform prior for r Baseline (median r = 0.07, etc.) Median r = 0.11 Median r = 0.20 (mean = 0.26)
2 868 (24) 10 226 (21) 9 142 (23) 7 339 (30)
0.69 0.07 0.10 0.19
Co (28) (62) (62) (62)
224 309 295 268
(33) (44) (44) (46)
MSY
N98
462 157 205 284
1274 2964 2804 2511
(5) (44) (39) (30)
N98/K (27) (32) (34) (36)
0.45 0.29 0.31 0.35
(11) (29) (29) (30)
Note: Co is the mean annual catch before 1981. All runs used the CPUE data from NMFS (1996, 1997), and the 13 CPUE series were not combined. Baseline refers to the use of a prior that is lognormal(0.07, 0.72) for r, uniform on log(K), lognormal(477, 0.522) for Co, and lognormal(exp(–0.22/2), 0.22) for the ratio of N75 to K. Abundance values (i.e., K, MSY, and N98) are in thousands.
dictions of resilience to exploitation (Table 3). With a low in abundance of 37%K in 1993 and a TAC continued at the 1995 level, recovery to the MSYL was predicted by 1999. In contrast, when the baseline posterior distribution, which incorporates a prior for r based on demographic analysis, is applied in the decision analysis, TACs similar to the 1998 TAC (about 60% of the 1995 TAC) for LCSs are not sustainable. When f was maintained at the 1998 level of approximately 60% for the next 10 years, E(Nfin/K) dropped to 0.19. Only a policy in which the TAC was set to f £ 30% of the harvest in 1995 had more than a 50% chance of increasing stock size above the 1998 level (Fig. 8; Table 3). Only values for f that were 10% and smaller resulted in a larger than 50% chance of increasing stock size to larger than 0.5K after 30 years (Fig. 8). A complete elimination of fishing mortality could only result in a reasonable chance of stock recovery after 20 years (Table 3; Fig. 8). Increasing the prior median value for r markedly increased the chance of recovery for the harvesting options considered. For example, with the prior median for r set to 0.11, values for f £ 40% had more than a 50% chance of increasing stock size over the 1998 level after 30 years (Table 3). With the prior median for r set to 0.20, values for f £ 60% had more than a 50% chance of increasing stock size above the 1998 level after 30 years (Table 3).
Discussion Much of the published work on Bayesian stock assessment applies age-structured models that incorporate detailed age-structured data and information (McAllister and Ianelli 1997; Punt and Hilborn 1997; Patterson 1999). However, more highly aggregated models, such as a surplus production model, can often be suitable when less detailed data are available. But even for these latter models, priors are still required and relatively little attention has been given to this. Hoenig et al. (1994) provided an empirical Bayes method for constructing a prior distribution for parameters of an equilibrium surplus production model using data from several subpopulations. However, for a variety of reasons, equilibrium models are often inappropriate (Hilborn and Walters 1992). Kinas (1996) applied adaptive importance sampling, a method for Bayesian integration, to estimate the parameters in a nonequilibrium Schaefer model for orange roughy (Hoplostethus atlanticus). Because the application was primarily to illustrate methods of Bayesian integration, little attention was given to the construction of priors, e.g., for the intrinsic rate of increase. Unlike the current study, the
optimal harvest decision was the same for diffuse and informative priors. McAllister and Kirkwood (1998a) also exemplified a framework for Bayesian stock assessment using a nonequilibrium Schaefer model. Using catch and CPUE data for cape hake (Merluccius capensis), they demonstrated that CPUE data could only be informative about r if the CPUE data showed a decreasing trend followed by an increasing trend in response to a reduction in fishing effort. McAllister and Kirkwood (1998b) also applied a nonequilibrium Schaefer model to evaluate alternative management procedures for newly developing fisheries. They demonstrated that risks of overdepletion could increase if priors for uncertain model parameters were specified too precisely (e.g., prior CV < 0.5). Meyer and Millar (1999) exemplified useful and readily accessible software for Bayesian data analysis, BUGS, with a Schaefer surplus production model. A state–space modeling framework is advocated that provides a conceptually and operationally straightforward way to deal with model process error and observation error within a single unified analytical framework. A Markov chain Monte Carlo method is used for numerical integration in contrast with the sampling/importance resampling approach in this paper. Each alternative integration approach has its conveniences (McAllister and Ianelli 1997), and at least for fairly simple stock assessment problems such as the one in this paper, the choice is a matter of personal preference. While the latter four works above give scarce attention to the construction of prior distributions for Schaefer model parameters, they could potentially use the methods for this presented in this paper. Linking demographic methods with parameter estimation for Schaefer models In this paper, we apply Bayesian methods to link demographic analysis with the fitting of surplus production models to time series data to improve the empirical basis for parameter estimation. The theoretical basis for this link was presented first. Here, we summarized three simple approaches to approximating rm from the same age-structured information, the mean generation time, Leslie matrix, and Lotka methods. We showed that rm in demographic analysis is independent of whether the population is modeled in biomass or numbers and that rm is independent of the age-classes that make up the modeled population. We also showed that owing to conceptual similarities, the rm calculated using demographic methods can be exchangeable with r in surplus production models in numbers and biomass and is independent of the part of the population modeled. We presented a Monte Carlo approach to constructing a © 2001 NRC Canada
J:\cjfas\cjfas58\cjfas-09\F01-114.vp Monday, August 27, 2001 2:14:35 PM
Color profile: Generic CMYK printer profile Composite Default screen
Perspectives
1883
Fig. 5. Baseline marginal posteriors for (a) K, (b) r, and (c) Co. The prior is the dashed line and the posterior is the solid line. Baseline marginal posteriors for (d) abundance in 1975 (dashed line) and 1998 (solid line), (e) N98/K, and (f) MSY.
prior distribution for r in the logistic model from demographic analysis and some alternative methods to account for uncertainty in inputs to demographic analysis such as survival rate at age. The application to LCSs illustrates how age-structured demographic information can be integrated into the estimation of parameters in the Schaefer model to increase accuracy in parameter estimates and provide biologically sensible estimates for the evaluation of stock status and alternative fishery management plans for stock rebuilding. The methods rely on estimates of natural mortality, fecundity, and the ages of maturity and senescence. Biological research to obtain these estimates is essential before demographic methods can provide useful results. The results for both sandbar and blacktip sharks supported the observation in textbooks that the Lotka and Leslie matrix methods for approximating rm give almost the same results (Krebs 1985; Begon et al. 1996). However, for both blacktip and sandbar sharks, the Lotka method gave results consistently 5% higher and with larger variance than the Leslie
method. As mentioned above, we believe that bias is more likely in the Lotka method because the Lotka method is a discrete approximation of an integral over an infinite range of ages, and the model applied assumes senescence yet allows the possibility of very high survival rates (Lotka 1907). We therefore favor the use of the Leslie method, which does not require such an approximation. Although this is computationally more intense, it takes only a minute or two on a modern desktop computer to generate a prior distribution using the Leslie method. Other methods such as eigenvalue methods (Cortes 1998; Ebert 1999; Quinn and Deriso 1999) could also be used, but it would be advisable to cross-check the results by applying other demographic methods to the same data. Additional work not reported here demonstrated that the mean generation time method for computing rm could sometimes result in very large negative biases in approximations of rm. The replacement of the arithmetic mean with the harmonic mean helped to reduce this bias, but not entirely. In © 2001 NRC Canada
J:\cjfas\cjfas58\cjfas-09\F01-114.vp Monday, August 27, 2001 2:14:36 PM
Color profile: Generic CMYK printer profile Composite Default screen
1884
Can. J. Fish. Aquat. Sci. Vol. 58, 2001 Table 3. Consequences of alternative harvesting policies to promote resource recovery. f = %C95 Baselinea 0 10 20 30 40 50 60 70 80 90 100 r50 = 0.11 0 10 20 30 40 50 60 70 80 90 100 r50 = 0.20 0 10 20 30 40 50 60 70 80 90 100
Nfin/K
P(Nfin < 0.2K)
P(Nfin > 0.5K)
P(Nfin > N98)
0.67 0.58 0.47 0.36 0.25 0.16 0.09 (0.86) 0.05 0.03 0.02 0.01 (0.72)
0.00 0.04 0.17 0.36 0.55 0.71 0.83 (0.01) 0.91 0.95 0.98 0.99 (0.01)
0.76 0.60 0.45 0.31 0.21 0.13 0.07 (0.99) 0.04 0.01 0.01 0.00 (0.99)
1.00 0.95 0.74 0.52 0.34 0.20 0.10 (0.99) 0.05 0.02 0.01 0.00 (0.99)
0.78 0.71 0.61 0.51 0.39 0.28 0.20 0.13 0.08 0.05 0.03
0.00 0.01 0.08 0.20 0.36 0.52 0.66 0.78 0.87 0.92 0.96
0.89 0.80 0.67 0.53 0.40 0.28 0.19 0.12 0.08 0.05 0.02
1.00 0.99 0.89 0.72 0.55 0.38 0.25 0.16 0.09 0.05 0.02
0.92 0.87 0.81 0.74 0.65 0.55 0.45 0.36 0.28 0.20 0.14
0.00 0.00 0.00 0.04 0.12 0.22 0.35 0.45 0.57 0.68 0.78
0.99 0.97 0.91 0.84 0.74 0.63 0.53 0.43 0.34 0.24 0.15
1.00 1.00 1.00 0.93 0.84 0.72 0.59 0.48 0.37 0.27 0.16
Note: Nfin/K, stock abundance in the final year (2028) of management as a percentage of K; P(Nfin < 0.2K), probability that stock abundance falls below 0.2K in the final year of the management horizon; P(Nfin > 0.5K), probability that stock abundance will be above 0.5K in the final year of the management horizon; P(Nfin > N98), probability that stock abundance in the final year of the management horizon will be above that in 1998; f = %C95, TAC policy option evaluated. The percent values in the last column reflect the TAC evaluated as a percentage of the total reported catch in 1995 (367 200 fish). a The values in parentheses were obtained when a uniform prior for r was used in a separate decision analysis and are included in this table to facilitate comparisons.
contrast, textbooks typically show examples in which the results provided by the Lotka and mean generation time methods give very similar results (Krebs 1985; Begon et al. 1996). We recommend that practitioners avoid use of the mean generation time method even if the harmonic instead of arithmetic mean generation time, with its smaller bias, is applied. The example also demonstrates that the probabilistic framework for logistic model parameter estimation can be used to indicate the effect of different assumptions about model input parameters on the estimates of, and uncertainties in, management quantities of interest such as MSY and the current level of stock depletion. The approach that we apply to construct a prior distribu-
tion for r is analogous to other methods that have applied Monte Carlo methods to construct prior distributions that combine empirical information and expert judgment (McAllister et al. 1994; McAllister and Ianelli 1997). However, the simple Monte Carlo approach developed in this paper is more reliant on empirical information, for example, about life history parameters, than these other Monte Carlo approaches, which, for example, rely on expert judgment for the specification of input distributions for key sources of uncertainty in acoustic and trawl survey abundance estimates. An alternative approach to these is meta-analysis with hierarchical probability models (Gelman et al. 1995; Liermann and Hilborn 1997). This approach instead assumes that the © 2001 NRC Canada
J:\cjfas\cjfas58\cjfas-09\F01-114.vp Monday, August 27, 2001 2:14:37 PM
Color profile: Generic CMYK printer profile Composite Default screen
Perspectives
1885
Fig. 6. Abundance relative to K between 1975 and 1998 (solid line) and 95% probability intervals (dashed lines).
parameter(s) of interest varies across similar populations and incorporates data from other similar populations to estimate the form of this distribution. The approach in Myers et al. (1997, 1999) has been applied to construct a prior distribution for rm for albacore (Thunnus alalunga) using stock– recruit data from 12 other tuna populations (Millar and Meyer 2000). However, hierarchical meta-analysis is the most data-intensive method for developing priors and, as with sharks, the data required are often not available. Where both stock–recruit data from other populations and demographic data for the population of interest are available, hierarchical meta-analysis and the demographic method in this paper could both be applied to construct alternative prior distributions for r, and the sensitivity of decision analysis results to these alternative priors could be communicated to decision makers. Another option is to apply meta-analysis to abundance data from taxonomically similar very heavily fished populations where exploitation has been stopped and to approximate a pdf for r from the rebounds in observed abundance (Best 1993). Comparisons between Bayesian and non-Bayesian results The Bayesian assessment results on the status of LCSs are far less optimistic than those in a recent non-Bayesian assessment (NMFS 1996) that used the same surplus production model and catch and CPUE data (we note that for the 1998 assessment, the NMFS adopted the approach presented in this paper (NMFS 1998)). The Bayesian estimate of the historic decline in abundance is not dissimilar from that in the 1996 SEW. For example, the 1996 SEW indicated that LCS abundance had declined about 50–75% between the 1970s and 1996. The baseline analysis indicates that abundance appears to have declined about 55–80% over the same time period. This similarity is not surprising, since the same model was fitted to the same CPUE data.
A major difference is in the estimate of r in the Prager (1994) production model. The non-Bayesian analysis in NMFS (1996) provided a production model estimate of r of 0.26. This estimate ignored “prior” information about rm and estimated r by fitting the Prager model to a composite index based on the 1981–1995 CPUE data. Our attempt to replicate this assessment using the same Prager model and catch and CPUE data produced an estimate of 0.7. Close analysis of detailed model output in NMFS (1996) indicates that there may have been a failure in numerical convergence. In contrast, Bayesian demographic methods produced a posterior median estimate of r of 0.07, a value consistent with demographic data on LCSs. This latter estimate of r is preferable because it accounts for life history information that the NMFS (1996) estimate leaves out. This estimate is also consistent with estimates of ro for marine animals with similar reproductive life history characteristics (e.g., baleen whales (Best 1993)). Moreover, the CPUE data are not informative for r and, as also indicated by the very high estimate of 0.7, cannot be relied on by themselves to provide an accurate estimate of r. It is thus important for stock assessments that use a Schaefer model to incorporate prior information on r, particularly when the time series data are noninformative with respect to r. As in the current example, time series data are uninformative often because they show a classic one-way trip (Hilborn and Walters 1992): taken together, the relative abundance data to which the production model is fitted conform only to a decreasing pattern over time. This is common in many fisheries, especially developing ones and heavily exploited ones (McAllister and Kirkwood 1998b). In order for relative abundance data to be informative about r, they must show at least one decreasing and one increasing pattern over time resulting from varying levels of exploitation intensity (Hilborn and Walters 1992; McAllister and Kirkwood © 2001 NRC Canada
J:\cjfas\cjfas58\cjfas-09\F01-114.vp Monday, August 27, 2001 2:14:37 PM
Color profile: Generic CMYK printer profile Composite Default screen
1886
Can. J. Fish. Aquat. Sci. Vol. 58, 2001
Fig. 7. Marginal posteriors for (a) K, (b) r, (c) N98/K, and (d) MSY when the prior median for r was changed from 0.07 (solid line) to 0.11 (long-dashed line) and 0.20 (short-dashed line).
1998a). If they do not, then the resulting point estimate of r can be highly imprecise and possibly strongly biased, as in the present example. The joint posterior for r and K from a uniform prior for r shows that there is a large set of combinations of values for these parameters that fit the data almost equally well. In such cases, a prior for r based on demographic analysis or hierarchical methods (Myers et al. 1999) can be particularly useful for providing estimates of r consistent with knowledge about the organism’s life history. From a practical point of view, the use of such prior information is important because the values assumed for r can strongly determine the ability of a population to recover, if it has been heavily depleted. For example, NMFS (1996) ap-
plied the estimate for r of 0.26 in its evaluation of alternative recovery options. As this value for r appears to be too high, it is likely that the policy projections of the 1996 SEW are too optimistic. In contrast, the inclusion of demographic information about r should provide a more biologically consistent basis with which to evaluate alternative recovery options. Bayesian estimation enabled the incorporation of other sensible assumptions about population dynamics. For example, an informative prior about the ratio of stock size in 1975 to carrying capacity was incorporated based on the information that fishing for sharks only started to pick up in the mid-1970s (J. Musick, Virginia Institute of Marine Science, © 2001 NRC Canada
J:\cjfas\cjfas58\cjfas-09\F01-114.vp Monday, August 27, 2001 2:14:38 PM
Color profile: Generic CMYK printer profile Composite Default screen
Perspectives
1887
Fig. 8. Median values (thick line) and 90% probability intervals (thin lines) for stock size divided by K with alternative values for the TAC after 1998. The panels show the results under alternative constant TAC policies for fractions of the 1995 reported catch ranging from 0.0 to 0.7 of 367 200 fish. Results were produced with the baseline Bayesian assessment (e.g., prior median for r = 0.07).
© 2001 NRC Canada
J:\cjfas\cjfas58\cjfas-09\F01-114.vp Monday, August 27, 2001 2:14:39 PM
Color profile: Generic CMYK printer profile Composite Default screen
1888
College of William and Mary, School of Marine Science, Gloucester Point, VA 23062, U.S.A., personal communication). In order to account for the missing catch data between 1975 and 1980 and fit the model also to the CPUE data in these years, we also incorporated an informative prior for the mean catch between 1975 and 1980 based on the mean catches between 1981 and 1995. As with other recent articles on Bayesian stock assessment (McAllister and Kirkwood 1998a, 1998b; Patterson 1999), this paper also demonstrates that the use of Bayesian decision analytic methods could help fishery managers to implement a deliberately precautionary approach (FAO 1995) to fishery management. The methods can be used to account for some highly influential uncertainties in population dynamics and provide a rational and objective means to evaluate the trade-offs of decreasing harvests and increasing the chances of achieving a stock recovery.
Acknowledgments This work was made possible by a grant from the David and Lucile Packard Foundation and the Pew Charitable Trust. We thank Merry Camhi, Geoff Kirkwood, Luis Borda de Agua, Jack Musick, Gerry Scott, Joe Powers, Enric Cortes, Doug Butterworth, and Panayiota Apostolaki for helpful comments and discussions. Enric Cortes and an anonymous reviewer are thanked for their comments on the manuscript.
References Adkison, M.D., and Peterman, R.M. 1996. Results of Bayesian methods depend on details of implementation: an example of estimating salmon escapement goals. Fish. Res. 25: 155–170. Anonymous. 1997. Atlantic shark fisheries; quotas, bag limits, prohibitions, and requirements. Rules and Regulations. Federal Register. Department of Commerce. NOAA Doc. 961211348-7065-03. Begon, M., Harper, J.L., and Townsend, C.R. 1996. Ecology: individuals, populations and communities. 3rd ed. Blackwell Science, Oxford, U.K. Berger, J.O. 1985. Statistical decision theory and Bayesian analysis. 2nd ed. Springer-Verlag, New York. Best, P.B. 1993. Increase rates in severely depleted stocks of baleen whales. ICES J. Mar. Sci. 50: 169–186. Cortes, E. 1998. Demographic analysis as an aid in shark stock assessment and management. Fish. Res. 39: 199–208. Ebert, T.A. 1999. Methods in demography. Academic Press, San Diego, Calif. Evans, M., Hastings, N., and Peacock, B. 1993. Statistical distributions. 2nd ed. John Wiley & Sons, New York. Fisheries and Agriculture Organization of the United Nations (FAO). 1995. Part 1. Guidelines on the precautionary approach to capture fisheries. FAO Fish. Tech. Pap. 350/1. Fisheries and Agriculture Organization of the United Nations (FAO). 2000. The state of world fisheries and aquaculture 2000. FAO Report. FAO, Rome. Gelman, A., Carlin, J., Stern, H., and Rubin, D. 1995. Bayesian data analysis. Chapman and Hall, New York. Hilborn, R., and Walters, C.J. 1992. Quantitative fisheries stock assessment: choice, dynamics, and uncertainty. Chapman and Hall, New York. Hoenig, J.M., Warren, W.G., and Stocker, M. 1994. Bayesian and related approaches to fitting surplus production models. Can. J. Fish. Aquat. Sci. 51: 1823–1831.
Can. J. Fish. Aquat. Sci. Vol. 58, 2001 Kinas, P.G. 1996. Bayesian fishery stock assessment and decision making using adaptive importance sampling. Can. J. Fish. Aquat. Sci. 53: 414–423. Krebs, C.J. 1985. Ecology: the experimental analysis of distribution an abundance. 3rd ed. Harper and Row, New York. Liermann, M., and Hilborn, R. 1997. Depensation in fish stocks: a hierarchic Bayesian meta-analysis. Can. J. Fish. Aquat. Sci. 54: 1976–1984. Lotka, A.J. 1907. Studies on the mode of growth of material aggregates. Am. J. Sci. 24: 199–216. McAllister, M.K., and Ianelli, J.N. 1997. Bayesian stock assessment using catch-age data and the sampling/importance resampling algorithm. Can. J. Fish. Aquat. Sci. 54: 284–300. McAllister, M.K., and Kirkwood, G.P. 1998a. Bayesian stock assessment: a review and example application using the logistic model. ICES J. Mar. Sci. 55: 1031–1060. McAllister, M.K., and Kirkwood, G.P. 1998b. Using Bayesian decision analysis to help achieve a precautionary approach to managing newly developing fisheries. Can. J. Fish. Aquat. Sci. 55: 2642–2661. McAllister, M.K., Pikitch, E.K., Punt, A.E., and Hilborn, R. 1994. A Bayesian approach to stock assessment and harvest decisions using the sampling/importance resampling algorithm. Can. J. Fish. Aquat. Sci. 51: 2673–2687. Meyer, R., and Millar, R.B. 1999. BUGS in Bayesian stock assessments. Can. J. Fish. Aquat. Sci. 56: 1078–1086. Millar, R.B., and Meyer, R. 2000. Non-linear state space modeling of fisheries biomass dynamics by using Hastings–Metropolis within-Gibbs sampling. Appl. Stat. 49: 327–342. Myers, R.A., Mertz, G., and Fowlow, P.S. 1997. Maximum population growth rates and recovery times for Atlantic cod, Gadus morhua. Fish. Bull. U.S. 95: 762–772. Myers, R.A., Bowen, K.G., and Barrowman, N.J. 1999. Maximum reproductive rate of fish at low population sizes. Can. J. Fish. Aquat. Sci. 56: 2404–2419. National Marine Fisheries Service (NMFS). 1996. Report of the Shark Evaluation Workshop. National Oceanic and Atmospheric Association, NMFS, Southeast Fisheries Science Center, 75 Virginia Beach Dr., Miami, FL 33149, U.S.A. National Marine Fisheries Service (NMFS). 1997. Report of the Shark Evaluation Workshop. National Oceanic and Atmospheric Association. National Oceanic and Atmospheric Association, NMFS, Southeast Fisheries Science Center, 75 Virginia Beach Dr., Miami, FL 33149, U.S.A. National Marine Fisheries Service (NMFS). 1998. Report of the Shark Evaluation Workshop. National Oceanic and Atmospheric Association, NMFS, Southeast Fisheries Science Center, 3500 Delwood Beach Rd., Panama City, FL 32408, U.S.A. Patterson, K.R. 1999. Evaluating uncertainty in harvest control law catches using Bayesian Markov chain Monte Carlo virtual population analysis with adaptive rejection sampling and including structural uncertainty. Can. J. Fish. Aquat. Sci. 56: 208–221. Prager, M.H. 1994. A suite of extensions to a nonequilibrium surplus production model. Fish. Bull. U.S. 92: 374–389. Punt, A.E., and Hilborn, R. 1997. Fisheries stock assessment and decision analysis: the Bayesian approach. Rev. Fish Biol. Fish. 7: 35–63. Quinn, T.J., II, and Deriso, R.B. 1999. Quantitative fish dynamics. Oxford University Press, New York. Rubin, D.B. 1988. Using the SIR algorithm to simulate posterior distributions. In Bayesian Statistics 3: Proceedings of the Third Valencia International Meeting, June 1–5, 1987. Edited by J.M. Bernardo, M.H. Degroot, D.V. Lindley, and A.M. Smith. Clarendon Press, Oxford, U.K. pp. 385–402. © 2001 NRC Canada
J:\cjfas\cjfas58\cjfas-09\F01-114.vp Monday, August 27, 2001 2:14:40 PM
Color profile: Generic CMYK printer profile Composite Default screen
Perspectives
1889
Smith, S.E., Au, D., and Shaw, C. 1998. Intrinsic rebound potentials of 26 species of Pacific sharks. Mar. Freshwater Res. 49: 663–678.
Walters, C.J., and Ludwig, D. 1994. Calculation of Bayes posterior probability distributions for key population parameters: a simplified approach. Can. J. Fish. Aquat. Sci. 51: 713–722.
Appendix A. r in numbers or biomass? This appendix proves that under the assumption of stationary weight at age, r is independent of population abundance in numbers or biomass. In a biomass dynamic model, r has the following interpretation: (A1)
Bt +1 = lim Bt exp(r) Bt ® 0
where Bt is population biomass in year t. Under such conditions and stable age structure, r can be obtained from (A2)
æB ö r = lim log çç t +1 ÷÷ Bt ® 0 è Bt ø
or
(A3)
æ A ö ç å w x , t+1N x , t+1 ÷ ç ÷ r = lim log ç x = 0A ÷ Bt ® 0 ç ÷ ç å wx, tN x, t ÷ ø è x=0
where wx,t and Nx,t are the weight and abundance at age x in year t. This proof assumes that at very low population density, the weight at age is likely to be unaffected by intraspecific competition. Therefore, the vectors of weight at age in time intervals t and t + 1 are assumed to be the same between time steps. If weight at age is constant at low population density, then the intrinsic rate of increase for a model in biomass is the same as that for a model in abundance. We demonstrate this as follows. First, the expression for r in abundance can be expressed as
(A4)
æ A ö ç å N x , t+1 ÷ ç ÷ r = lim log ç x =A0 ÷ Nt ® 0 ç ÷ N ç å x,t ÷ è x=0 ø
Since this equation holds only if the age structure is stable, the expression can be rewritten as
(A5)
A æ ö ç Ht+1 å cx ÷ ç x=0 ÷ r = lim log ç ÷ A Nt ® 0 ç H c ÷ ç tå x ÷ è x=0 ø
where cx is the proportion of individuals of age x and Htcx = Nt,x. This expression can be simplified as follows: (A6)
æ Ht+1 ö ÷ è Ht ø
r = lim log ç Nt ® 0
or (A7)
r = lim log(Q) Nt ® 0
where Q is a constant. This same result can be obtained for a model in biomass:
(A8)
æ A ö ç å w x , t+1N x , t+1 ÷ ç ÷ r = lim log ç x = 0A ÷ Bt ® 0 ç ÷ w N x , t x , t ç å ÷ è x=0 ø
and from eq. A5: © 2001 NRC Canada
J:\cjfas\cjfas58\cjfas-09\F01-114.vp Monday, August 27, 2001 2:14:40 PM
Color profile: Generic CMYK printer profile Composite Default screen
1890
(A9)
Can. J. Fish. Aquat. Sci. Vol. 58, 2001 A æ ö ç Ht+1 å w x cx ÷ ç ÷ x=0 r = lim log ç ÷ A Bt ® 0 ç H wc ÷ t x x å ç ÷ è x=0 ø
Simplifying:
æ Ht+1 ö ÷ è Ht ø
(A10) r = lim log ç B t® 0
and from eqs. A6 and A7: (A11) r = lim log(Q) B t® 0
This is precisely the same result obtained with the equations in abundance (eq. A7). Therefore, r is the same for a model in abundance or biomass. The r is directly related to somatic growth because there is often a strong relationship between individual growth rate, the age at maturity, and fecundity at age. The effect of somatic growth on r is manifested in the maturity and fecundity at age schedule. The demographic methods for computing rm thus implicitly incorporate somatic growth rates and apply equally well to Schaefer models in biomass and abundance. Application of matrix algebra to the Leslie matrix yields the same dominant eigenvalue and value for r with and without the weight at age vector, providing that this vector remains constant.
Appendix B. r for exploited or mature animals? This appendix demonstrates that r is independent of the age groupings considered in the population modeled in a Schaefer model. Using an expression for ri+ for the abundance of age i+ individuals, ri+ can be equated with
(B1)
r i+
æ A ö ç å N x , t+1 ÷ ç ÷ = lim log ç x =Ai ÷ N ti + ® 0 ç ÷ ç å N x,t ÷ è x=i ø
where 0 £ i £ A. Using Nx,t = Htcx where cx is the “stabilized” proportion of individuals of age x (i.e., if the Leslie population matrix was projected indefinitely):
(B2)
r i+
A æ ö ç Ht+1 å cx ÷ ç ÷ x=i = lim log ç ÷ A N ti + ® 0 ç H c ÷ ç tå x ÷ è x=i ø
or (B3)
log(Q) r i + = lim i+ Nt ®0
where again: (B4)
Q=
Ht +1 Ht
Thus, r is independent of the age-classes included and modeled in the quantity Pt. The same can be shown for the biomass quantity Bt. The same can also be shown if recruitment to Pt is not knife-edged at age i but occurs over a number of age-classes. Therefore, demographic methods to estimate r are also independent of the age or pattern of recruitment to the modeled population. © 2001 NRC Canada
J:\cjfas\cjfas58\cjfas-09\F01-114.vp Monday, August 27, 2001 2:14:40 PM